Research
May 13, 2021
Tax Day 2021: Despite Huge Paperwork Drop, Costs Stay Steady
EXECUTIVE SUMMARY
- The total projected cost of Internal Revenue Service (IRS) paperwork is $191 billion annually – a small decrease from last year’s projection.
- The number of hours spent on tax paperwork declined by 24 percent, to 6.1 billion hours.
- Though the estimated number of IRS paperwork hours has fallen over the last five years, that decrease is not commensurate with costs, which have stayed steady.
- Other metrics of IRS performance have declined, but nevertheless remain broadly in keeping with recent performance.
INTRODUCTION
For the second consecutive year, the Internal Revenue Service (IRS) extended the individual income tax filing deadline beyond its typical April 15 date. Following a three-month extension due to the COVID-19 pandemic in 2020, this year the IRS granted an additional month, in a nod both to the challenges the pandemic has had on filers and increasing tax complexity from federal programs designed to alleviate economic hardships it has caused.
Also atypical in 2021 is a substantial drop in the number of estimated hours it takes to complete federal tax paperwork. According to data from the Office of Information and Regulatory Affairs (OIRA), the estimated aggregate time burden required to complete IRS forms, when rounded, decreased 24 percent – to about 39.6 hours per taxpayer.[1] Unfortunately, the drop in hours fails to offer much in the way of savings – this study finds that the current annual cost is $191 billion, just 3 percent lower than in 2020.
METHODOLOGY
The American Action Forum’s (AAF) annual snapshot of IRS paperwork costs researches every active IRS Office of Management and Budget Control Number (collections of information or recordkeeping requirements) on Reginfo.gov, the government website that houses all federal paperwork information (as of May 11, 2021, for the purposes of this study). That search found 483 unique Information Collection Reviews (ICRs), which is how OIRA segments different paperwork requests from federal agencies, all of which contained IRS estimates of expected responses and burden hours. The IRS estimates the costs for just 13 of these ICRs, however, totaling $83.9 billion. To project costs for the rest, AAF applied the Bureau of Labor Statistics’ estimated average hourly wage for compliance officers ($36.35). The methodology is consistent with AAF’s previous Tax Day research.
RESULTS
What stands out in this year’s analysis is the nearly 2 billion-hour decline in the number of hours Americans spend completing tax forms. That drop is due to a major change in the government’s estimate for filling out the Business Income Tax Return (BITR). According to the IRS, it “re-baselined” its estimation model to account for new survey information on how the return is prepared – the decrease was not because of any substantive change in the tax code. The new baseline, coupled with projection data, led to a decline in burden for the BITR from 3.3 billion to 1.1 billion hours. The costs of filling out this return also dropped more than $17 billion. While the fall in burden hours was not offset by increases from other tax forms, most of those cost savings were – including a roughly $5 billion increase in the Individual Income Tax Return. As a result, aggregate compliance costs were only 3 percent lower than in 2020.
- Total Projected Cost: $191 billion
- Hours: 6.1 billion
- Forms: 1,247
- Average Hours per Paperwork Submission: 1.7
BURDEN HOURS AND COSTS OVER TIME
The drop in IRS paperwork burden from last Tax Day is the most substantial in a five-year trend of decline. The chart below shows the estimated number of hours it takes to fill out all IRS paperwork each year since 2016.
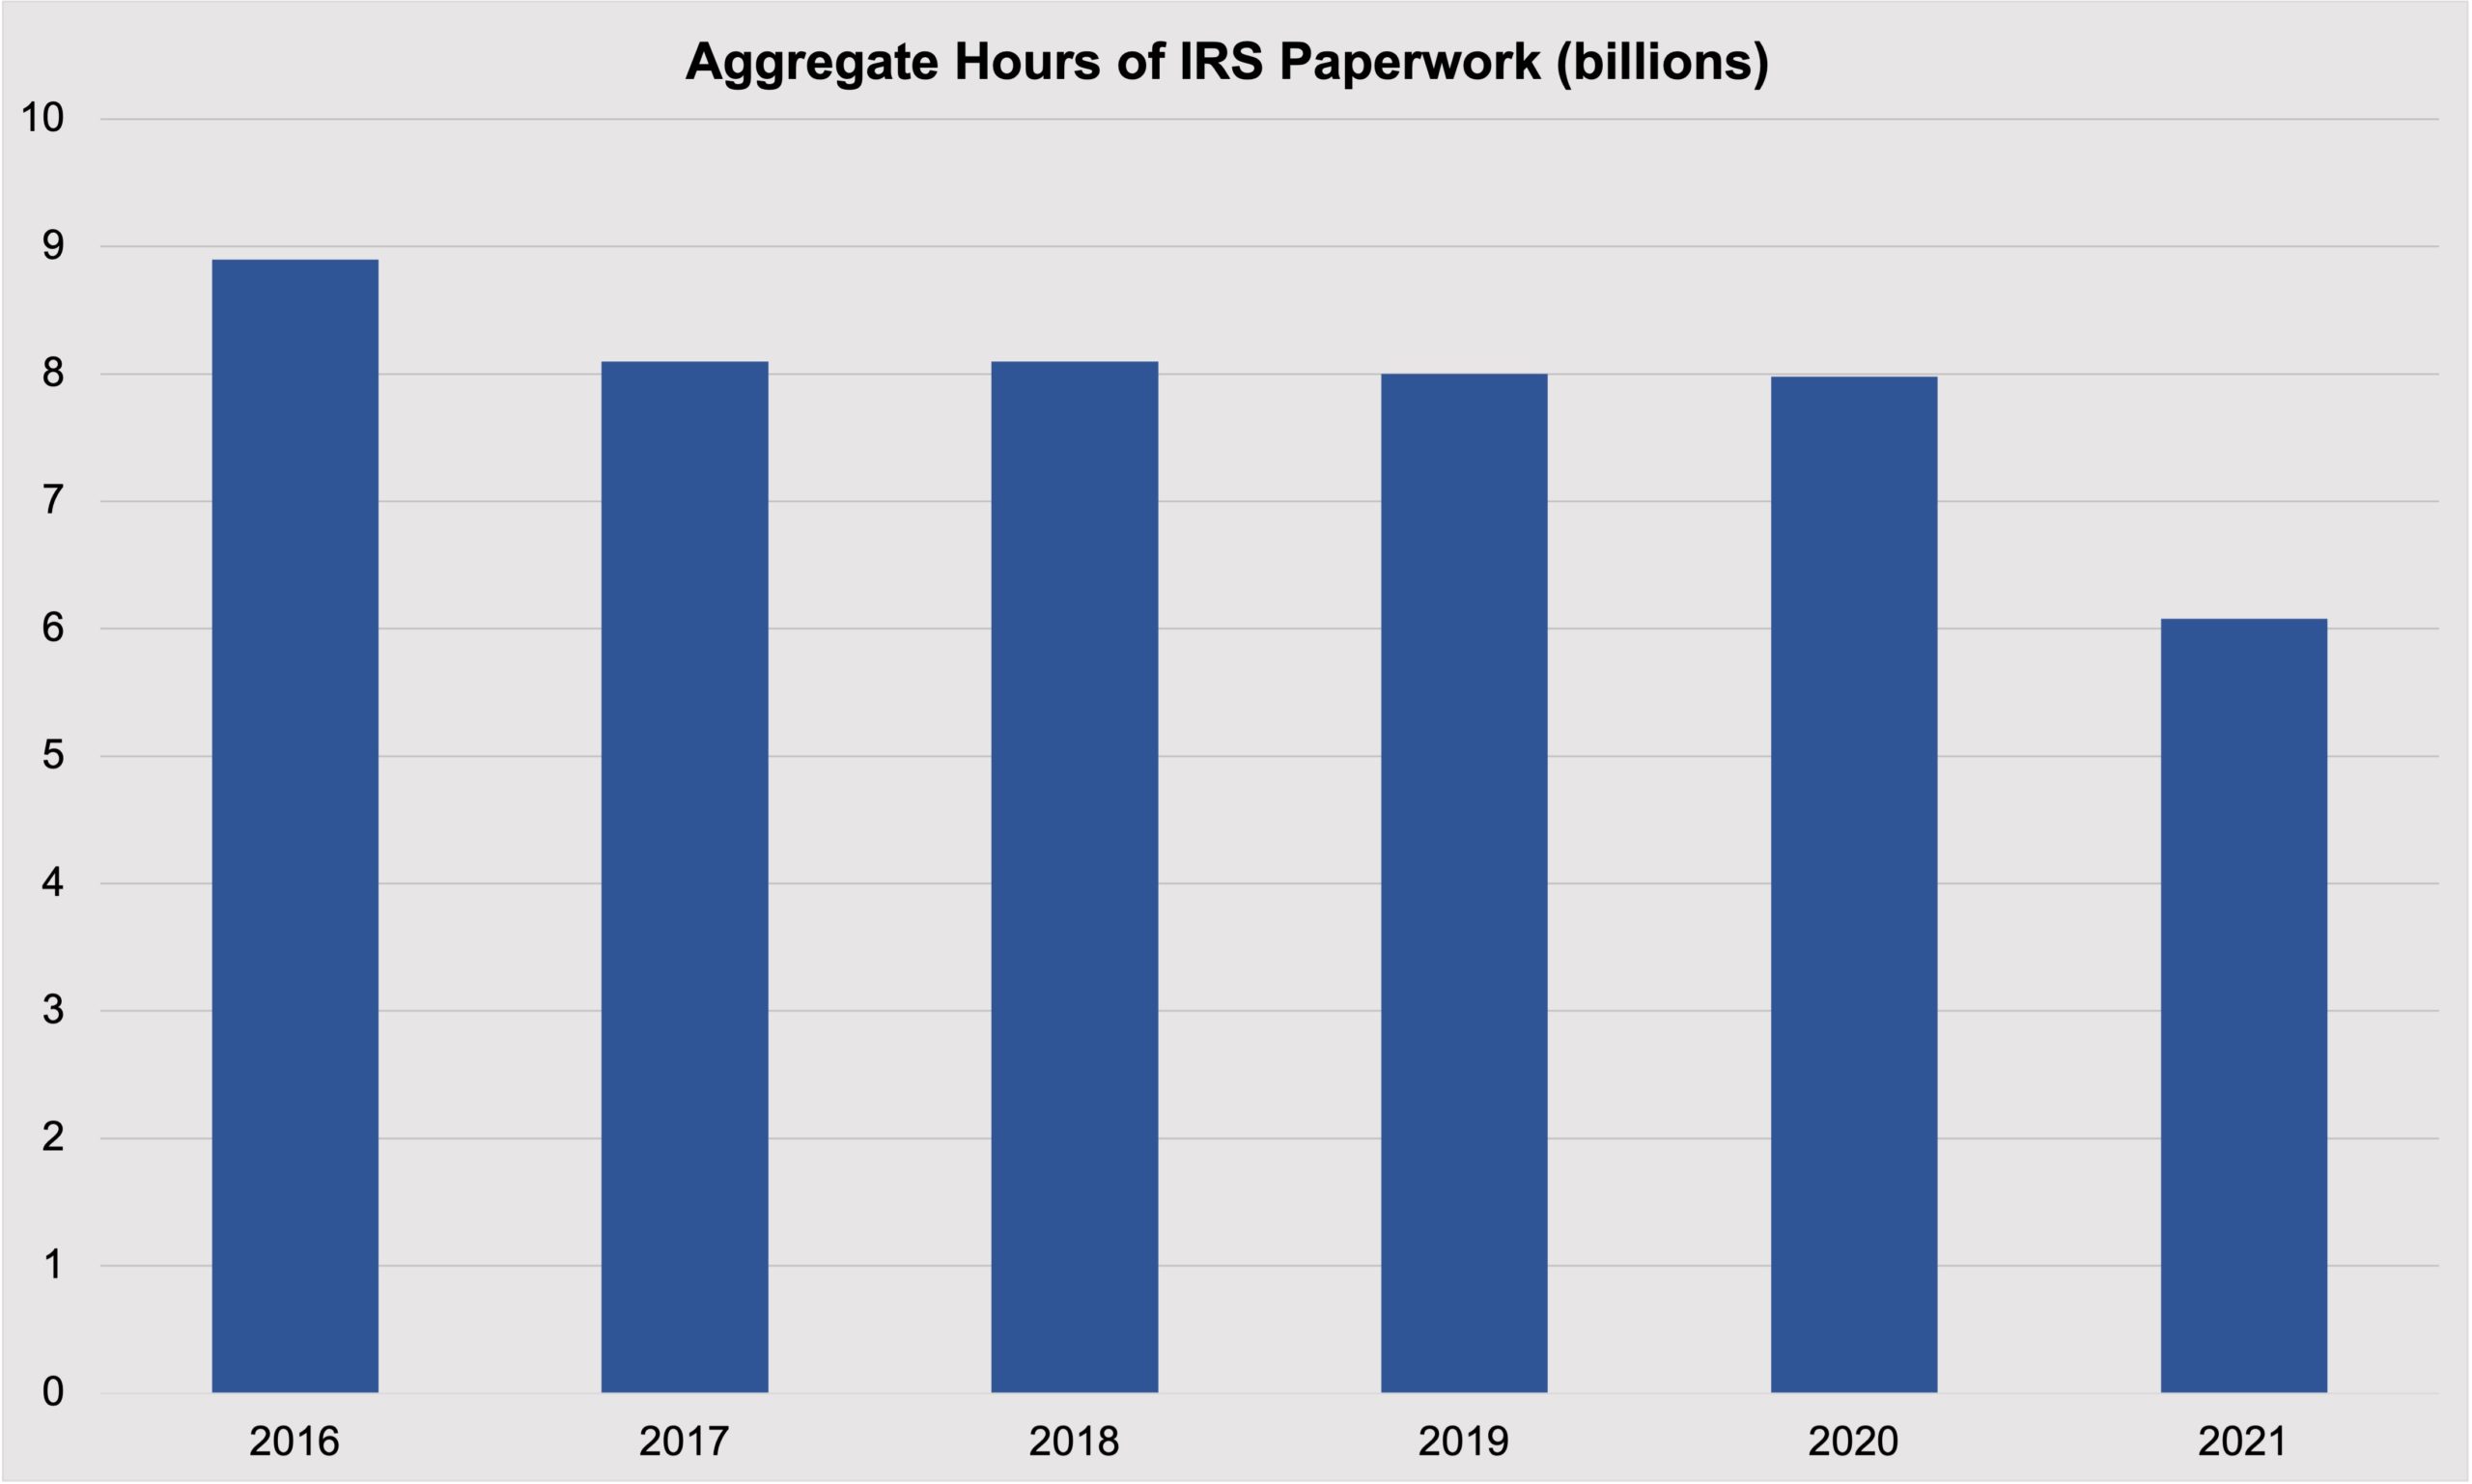
Yet costs have not fallen at commensurate rates. Since 2017, costs have remained relatively steady since a sharp increase in 2018, as shown in the chart below. (2016 is excluded due to an anomaly in the snapshot).
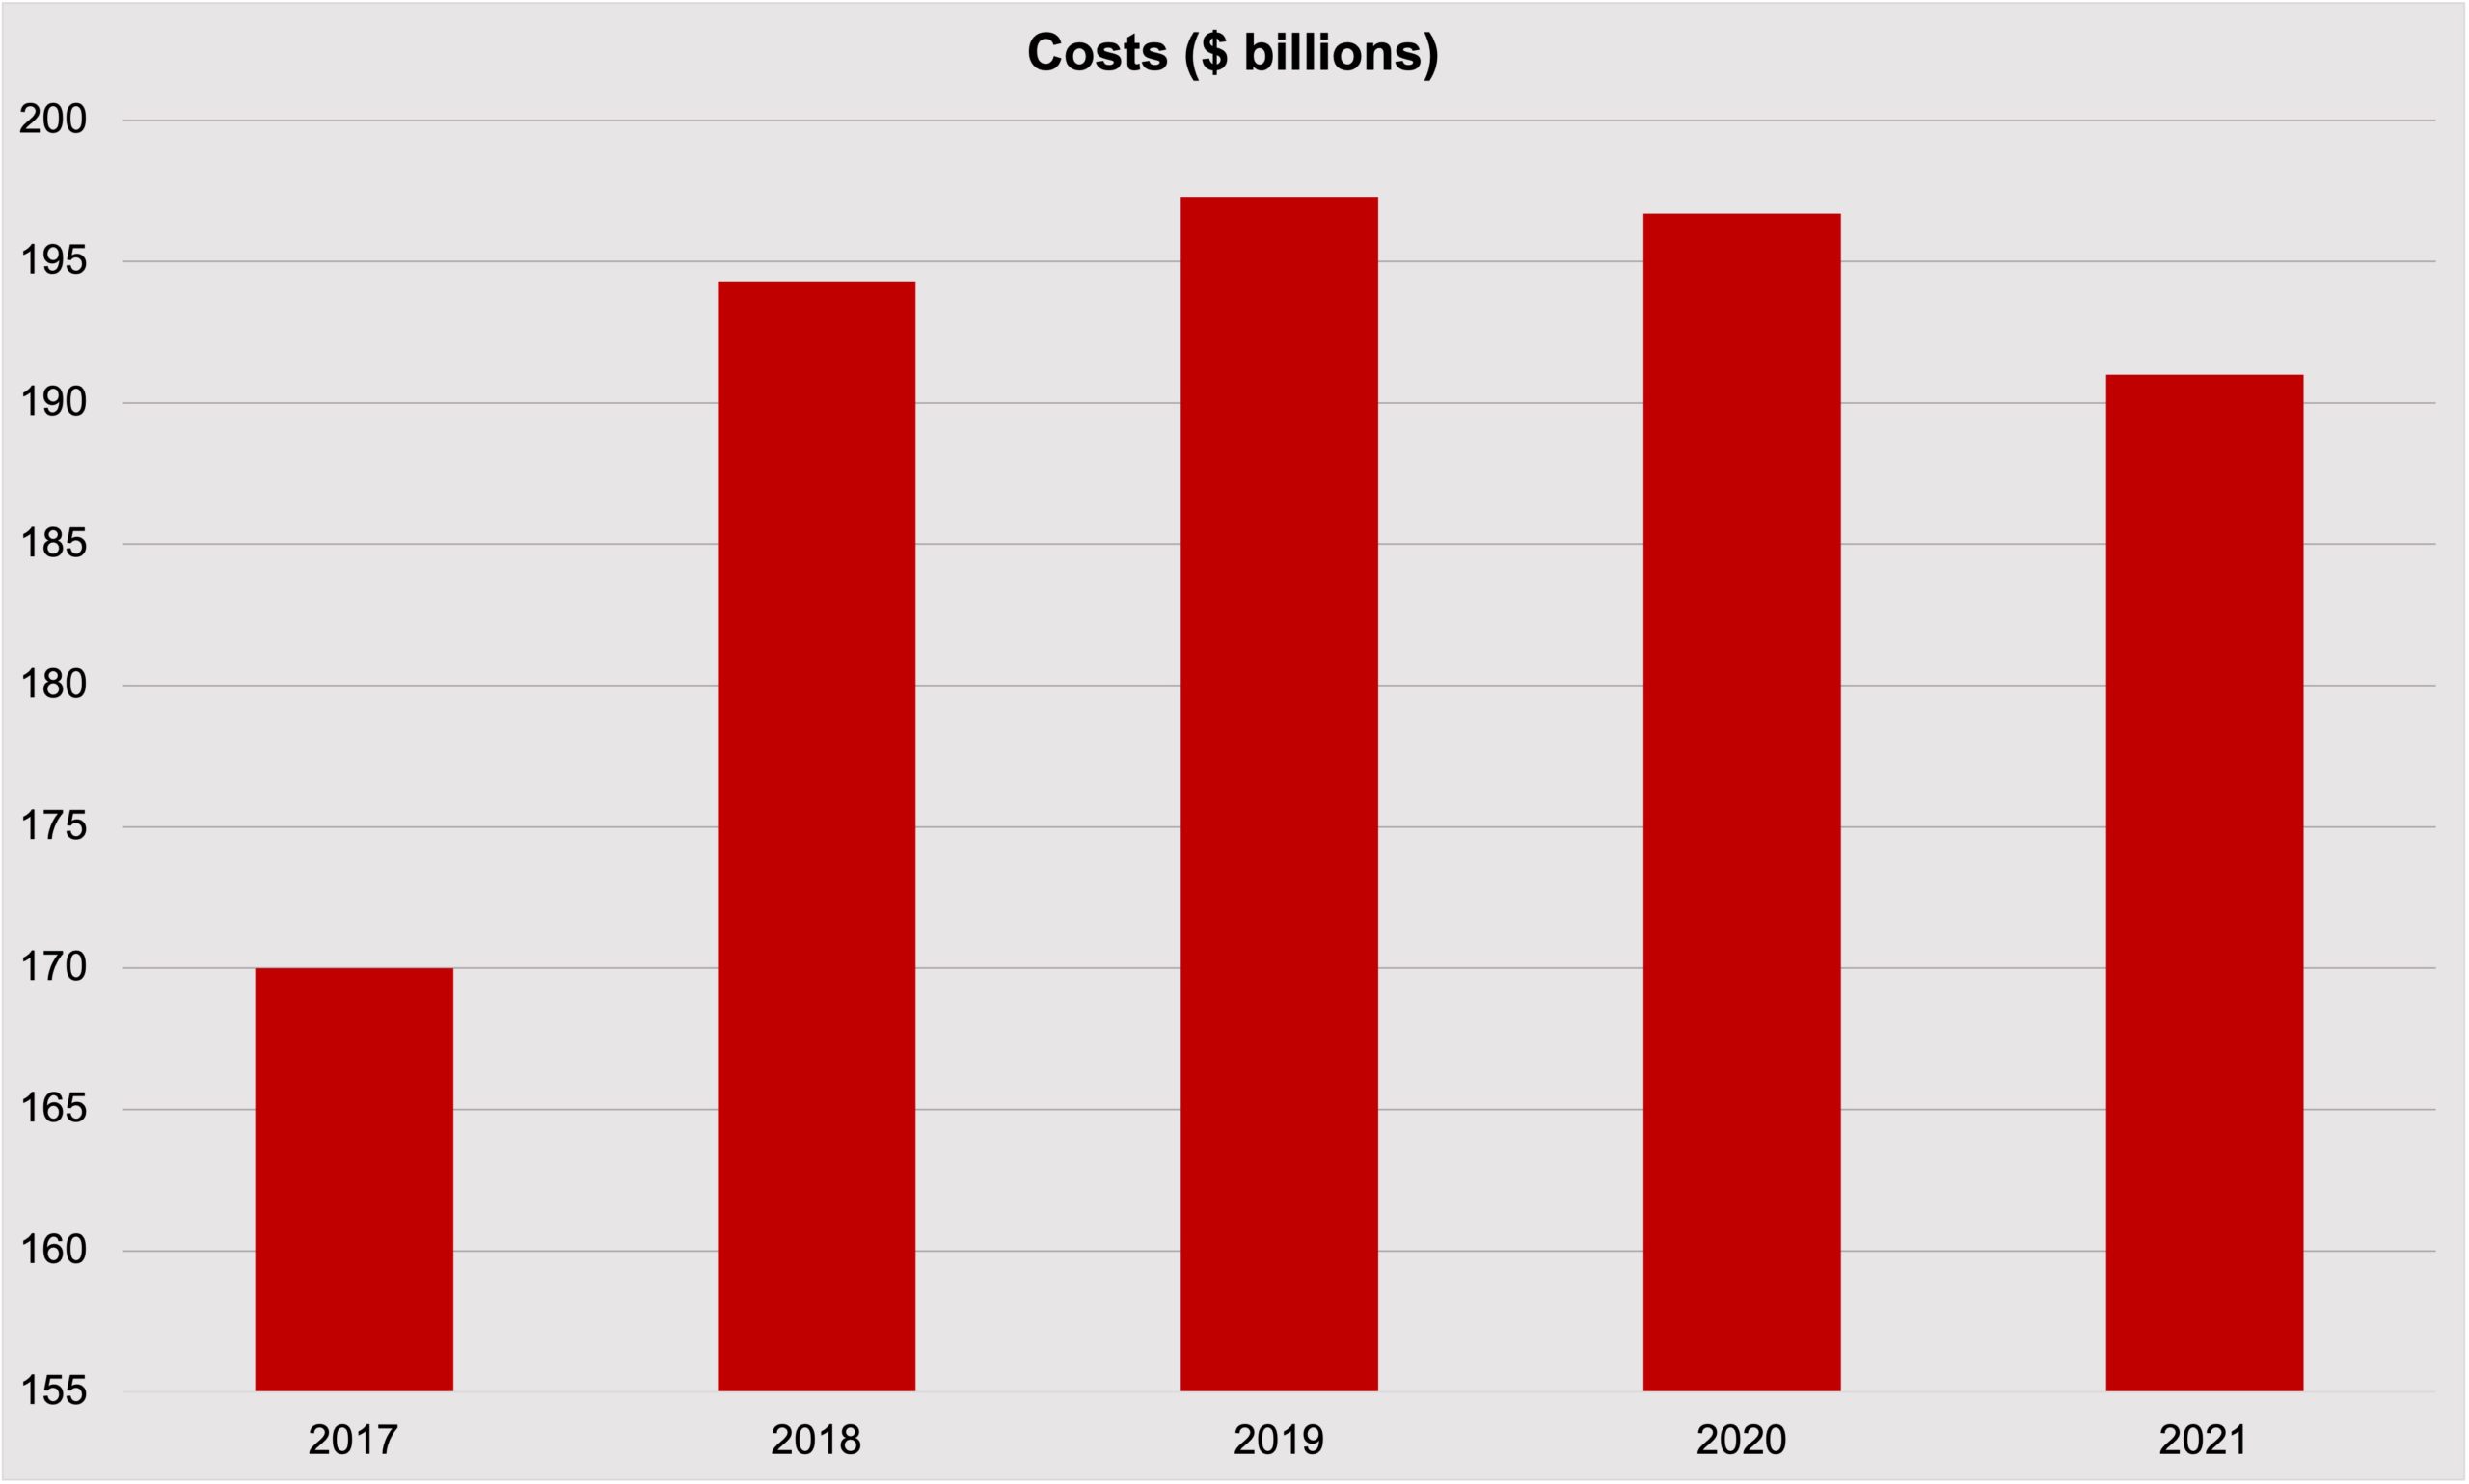
What is clear from the charts is that the number of paperwork hours is not highly correlated with total projected costs. The most likely reason is that not all paperwork hours are equal in terms of costs. For example, the Annual Return/Report for Employee Benefit Plans costs $152.24 per hour while the BITR costs $40.81. Americans spend fewer than 1 million hours on the former, however, while the latter accounts for more than 1 billion hours. Thus, even the substantial decrease in hours for the BITR over the past year doesn’t move the cost savings needle very far, especially when including incremental cost increases in the vast majority of the other ICRs.
COSTLIEST ICRs
The costliest ICRs remain unchanged from last year, although due to a decrease of $17 billion in estimated costs for the BITR and a roughly $5 billion increase in the Individual Income Tax Return, the gap has narrowed significantly. The following ICRs are those with compliance costs of more than $10 billion annually. Combined, they comprise 81.3 percent of all IRS paperwork compliance costs.
| Collection | Cost ($ Billions) |
| U.S. Business Income Tax Return | 44.3 |
| U.S. Individual Income Tax Return | 38.0 |
| Proceeds from Broker and Barter Exchange Transactions | 23.6 |
| Employer’s Quarterly Federal Tax Return | 20.3 |
| Form 4562 – Depreciation and Amortization | 15.7 |
| U.S. Income Tax Return for Estates and Trusts | 10.8 |
Despite the changes in its estimates, the BITR remains the largest source of burden from IRS paperwork. According to IRS estimates, it takes 11.8 million filers an average of 92 hours to complete the return annually at a total cost of $44.3 billion. By comparison, the IRS estimates that it takes the 164.5 million filers of the Individual Income Tax Return about 12 hours per return, for a total cost of $38 billion.
Five ICRs have an average hourly cost above $100. These five collections are:
| Collection | Cost/Hour |
| Continuing Education Provider Application and Request for Provider Number | 801.70 |
| Affordable Care Act Internal Claims and Appeals and External Review Disclosures | 503.41 |
| Status as a Grandfathered Health Plan under the Patient Protection and Affordable Care Act | 165.23 |
| Annual Return/Report of Employee Benefit Plan | 152.24 |
| Notice of Medical Necessity Criteria under the MHPAEA | 134.14 |
ALTERNATIVE MEASURES OF TAX COMPLIANCE COSTS
A number of studies have attempted to capture the cost to the taxpayer and the economy of administering the U.S. tax system. A 2019 study by the Bipartisan Policy Center provides an excellent survey of recent estimates.[2] The Taxpayer Advocate Service (TAS) has also reviewed recent attempts at capturing the cost of the U.S. tax code, noting that experts have embraced a range of methodologies for these calculations.[3] TAS, for example, estimated the 2015 cost of income-tax compliance at $195 billion. The Tax Foundation estimated that compliance costs amounted to $406 billion in 2016.[4] Subsequent estimates that include additional cost considerations and alternative approaches to monetizing the hours spent complying with the tax code alter these estimates considerably. Fichtner and Feldman completed a thorough assessment of the costs that the U.S. tax code extracts from the economy through complexity and inefficiency, beyond TAS’s estimate. According to the authors, in addition to time and money expended in compliance, foregone economic growth and lobbying expenditures amount to hidden costs estimated to range from $215 billion to $987 billion.[5]
These estimates provide valuable context and, despite some differences, are noteworthy for the relative similarity in magnitude and direction. These estimates do not reflect costs associated with the changes from the Tax Cuts and Jobs Act (TCJA), which substantially reformed individual and business taxation. For many taxpayers on the individual side, the TCJA likely made filing incrementally less onerous. According to a more recent study by the Tax Foundation, for individual filers the TCJA reduced the cost of compliance by $3.1 billion to $5.4 billion.[6]
Other measurements beyond mere time and pecuniary estimates reflect the cost of compliances. Tax compliance is so onerous for individual taxpayers that over 90 percent used a preparer or tax software to submit their returns.[7] TAS uses the IRS’s ability to answer taxpayer telephone calls and its ability to respond to taxpayer correspondence as key metrics for taxpayer service. TAS reports the IRS received 100.5 million calls to its customer service lines in fiscal year (FY) 2020, which is up from FY2019 by about 1.2 million calls. This rise reflects the decline in in-person assistance at IRS walk-in centers, which fell by about 1 million. TAS reports that 24 percent of these calls were answered in FY2020, with an average speed of an answer at just over 18.3 minutes.[8] While these figures reflect growing call volume, decreased rates of service and responsiveness, they nevertheless are relatively consistent with prior years, which is remarkable given the disruption and workload confronting the IRS.
CONCLUSION
Despite a substantial decrease in the number of hours Americans spend on tax paperwork, the overall projected cost to comply stayed steady. Though taxpayers may appreciate spending fewer hours on one of their least favorite tasks, that reduction has not been reflected in their bank accounts.
[1] Internal Revenue Service Research, Applied Analytics, and Statistics, Statistics of Income Division, Fiscal Year Return Projections for the United States Publication 6292 (Rev. 9-2020) Washington, D.C. 20224, (Table 3).
[2] https://bipartisanpolicy.org/report/tax-administration-compliance-complexity-and-capacity/
[3] National Taxpayer Advocate. “Annual Report to Congress.” Taxpayeradvocate.irs.gov. Internal Revenue Service Web. https://www.taxpayeradvocate.irs.gov/reports/2016-annual-report-to-congress/ See also Government Accountability Office (GAO), GAO-05-878, Tax Policy: Summary of Estimates of the Costs of the Federal Tax System (Aug. 2005), https://www.gao.gov/products/gao-05-878
[4] https://taxfoundation.org/compliance-costs-irs-regulations/
[5] Fichtner, Jason J. and Jacob M. Feldman, “The Hidden Costs Of Tax Compliance.” Mercatus Center 2015 Web. http://mercatus.org/sites/default/files/Fichtner-Hidden-Cost-ch1-web.pdf
[6] https://taxfoundation.org/different-methods-calculating-tax-compliance-costs/#_ftn12
[7] https://www.gao.gov/assets/700/699000.pdf
[8] https://www.taxpayeradvocate.irs.gov/wp-content/uploads/2021/01/ARC20_FullReport.pdf