


Comments for the Record
May 16, 2017
Comments to EPA on Evaluation of Existing Regulations
Thank you for the opportunity to comment on the evaluation of the Environmental Protection Agency’s (EPA) existing rules and whether some should be repealed, replaced, or modified. The American Action Forum (AAF) has benefit-cost estimates on every federal rule published since 2005. Because these figures represent ex ante costs, they might have limited value decades after publication. We have also started compiling a “library” of retrospective review studies that evaluate the benefits and costs of existing rules.
In this comment, I would like to share data on previous EPA rules where the initial cost estimates exceeded benefits. Perhaps these would serve as ripe areas for further review to determine their effectiveness. In addition, a list of rules will be provided where the benefits and costs varied widely from the initial projections. Again, for rules where benefits were drastically lower than projected, this subset of regulations might prove valuable to reevaluate under Executive Orders (EO) 13,771 and 13,777.
Costs Exceed Benefits
According to AAF records, there have been nine regulations, from 2005 to 2016, where annual costs have exceeded projected benefits. The chart below contains the nine rules (from recent to oldest) and their “Regulatory Identification Number” (RIN).
|
Rule |
RIN |
Annual Cost |
Annual Benefit |
|
Hazardous Waste Revisions |
2050-AG77 |
$2.4 million |
$0.7 million |
|
Effluent Limitations Guidelines |
2040-AF14 |
$471 million |
$433 million |
|
Agricultural Pesticide Protections |
2070-AJ22 |
$424 million |
$64 million |
|
Coal Combustion Residuals |
2015-00257 |
$509 million |
$236 million |
|
Cooling Water Intake Structures |
2040-AE95 |
$297 million |
$29 million |
|
2013 Biomass-Based Diesel Standards |
2060-AR55 |
$381 million |
-$52 million |
|
Point-Source Limitations Guidelines |
2040-AE91 |
$810 million |
$369 million |
|
Hazardous Waste Combustors |
2050-AE01 |
$22 million |
$6 million |
|
Performance for New and Existing Sources |
2060-AJ65 |
$896 million |
$2 million |
|
Totals |
$3.8 billion |
$1.08 billion |
|
Combined, the net cost for the above rulemakings exceeds $2.7 billion, with an average cost-to-benefit ratio of 52 to 1. These rules also generated more than 14.5 million paperwork burden hours, the equivalent of forcing 7,200 full-time employees into federal recordkeeping duties.
However, with any rulemaking more than a few years old, there could be limited savings to amendment or repeal, given that the sunk costs of many federal rules are imposed in years one and two of compliance. For instance, the “New and Existing Sources” measure was struck down by a federal court and replaced with a far more stringent rule in 2012 (MATS). Likewise, there are probably no immediate gains from amending the 2013 Biomass-Based Diesel standards, but the overall program could be evaluated for potential savings.
For many rules on the above list, there was no legal deadline to implement the measure, providing some leeway for EPA to amend the standards under EOs 13,771 and 13,777. For example, the “Hazardous Waste Revisions” and “Agricultural Pesticide Protections” did not have statutory or legal deadlines to implement the standards. Regardless of the legal background, these rules initially, at least on paper, imposed more burdens on society than they generated in benefits. Revisiting them, through a thorough program evaluation, could provide cost-savings and increase the effectiveness of these regulations.
Retrospective Research
Thankfully, there is some recent research that has examined the success, and in some instances, erroneous assumptions used to justify past rules. AAF examined three past EPA rules and found:
- EPA’s 2012 to 2016 CAFE standards overestimated the price of future gasoline and as a result, likely overstated the benefits of the rule. Consumers have not been purchasing newer, fuel-efficient cars at the same rate as originally predicted. Long-term gas prices that fall below initial projections could impact the 2022 to 2025 standards as well.
- The 2008 Ozone standards resulted in a loss of $56.5 billion in earnings for workers in nonattainment counties ($690 per worker). In addition, nonattainment counties lost 242,000 jobs between 2008 and 2013. This has implications for the recently-promulgated 2015 standards.
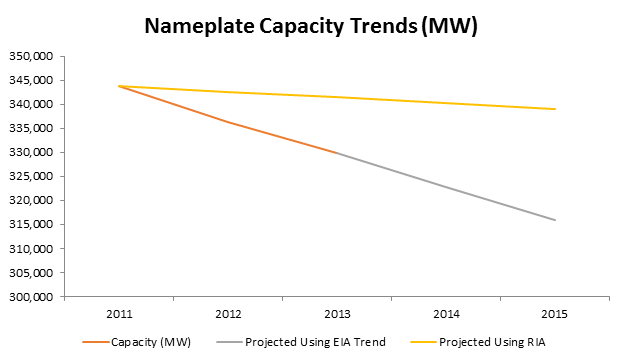
- EPA projected coal would generate 339,057 megawatts of power in 2015 after implementation of its “Mercury Air Toxics Standard” (MATS). Instead, coal generation fell to 315,873 megawatts, a difference of roughly 6.8 percent. This error will likely increase as retirements accelerate. As EPA evaluates the rule, taking into consideration the impact on coal generation, relative to earlier projections, could aid in determining if amendments to the regulation could reduce costs while maintaining effectiveness. The following chart depicts EPA’s original prediction with actual coal generation:
In addition to AAF’s work, academic and other non-profit research has generated a wealth of information on the actual effects of EPA rules. For example, a 2012 review from the George Washington Regulatory Studies Center found, “uncertainty in air quality improvements and in baseline mortality” from lower particulate matter standards. A review in the Journal of Benefit-Cost Analysis of 1998 Locomotive Emissions Standards found the initial per-unit compliance costs were higher than predicted by EPA, although the total cost figure remains uncertain. Given that this rule is nearly a generation old, there might be limited value in making substantive amendments, but this research could inform future regulatory efforts.
In a December 2016 National Bureau of Economic Research (NBER) working paper, Professors Lucas Davis and Christopher Knittel concluded that fuel economy standards are regressive, and far more regressive than carbon taxes. According to the authors, the average vehicle fuel economy tax on the bottom quintile of earners is more than 0.5 percent, twice as large as the top decile. They concluded, “[O]nce used vehicles are incorporated, CAFE becomes sharply regressive, with low-income households experiencing welfare losses that are three times as large as a percent of income as those experienced by high-income households” (emphasis in the original). Again, this has profound implications as EPA reviews the 2022 to 2025 CAFE standards. In addition to the economic impact on manufacturers, the regressive nature of the efficiency standards is just as notable.
Finally, a 2015 study from Resources for the Future (RFF) found EPA’s 1998 “Cluster Rule” generated significant reductions in chloroform releases, about what was predicted in the original analysis. The RFF study also concluded that reductions in air toxics and VOC were smaller than original predictions. Another 2015 study from RFF examined EPA’s Air Toxics Program under Section 112 of the Clean Air Act. The authors concluded plants in the printing and publishing industries experienced declines in their air toxics emissions. However, plants in the refining, pharmaceutical, and wood furniture industries, “achieved little or no additional reduction in air toxics emissions over the compliance period.”
Regardless of the whether the above studies aid in finding rules to amend or rescind, virtually everyone agrees that programs should be judged by their results, as opposed to their intentions. It is our hope that not only will EPA conduct thorough program evaluations of past rules to judge their effectiveness, but that, in compliance with EOs 13,563 and 13,610, the agency will provide important metrics for success for future rules. Determining whether a rule has imposed more benefits than costs, or the opposite, should not just be the province of academics and those in the policy community.
EPA’s Place in Regulatory Environment
Broadly, there are plenty of major rules from just 2009 to the present which EPA can review. On major rules alone, EPA has issued 46 since 2009, more than 27 other agencies, trailing just Agriculture (47), Interior (51), and Health and Human Services (180). In terms of costs, however, no agency approaches EPA. Since 2009, regulators have published $904 billion in total costs; EPA is responsible for $344 billion, or 38 percent. By contrast Energy has imposed $196 billion in burdens and Health and Human Services has generated $73 billion in costs.
Many of EPA’s burdens are the result of statutory language in the Clean Air Act and judicial deadlines to implement rules. However, for rules outside of this subset, EPA still has discretion to amend rules to comply with EOs 13,771 and 13,777. We believe the agency can achieve the dual goals of reducing administrative burdens while concurrently fulfilling the original regulatory objective. Indeed, AAF found 49 instances since 2005 when EPA reduced regulatory costs, totaling more than $1.3 billion in fewer annual burdens. We see little reason why these past successes can’t be duplicated and augmented in the future.
In conclusion, with more than $344 billion in past regulatory burdens, there are plenty of areas EPA could examine for regulatory relief. AAF counted at least nine past rules where costs exceeded benefits. In the future, a robust retrospective review program and a focus on achieving results can reduce regulatory costs and fulfill the goal of EOs 13,771 and 13,777. Please feel free to contact me via phone or email if you have any questions or concerns about our comment.

March 27, 2024
Comments for the Record
Comments on the Rural Digital Opportunity Fund
Jeffrey Westling
COMMENTS OF JEFFREY WESTLING[1] The Federal Communications Commission designed the Rural Digital Opportunity Fund (RDOF) to ensure continued and rapid…