


The Daily Dish
June 10, 2019
Inhale, Exhale, Don’t Panic. Worry.
The May employment report — which showed “only” 75,000 new jobs — generated a lot of doomsday reporting, since the economy had averaged 223,000 jobs a month in 2018 and 186,000 jobs per month in 2019. But that is really not something to panic about.
As Eakinomics has noted before, the U.S. population is growing at an annual rate of just a tick above 0.7 percent. That means that if the labor force participation rate stays constant (which has been a great accomplishment in an aging population) and the unemployment rate stays constant (which is an even bigger upset) then employment should grow at roughly 0.7 percent annually. That would mean 90,000 jobs a month – exactly what the private sector produced in May (there was a loss of 15,000 government jobs).
Slower job growth is the economy’s demographic destiny. The May report was inevitable; the only question is when it would finally happen. In short, ignore the jobs number and don’t panic.
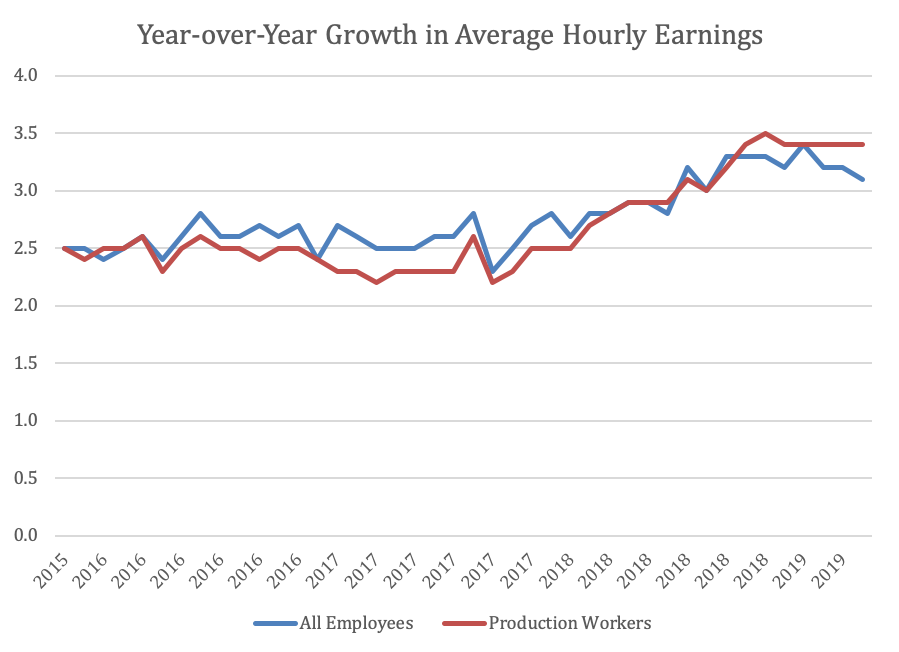
Similarly, some commentators raised the specter that the labor market’s other main accomplishment – rising wages – was beginning to wane. The genesis of this concern is shown in the blue line of the chart below, which displays the growth in average hourly earnings for all employees, measured from the same month one year earlier. The growth had been solidly in the 3.3 to 3.4 percent range, but has fallen off in the past three months. Maybe panic is appropriate after all?
No. The red line shows the same calculation using data on non-supervisory and production workers – “real” workers who are the most likely to be the marginal hires. Here there is no evidence of softness that would suggest that the demand for labor had dropped off significantly.
So again, stop worrying about the employment report. There will be more like it in the future and it is not cause for panic.
What one should worry about is the health of household spending, which constitutes 70 percent of near-term economic growth. The chart below shows data from the monthly survey of personal income and outlays by the U.S. Census Bureau. The unemployment rate is quite low – for some demographics at record lows – while jobs are being created at or above the rate dictated by labor force growth, wages are rising faster than inflation, and household balance sheets show no particular weakness. In those circumstances, household spending growth should be as solid as a rock.
Yet it is not. Since late 2018, it has shown considerable weakness. Had it not been for an (annualized) 11.4 percent growth in March 2019, it would be hovering near zero. That is a cause for real worry.
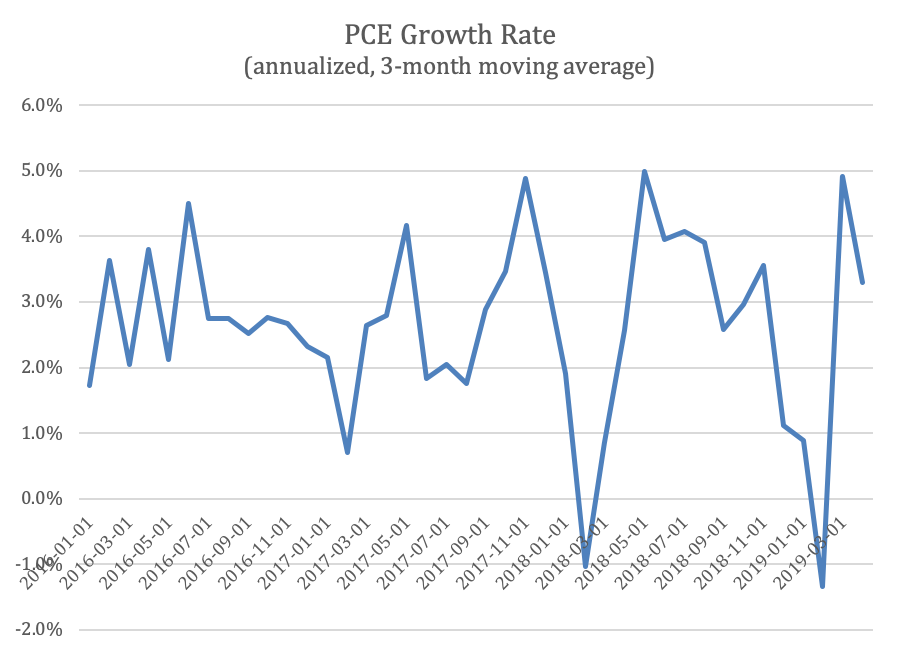
Moreover, it takes place despite the fact that consumer confidence has recovered from a turn-of-the-year decline. That suggests that households are willing to spend, but that economic circumstances are inhibiting the growth in spending. The most likely candidate is the upward price pressure coming from tariffs on Chinese (and other) goods, but regardless of the source it is a development to be monitored closely.
Fact of the Day
The typical size of hospital merges and acquisitions (measured in the seller’s revenue) is growing at an average rate of 13.8 percent each year.
