


The Daily Dish
June 30, 2022
Market Concentration and Inflation
Today at 8:30 a.m., the Bureau of Economic Analysis (BEA) will release the May data on personal income and outlays. A key indicator included in the report is the personal consumption expenditures (PCE) price index – the Federal Reserve’s preferred measure of inflation. (Indeed, the really, really preferred measure is the PCE price index that excludes food and energy, or “core” PCE inflation, and is based only on market transactions, or “market-based core PCE.” Now you are fully prepped for your next cocktail party conversation.)
The previous report showed PCE inflation at a rate of 6.3 percent. PCE inflation is lower than Consumer Price Index (CPI) inflation because it is based on the composition of goods and services households are buying right now, while the CPI is based on the composition in the recent past. As people shift to lower-cost items, the lower-priced receive a greater weight in the PCE measure, leading to lower measured inflation. Regardless of the May reading, it will likely rekindle the debate over the causes of the worst inflation in four decades.
What’s the answer? Well, we know one thing: The wrong answer is high or rising market concentration. That’s the lesson of Fred Ashton’s new piece for AAF.
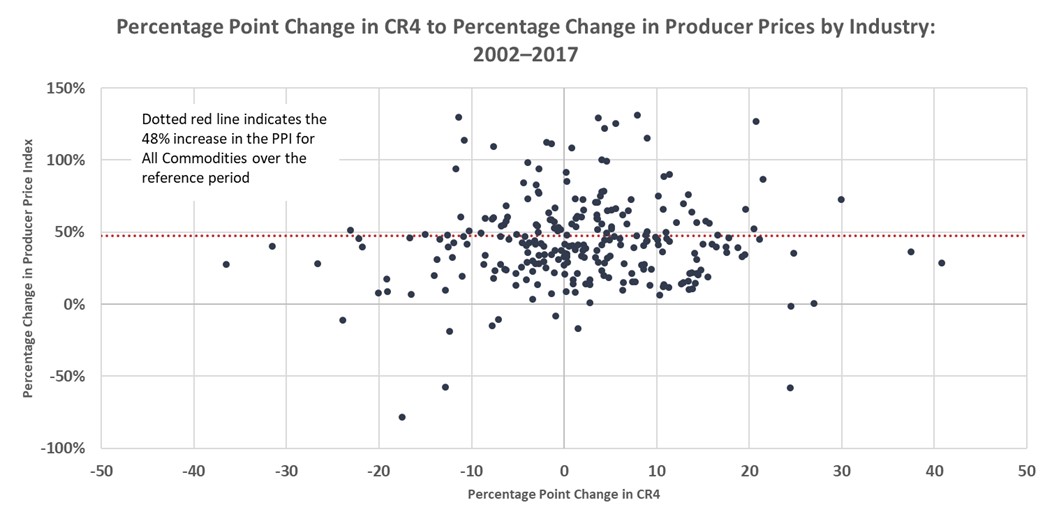
Ashton focuses on Producer Price Index (PPI) inflation because, according to BLS, PPI “measures the average change over time in prices received by producers for domestically produced goods, services, and construction. PPIs measure the price changes from the perspective of the seller.” This is useful because Ashton links the PPI inflation to changes in market concentration. If rising concentration is producing market power that permits firms to raise their prices, the right price to look at is the one they receive. The measure of market concentration, labeled CR4 in the paper, is the share of sales accounted for by the four largest firms.
The essence of Ashton’s tale can be summarized by two graphs (neither of which is the coolest graph in the paper – Eakinomics will leave that for the reader to discover). As shown below, there is no relationship (correlation) between the change in concentration between 2002–2017 for roughly 260 industries and the change in prices in those industries.
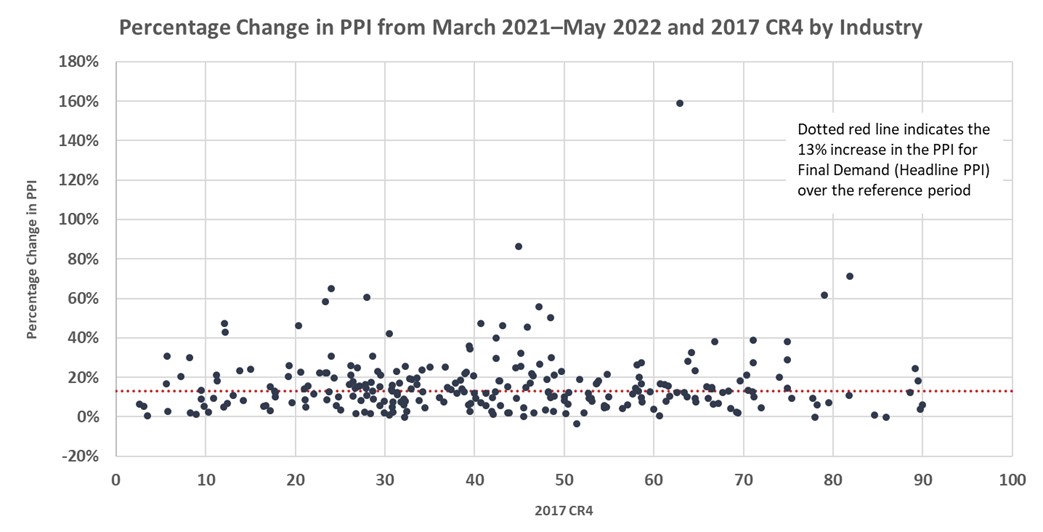
Similarly, there is no correlation between recent inflation in each industry and the level of concentration in these industries.
Rising market concentration has been blamed for inflation, suppressing the entry of new firms, and the need for revised antitrust laws. The only problem? It’s not true.
Fact of the Day
As of June 22, the Fed’s assets stood at $8.9 trillion.
