Insight
July 5, 2017
Comparing Premium Tax Credits Under the BCRA and AHCA
On Thursday, June 22nd, the Senate released a discussion draft of the “Better Care Reconciliation Act” (BCRA), their response to the House’s American Health Care Act (AHCA).[1],[2] One of the notable differences between the two bills’ market reform provisions is the structure of the premium tax credit that subsidizes the purchase of insurance in the individual market.[3]
BCRA Tax Credit Structure
The BCRA premium tax credit is determined by three factors: income, age, and a benchmark plan’s premiums.
Income and Age Adjustments
First, the BCRA’s premium tax credits would be determined by income. Only those households that fall under 350 percent of the federal poverty level (FPL) would be eligible to receive any premium tax credit. The credit is determined as the difference between the “maximum income contributions” and the premium for a benchmark plan. Table 1 shows the maximum income contributions for various incomes below 350 percent FPL. Note that the maximum income contribution is smaller for households with lower FPLs. This is most easily seen by looking down the column for a particular age bracket.
Second, an age adjustment is imposed onto maximum income contribution percentages for each household between 150 and 350 percent FPL so that older people pay a higher percentage of income than younger people. Table 1 illustrates this and is easily seen by looking across the row for any particular FPL.
Table 1. Maximum Income Contribution Levels under BCRA
|
FPL Level |
Under 30 |
30-39 | 40-49 | 50-59 |
60 or higher |
|||||
|
Initial % |
Final % | Initial % | Final % | Initial % | Final % | Initial % | Final % | Initial % |
Final % |
|
|
Up to 100% |
2.0 |
2.0 | 2.0 | 2.0 | 2.0 | 2.0 | 2.0 | 2.0 | 2.0 |
2.0 |
|
100-133% |
2.0 |
2.5 | 2.0 | 2.5 | 2.0 | 2.5 | 2.0 | 2.5 | 2.0 |
2.5 |
| 133-150% |
2.5 |
4.0 | 2.5 | 4.0 | 2.5 | 4.0 | 2.5 | 4.0 | 2.5 |
4.0 |
| 150-200% |
4.0 |
4.3 | 4.0 | 5.3 | 4.0 | 6.3 | 4.0 | 7.3 | 4.0 |
8.3 |
| 200-250% |
4.3 |
4.3 | 5.3 | 5.9 | 6.3 | 8.05 | 7.3 | 9.8 | 8.3 |
10 |
| 250-300% |
4.3 |
4.3 | 5.9 | 5.9 | 8.05 | 8.35 | 9.8 | 10.5 | 10.0 |
11.5 |
|
300-350% |
4.3 | 6.4 | 5.9 | 8.9 | 8.35 | 12.5 | 10.5 | 15.8 | 11.5 | 16.2 |
Figure 1 below illustrates the continuous scale for maximum income contributions by showing the dollar value of the most that each age will pay at each FPL percentage. Note that there is no age adjustment for incomes below 150 percent FPL.
Figure 1. Income Contributions Under the BCRA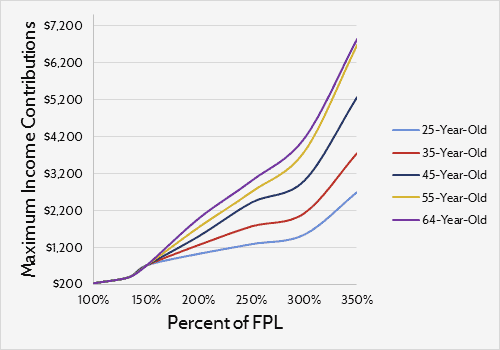
Benchmark Plan
The BCRA also outlines requirements for a “benchmark plan” upon which the tax credits will be determined. According to the bill, only plans with a 58 percent actuarial value will be eligible to be considered as a benchmark, and the eligible plan with the median premium within each rating area would be the benchmark. The premiums for this benchmark would then be used in tandem with the maximum income contribution levels outlined in Table 1 to determine the actual amount of the premium tax credit.
Figure 2 below serves as a quick example of what tax credits under the BCRA might look like. To generate the amounts in the graph, the average premium for the lowest-cost bronze plan for the 2017 health exchanges was used—$366 monthly.[4] Assuming this premium represents the current rate for individuals roughly 45 years old, it was then adjusted for age based on a 5:1 age rating curve. For those at 100 percent FPL, a 25-year-old would receive a credit of about $3,000 and a 64-year-old would receive roughly $15,900. At the highest incomes eligible to receive tax credits, 350 percent FPL, a 25-year-old would receive an annual credit of $560 while a 64-year-old would receive a credit of $9,300.
Figure 2. Estimated Annual Tax Credit Under BCRA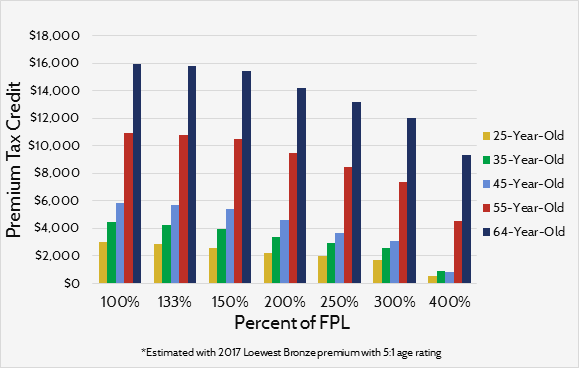
A counterintuitive aspect of this credit structure is that older consumers would receive a greater tax credit even though the BCRA credit adjusts for age so that older consumers are required to contribute more of their income towards premiums. This happens because the BCRA would allow premiums to vary at a 5:1 ratio and the credits are closely tied to them. Ultimately, older consumers receive a higher credit because their premiums are four to five times greater.
AHCA Tax Credit
Unlike the BCRA tax credit, the AHCA tax credit would be mostly determined by age; income plays a smaller part. The AHCA’s tax credit would begin at $2,000 for everyone below 30-years-old and ends at $4,000 for everyone 60 years and older. It’s doubled for households with joint filers and families can receive tax credits for up to three dependents. Table 2 below outlines the credit.
Table 2. AHCA Premium Tax Credit Structure
| Single | Filing Jointly | Filing Jointly with 1 Dependent | Filing Jointly with 2 Dependents | Filing Jointly with 3 Dependents | |
|
Under 30 |
$2,000 | $4,000 | $6,000 | $8,000 |
$10,000 |
| 30s |
$2,500 |
$5,000 | $7,000 | $9,000 |
$11,000 |
| 40s |
$3,000 |
$6,000 | $8,000 | $10,000 |
$12,000 |
| 50s |
$3,500 |
$7,000 | $9,000 | $11,000 |
$13,000 |
| 60 and Over |
$4,000 |
$8,000 | $10,000 | $12,000 |
$14,000 |
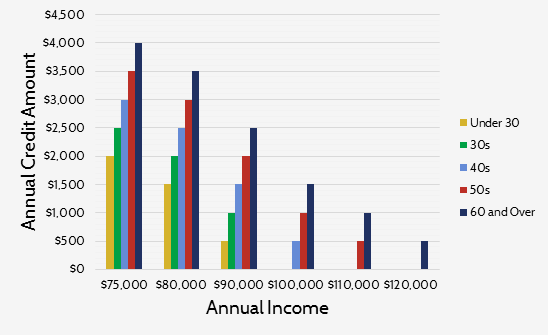
The AHCA tax credit does have an income adjustment of sorts. At incomes above $75,000 ($150,000 for households with joint-filers), the credit begins to phase out. The credit would decrease by 10 percent of the difference between the consumer’s income and income threshold above. For example, a 25-year-old individual with an income of $76,000 would receive a credit decreased by $100, or $1,900. Figure 3 illustrates what this phase-out would look like for individuals by age.
Figure 3. Single Filer Tax Credit under AHCA
Comparing the Premium Tax Credits of the AHCA and BCRA
There are various ways to compare these tax credits. The biggest difference between the two credits is that one is directly tied to premiums and the other is not. Because the BCRA credit is regulated by limits on the portion of income that can be used on premiums, the higher benchmark premiums, the greater the tax credit becomes. Conversely, the AHCA’s premium tax credits are set independent of premiums. Under the AHCA, higher or lower premiums have no influence on the size of the tax credit that people can receive.
For consumers below 350 percent FPL, the difference in credit amount varies across groups. BCRA credits will be greater than the AHCA credits for those who are older. A quick glance at Figures 2 and 3 illustrates this point. The most a 64-year-old can receive under the AHCA is $4,000 while the least that same person could receive under the BCRA is over $9,000. However, this does not necessarily hold true for younger adults. Adults under 50 with incomes between 250 percent FPL and 350 percent FPL would receive a smaller credit under the BCRA than the AHCA, given the assumed BCRA benchmark premium above. It is possible that a higher benchmark premium could lead to higher tax credits for this group.
Though neither credit has a clear advantage in generosity for those below 350 percent FPL, it is likely that the size of the BCRA credit would surpass the AHCA credit over time for these incomes. The AHCA tax credit would be set to grow at the consumer price index (CPI) plus 1 percent and the BCRA credit, as mentioned earlier, is determined by a mix of premiums and income percentages. Generally speaking, premium growth in the individual market (about 6 percent annually) is expected to outpace the AHCA credit’s growth of CPI plus one (roughly 3 percent annually).[5],[6]
Figure 4. Number of Individuals Eligible for Tax Credit (BCRA vs AHCA)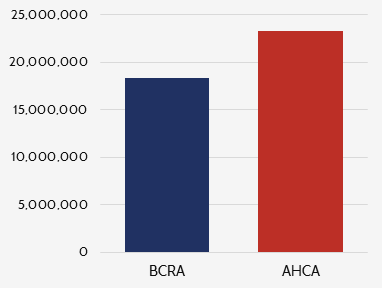
Roughly 5 million more people would be eligible for the AHCA credit than for the BCRA credit. As can be seen in Figure 4, about 23.3 million people are eligible for the AHCA tax credit and 18.8 million are eligible for the BCRA’s. While individuals above 350 percent FPL are ineligible for the tax credit under the BCRA, individuals with incomes of up to $75,000 can receive the full benefit of the tax credit under the AHCA. Even after the AHCA’s phase out, individuals with incomes up to $129,999 (depending on age) can receive a partial credit. Access to the AHCA credit is also increased as it can be used for a wider variety of plans since the AHCA widened the definition of a qualified health plan. Meanwhile, the BCRA confines the use of the credit to the current exchange.
It is unclear which credit would lead to a more stabilized risk pool and lower premiums. There are, however, certain implications that can be drawn from the structure of each credit.
One strength of the AHCA’s credit structure is that because the credit is not affected by premiums, there is more of a burden placed on insurers to offer premiums at affordable prices so that people would purchase insurance. Also, the AHCA’s credit is not only available to more people than the BCRA, it can be used on more plans. The credit can be used on every qualified health plan in the marketplace, while the BCRA’s credit can only be used for on-exchange plans. The increased options for consumers and downward pressure on premiums are positive effects of the AHCA credit structure.
However, the AHCA tax credit does a poor job of reflecting the difference in health care costs by age. The credit varies by age according to a 2:1 ratio while premiums can vary by a ratio of 5:1 or even higher. Also, even though the premium phases out at higher incomes, the tax credit money allocated to those at higher incomes might be more efficiently spent by re-routing that to lower-income consumers.[7]
The strength of the BCRA’s tax credit is that it limits the effects that large premium increases might have on those below 350 percent FPL. By capping the maximum income contribution to a certain percentage of income, the BCRA ensures that a large portion of those eligible to receive credits are able to consistently afford coverage, which aids the stability of the market.
The BCRA credit does sufficiently adjust for age, but at higher incomes it almost over-compensates for age. There is less benefit to the young under the BCRA than in the AHCA, which means that there is less incentive for young people to purchase insurance, and strong enrollment from young adults is necessary for a balanced risk pool. Also, because the tax credits increase as premiums increase, there is less incentive for insurers to offer lower premiums than there would be under the AHCA—whether this would actually lead to increased premiums is difficult to predict.
Conclusion
In summary, there is much to commend in both the BCRA and the AHCA tax credit structures. Of course, there are more provisions to each bill than the tax credit alone, and how those provisions would interact with the tax credit structure is important. Each has strengths and weaknesses; predicting which one would lead to higher enrollment and a more stabilized market is difficult determine at this time.
[1] The discussion draft of the BCRA can be accessed at: https://www.budget.senate.gov/imo/media/doc/SENATEHEALTHCARE.pdf
[2] The text the AHCA as it passed the house is can be accessed at: https://www.congress.gov/115/bills/hr1628/BILLS-115hr1628eh.pdf
[3] https://www.americanactionforum.org/insight/comparing-market-reforms-bcra-ahca/
[4] https://aspe.hhs.gov/system/files/pdf/212721/2017MarketplaceLandscapeBrief.pdf
[5] https://www.cbo.gov/sites/default/files/114th-congress-2015-2016/reports/51130-Health_Insurance_Premiums.pdf
[6] https://www.cbo.gov/sites/default/files/115th-congress-2017-2018/reports/52370-breakout-appendixc.pdf
[7] http://healthandeconomy.org/options-for-further-adjusting-the-ahca-tax-credit-structure-by-income-and-age/