Research
January 8, 2019
2018: The Year in Regulation
INTRODUCTION
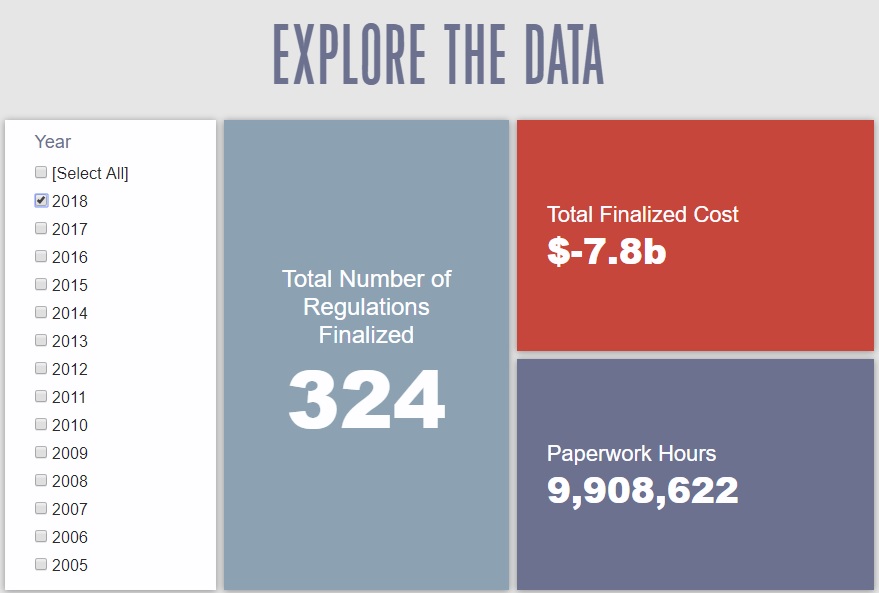
For the first time since the American Action Forum (AAF) began tracking final regulations published in the Federal Register (going back to 2005), federal agencies published net regulatory cost savings for a calendar year. AAF research found that in 2018 federal agencies finalized 324 regulations with estimated costs, savings, or paperwork impacts (the criteria for tracking on RegRodeo.com) resulting in cost savings of $7.8 billion. The agencies added 9.9 million hours of paperwork.
Rulemaking activity increased notably in the second year of the Trump Administration, following the trend of other recent administrations. The reason for this increase is straightforward: In its second year, an administration has more personnel in place and can advance rules begun in year one. The difference for the Trump Administration is that a significant portion of regulatory activity this year was deregulatory.
SNAPSHOT
Other Notable Points:
- Final Annualized Savings: $595 Million
- Total Final Savings Per Person: $23.98
- Total Proposed Savings: $545.7 Billion
- Proposed Paperwork Hours: 16.6 Million
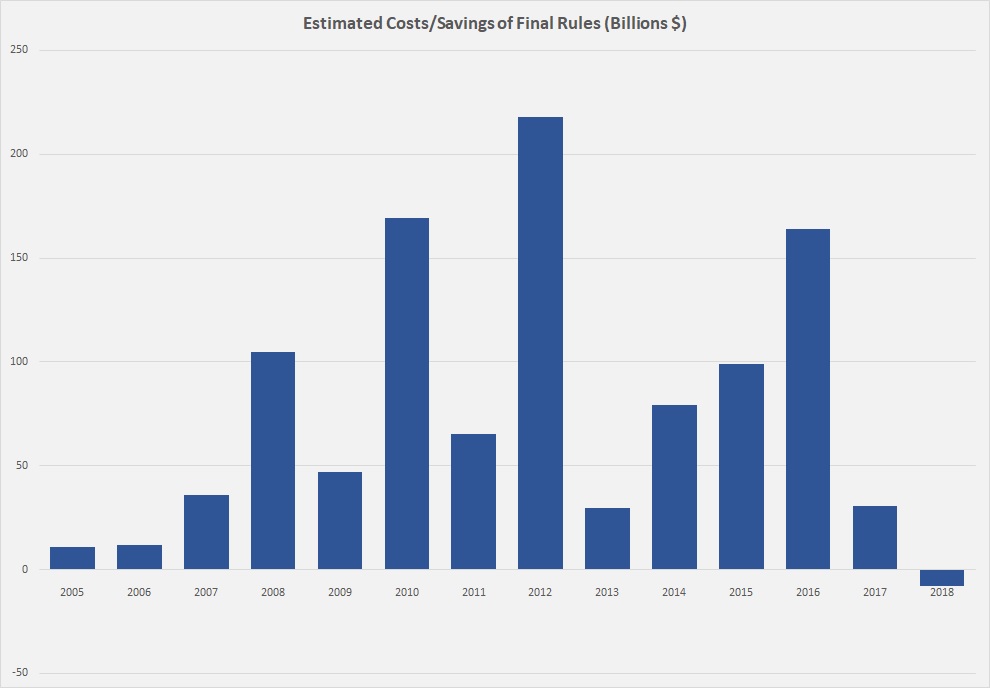
Two major takeaways emerge from the 2018 data. The first is that federal agencies published net regulatory savings for the first time since AAF began tracking. Even when adjusting last year’s total for only those rules issued during the Trump Administration, agencies published $5.8 billion in costs. 2018 represents a major milestone for an administration that has made deregulation a priority. The chart below illustrates the contrast in estimated economic impact between the current administration and previous ones.
The second takeaway is that the rate of final regulatory activity (regulatory or deregulatory actions tracked on RegRodeo.com) increased, as expected, in the second year of the Trump Administration. Removing the Obama Administration rules from the 2017 total, the Trump Administration issued final rules at a rate of .68 per day. In 2018, that rate increased to .89 per day. Further, deregulatory activity increased by a greater proportion than regulatory activity resulting in increased net savings. In 2017, final deregulatory actions made up 12.7 percent of the Trump Administration’s rules. That increased to 29.6 percent in 2018.
COSTLIEST RULES
While it’s clear that the Trump Administration has taken a largely deregulatory posture (both throughout its tenure and in 2018 specifically), there were many actions that increased regulatory burdens. The primary driver of the administration’s regulatory policy, the regulatory budget established under Executive Order 13,771, accounts for such actions. Just as a fiscal budget includes both outlays and revenues, the regulatory budget accounts for costs and savings. The following rules were the costliest from the past year. These 10 rules accounted for $8 billion out of the $8.6 billion in total costs from cost-increasing rules finalized in 2018, 93.1 percent.
-
- National Bioengineered Food Disclosure Standard: $5.6 Billion
- Renewable Fuel Standard Program: Standards for 2019 and Biomass-Based Diesel Volume for 2020: $630 Million
- Public Transportation Agency Safety Plan: $602.5 Million
- Bump-Stock-Type Devices: $312.1 Million
- Human Subject Protection; Acceptance of Data from Clinical Investigations for Medical Devices: $232 Million
- Air Cargo Advance Screening (ACAS): $204.1 Million
- Agricultural Trade Promotion Program: $200 Million
- Revised Critical Infrastructure Protection Reliability Standard … Security Management Controls: $90.6 Million
- Medicare Program; End-Stage Renal Disease Prospective Payment System, Payment for Renal Dialysis Services Furnished to Individuals with Acute Kidney Injury, End-Stage Renal Disease Quality Incentive Program: $77.9 Million
- Modernized Drawback: $58.9 Million
BIGGEST SAVINGS
Despite the rules included in the previous section, 2018 was still a net deregulatory year. The lack of significant regulatory activity certainly contributed, but a notable increase in substantial cost-cutting measures flipped the administration-wide ledger. The following 10 rules are the primary reason for the administration’s net deregulation. They accounted for $12 billion of the $16.4 billion worth of estimated cost savings from deregulatory rules finalized in 2018 (approximately 73 percent).
- Medicare Program; Revisions to Payment Policies Under the Physician Fee Schedule and Other Revisions to Part B for CY 2019: -$2.7 Billion
- Waste Prevention, Production Subject to Royalties, and Resource Conservation; Rescission or Revision of Certain Requirements: -$2.1 Billion
- Medicare Program; Contract Year 2019 Policy and Technical Changes to the Medicare Advantage: -$1.5 Billion
- Hazardous Materials: Response to Petitions from Industry to Modify, Clarify, or Eliminate Regulations: -$1 Billion
- Food Labeling: Revision of the Nutrition and Supplement Facts Labels…Extension of Compliance Dates: -$1 Billion
- Passenger Equipment Safety Standards; Standards for Alternative Compliance and High-Speed Trainsets: -$837.8 Million
- Implementation of the Provision of the Comprehensive Addiction and Recovery Act of 2016: -$808 Million
- Energy Conservation Program: Test Procedures for Integrated Light-Emitting Diode Lamps: -$754.7 Million
- Rescission of Rule Interpreting “Advice” Exemption in Section 203(c) of the Labor-Management Reporting and Disclosure Act: -$652.4 Million
- Coal Combustion Residuals from Electric Utilities; Amendments to the National Minimum Criteria (Phase One, Part One): -$605 Million
Comparing simply the top 10 in costs versus the top 10 in savings illustrates the regulatory trends throughout 2018. Half of the deregulatory list includes overall estimated cost reductions in excess of $1 billion; only one regulatory action exceeds that threshold in terms of new costs. Number 10 on the deregulatory list accounts for greater savings than the costs imposed by number three on the regulatory list. Last year, savings rules covered only 11 percent of the costs imposed by regulatory actions. This year, they match new costs nearly two times over. Furthermore, considering this year’s top 10 deregulatory actions only account for 73 percent of all savings (as opposed to 94 percent in 2017), there is a wider base of such actions than simply those listed above. Out of the 269 final rules that included some quantified cost or savings estimate, approximately 32 percent (87 out of 289) were on the savings side. Last year’s ratio was only 13 percent.
TOP AGENCIES BY REGULATORY AND DEREGULATORY COSTS
On a net basis, the costliest agencies in terms of finalized estimated totals were the Department of Agriculture ($5.3 billion), Department of Homeland Security ($272.9 million), and the Department of Housing and Urban Development ($30.1 million). The Department of Agriculture’s outsized total was driven by its National Bioengineered Food Disclosure Standard, estimated at $5.6 billion in total costs.
On the savings side of the ledger, the Department of Health and Human Services led the way with $6 billion in total estimated savings, largely behind several changes to Medicare and Medicaid regulations that trimmed about 11.9 million hours of paperwork. Following behind were the Department of the Interior ($2.2 billion) and the Department of Transportation ($2 billion).
The table below lists the major executive departments and agencies in order of the most final net savings published.
| Agency | Costs/Savings (Millions $) |
| HHS | -6,001.09 |
| Interior | -2,211.13 |
| Transportation | -2,088.01 |
| Labor | -959.90 |
| Energy | -754.75 |
| EPA | -633.05 |
| Justice | -496.11 |
| Defense | -61.88 |
| Education | -27.38 |
| Treasury | -2.60 |
| Commerce | -0.11 |
| State | 0.00 |
| Veterans Affairs | 1.21 |
| HUD | 30.10 |
| Homeland Security | 272.93 |
| Agriculture | 5,285.00 |
PAPERWORK
This past year was a net deregulatory one in terms of estimated costs, but across all final rules, estimated paperwork burdens increased by nearly 10 million hours. The primary reason for this disparity comes down to a single rule: The Department of Agriculture’s “National Bioengineered Food Disclosure Standard.” As seen above, this rule clocks in at number one in the “Costliest Rules” ranking with roughly $5.6 billion in present value costs. The 20.5 million hours of new paperwork requirements under the rule likely contributed heavily to this price tag. This rule is something of an outlier for the year, however, as the second most burdensome rule brings only 900,855 hours – a difference of roughly 19.6 million hours.
Looking more broadly, the year in paperwork was still rather deregulatory on the whole. If one were to exclude the bioengineered food rule, the various paperwork burden estimates in 2018 amount to approximately 10.6 million fewer hours. The rule that cut the most red tape was a Centers for Medicare & Medicaid Services (CMS) rule that cut more than 5.5 million hours. As AAF has noted before, CMS has been one of the more prodigious agencies in cutting paperwork as a part of otherwise mundane payment schedule rules. In fact, out of the top 10 rules in terms of paperwork cuts, six are CMS payment rules that collectively include nearly 11.6 million hours of paperwork reductions. Such a focus on this aspect of the administrative state likely contributed toward the Department of Health and Human Services (which houses CMS) claiming the title of “Biggest Saver” amongst agencies in fiscal year 2018.
PROPOSED RULES
The highlight of proposed rules in 2018 is that the estimated economic impact of one rule so overwhelms all others that it requires separate consideration in order to get a better picture. The Environmental Protection Agency (EPA) and the DOT jointly issued a proposed rule on vehicle emissions standards called the Safer Affordable Fuel-Efficient (SAFE) Vehicles rule that will bring an estimated $563.3 billion in savings. This proposed rule elevates the estimated net savings of proposed rules in 2018 to $545.4 billion while increasing paperwork by 16.6 million hours. The Office of Information and Regulatory Affairs itself, however, decided to remove this proposed rule from how it is accounting for cost savings in its regulatory budget. 2018 proposed rules have a net total cost of $17.6 billion when the savings of this proposed rule are excluded.
The most expensive proposed rule implements one of the most-significant provisions of 2017’s Tax Cut and Jobs Act, the Qualified Business Income Deduction. The Internal Revenue Service’s proposed rule would increase paperwork by an estimated 25 million hours and impose about $13.2 billion in total costs. Other notable proposed rules with net costs include the Securities and Exchange Commission’s Best Interest Regulation ($6.1 billion) and the EPA’s proposed 2019 Renewable Fuel Standard ($740 million).
There were notable deregulatory measures as well, highlighted by EPA’s proposal to replace the Obama Administration’s Clean Power Plan. Known as the Affordable Clean Energy rule, the proposal estimates total savings of $6.4 billion, making it the proposal with the most net savings (aside from the SAFE rule). The next two proposals with the most net savings are also in the energy space: an EPA revision of an Obama-era coal combustion residuals rule ($2.1 billion) and a Department of the Interior revision of an Obama-era rule on oil and natural gas production from federal land ($2 billion).
CONCLUSION
The Trump Administration ramped up deregulatory activity in 2018, resulting in government-wide net regulatory savings for the first time since AAF began tracking. It achieved this by more than doubling its final deregulatory action rate. It will have to continue this trend if it hopes to achieve the projected net savings target of $17.9 billion identified in its fiscal year 2019 regulatory budget.