Research
November 21, 2019
2020 ACA Marketplace Premiums
Executive Summary
This study analyzes the 2020 premium changes for health insurance plans offered through the Affordable Care Act’s (ACA) health insurance exchange. Specifically, it compares the 2020 premiums to the 2019 premiums by analyzing the cost changes in three different plan types by rating area: benchmark Silver, lowest-cost Bronze, and lowest-cost Gold. It finds the following:
- Benchmark plans from 2019 that are still offered in 2020, even if not as the benchmark, rose by less than 1 percent—the lowest average increase since the ACA marketplaces began operating;
- 25 percent of all rating areas have the same benchmark plan as 2019;
- The average 2020 benchmark plan premium is 3 percent lower than the average 2019 benchmark plan; and
- The lowest-cost Bronze premium decreased by an average of 3 percent, and the lowest-cost Gold premium increased on average by about 9 percent.
Introduction
Now in their seventh year, the Affordable Care Act’s (ACA) individual market health insurance exchange appears to be experiencing some semblance of stability. In previous years, insurers found it difficult to set premiums because of several issues: uncertainty of the overall health and size of the enrollment pool, a shifting regulatory burden, and the disappearance of promised reimbursement to insurers in the form of cost-sharing reduction (CSR) payments. Coming into 2020, however, the exchange is entering its second straight year of only marginal premium fluctuation, indicating a less volatile marketplace.
This study evaluates 2020 premiums by comparing them with 2019 premiums. It finds that the cost of 2019 benchmark plans that are still sold on the exchange have increased in 2020 by less than 1 percent for a 27-year-old non-smoker. Overall, the average 2020 benchmark plan premium is 3 percent lower than the 2019 benchmark plan premium. The average lowest-cost Bronze plan premium is 3 percent lower. And finally, the average premium for the lowest-cost Gold plan increased by about 9 percent.
2020 Benchmark Premiums
For the second straight year, the national average premium increase on the exchange did not surpass inflation.[1] As mentioned above, it is likely that the lack of premium changes for 2020 is a result of the second straight year of relative stability in the marketplace. In previous years, insurers struggled to predict risk pools as original enrollment projections were off, and young, healthy individuals failed to enroll at the expected levels. Furthermore, a changing regulatory burden and uncertainty regarding federal insurance policy culminated in the loss of CSR payments in 2017. Recently, many of these problems have disappeared, particularly as effectuated enrollment on the exchange has hovered around 10 million for the last few years. Furthermore, the biggest policy changes of the last two years—the zeroing out of the individual mandate penalty and the introduction of Short-Term Limited Duration Insurance (STLDI)—seem to have had little effect on the overall makeup of the risk pool.
One way to estimate premium growth is to compare benchmark premiums from year to year. The second-lowest cost Silver plan is referred to as the benchmark plan, and federal subsidies are calculated based on this plan. In the discussion of health insurance costs, the benchmark plan is frequently the focus because of its implications for enrollment numbers and the large portion of the exchange population that enrolls in it—roughly 11 percent of the exchange population enrolled in this plan in 2015, the most recent year this data was made available.[2] Benchmark premiums also have implications for federal spending. As benchmark premiums increase, so do the tax credits provided for those eligible. Therefore, as the benchmark premiums increase, so does federal spending. When 2020 benchmarks are compared with 2019 benchmarks, 2020 benchmark premiums are 3 percent lower on average—down from a 1 percent increase in 2019.
As Figure 1 demonstrates, however, one number cannot accurately summarize the differences in benchmark premiums on a national level.
Figure 1. Comparison of 2020 and 2019 Benchmark Premium by Rating Area
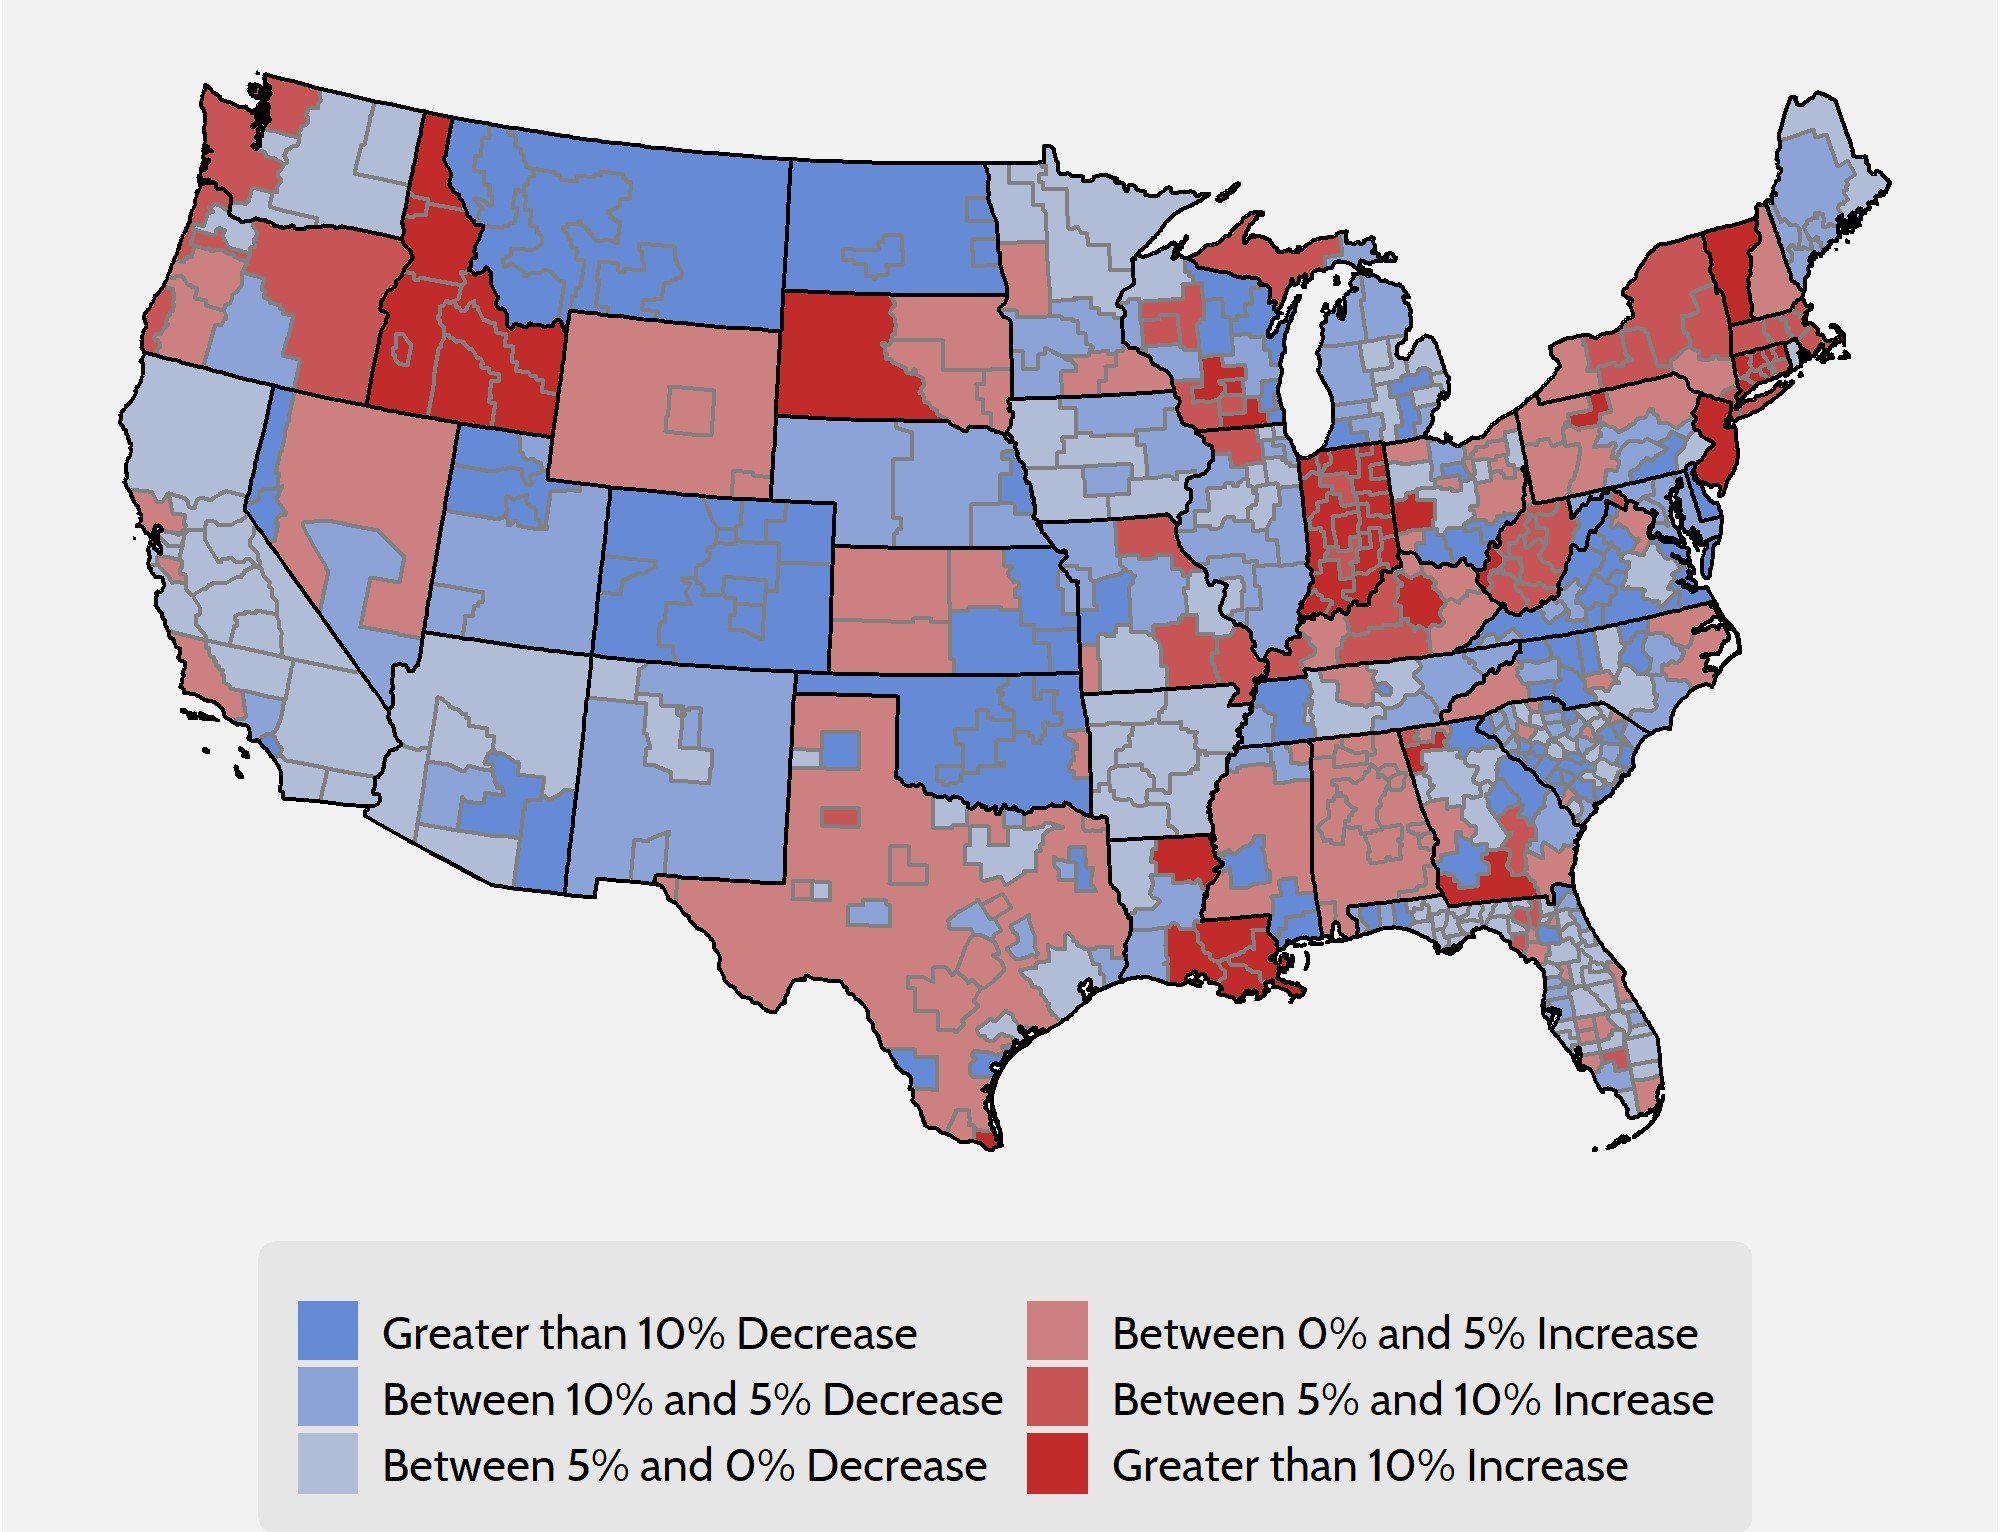
Despite the encouraging national outlook, averages mask a lot of variation, and it is therefore necessary to look at the national insurance marketplace at a more granular level to analyze premium changes accurately.
Premium changes vary across the country. Arizona, Montana, and Colorado will all see statewide premium decreases, while in New York, Idaho, and Indiana premiums will increase. Premiums can also vary widely within states. For instance, certain areas in Louisiana will see a 15 percent increase in premiums while others will see a moderate decrease. Changes in benchmark premiums for 2020 range from a 40 percent decrease in one rating area in Georgia to a 74 percent increase in a rating area in Idaho. Yet even accounting for these figures, the national benchmark premium average decreased by 3 percent.
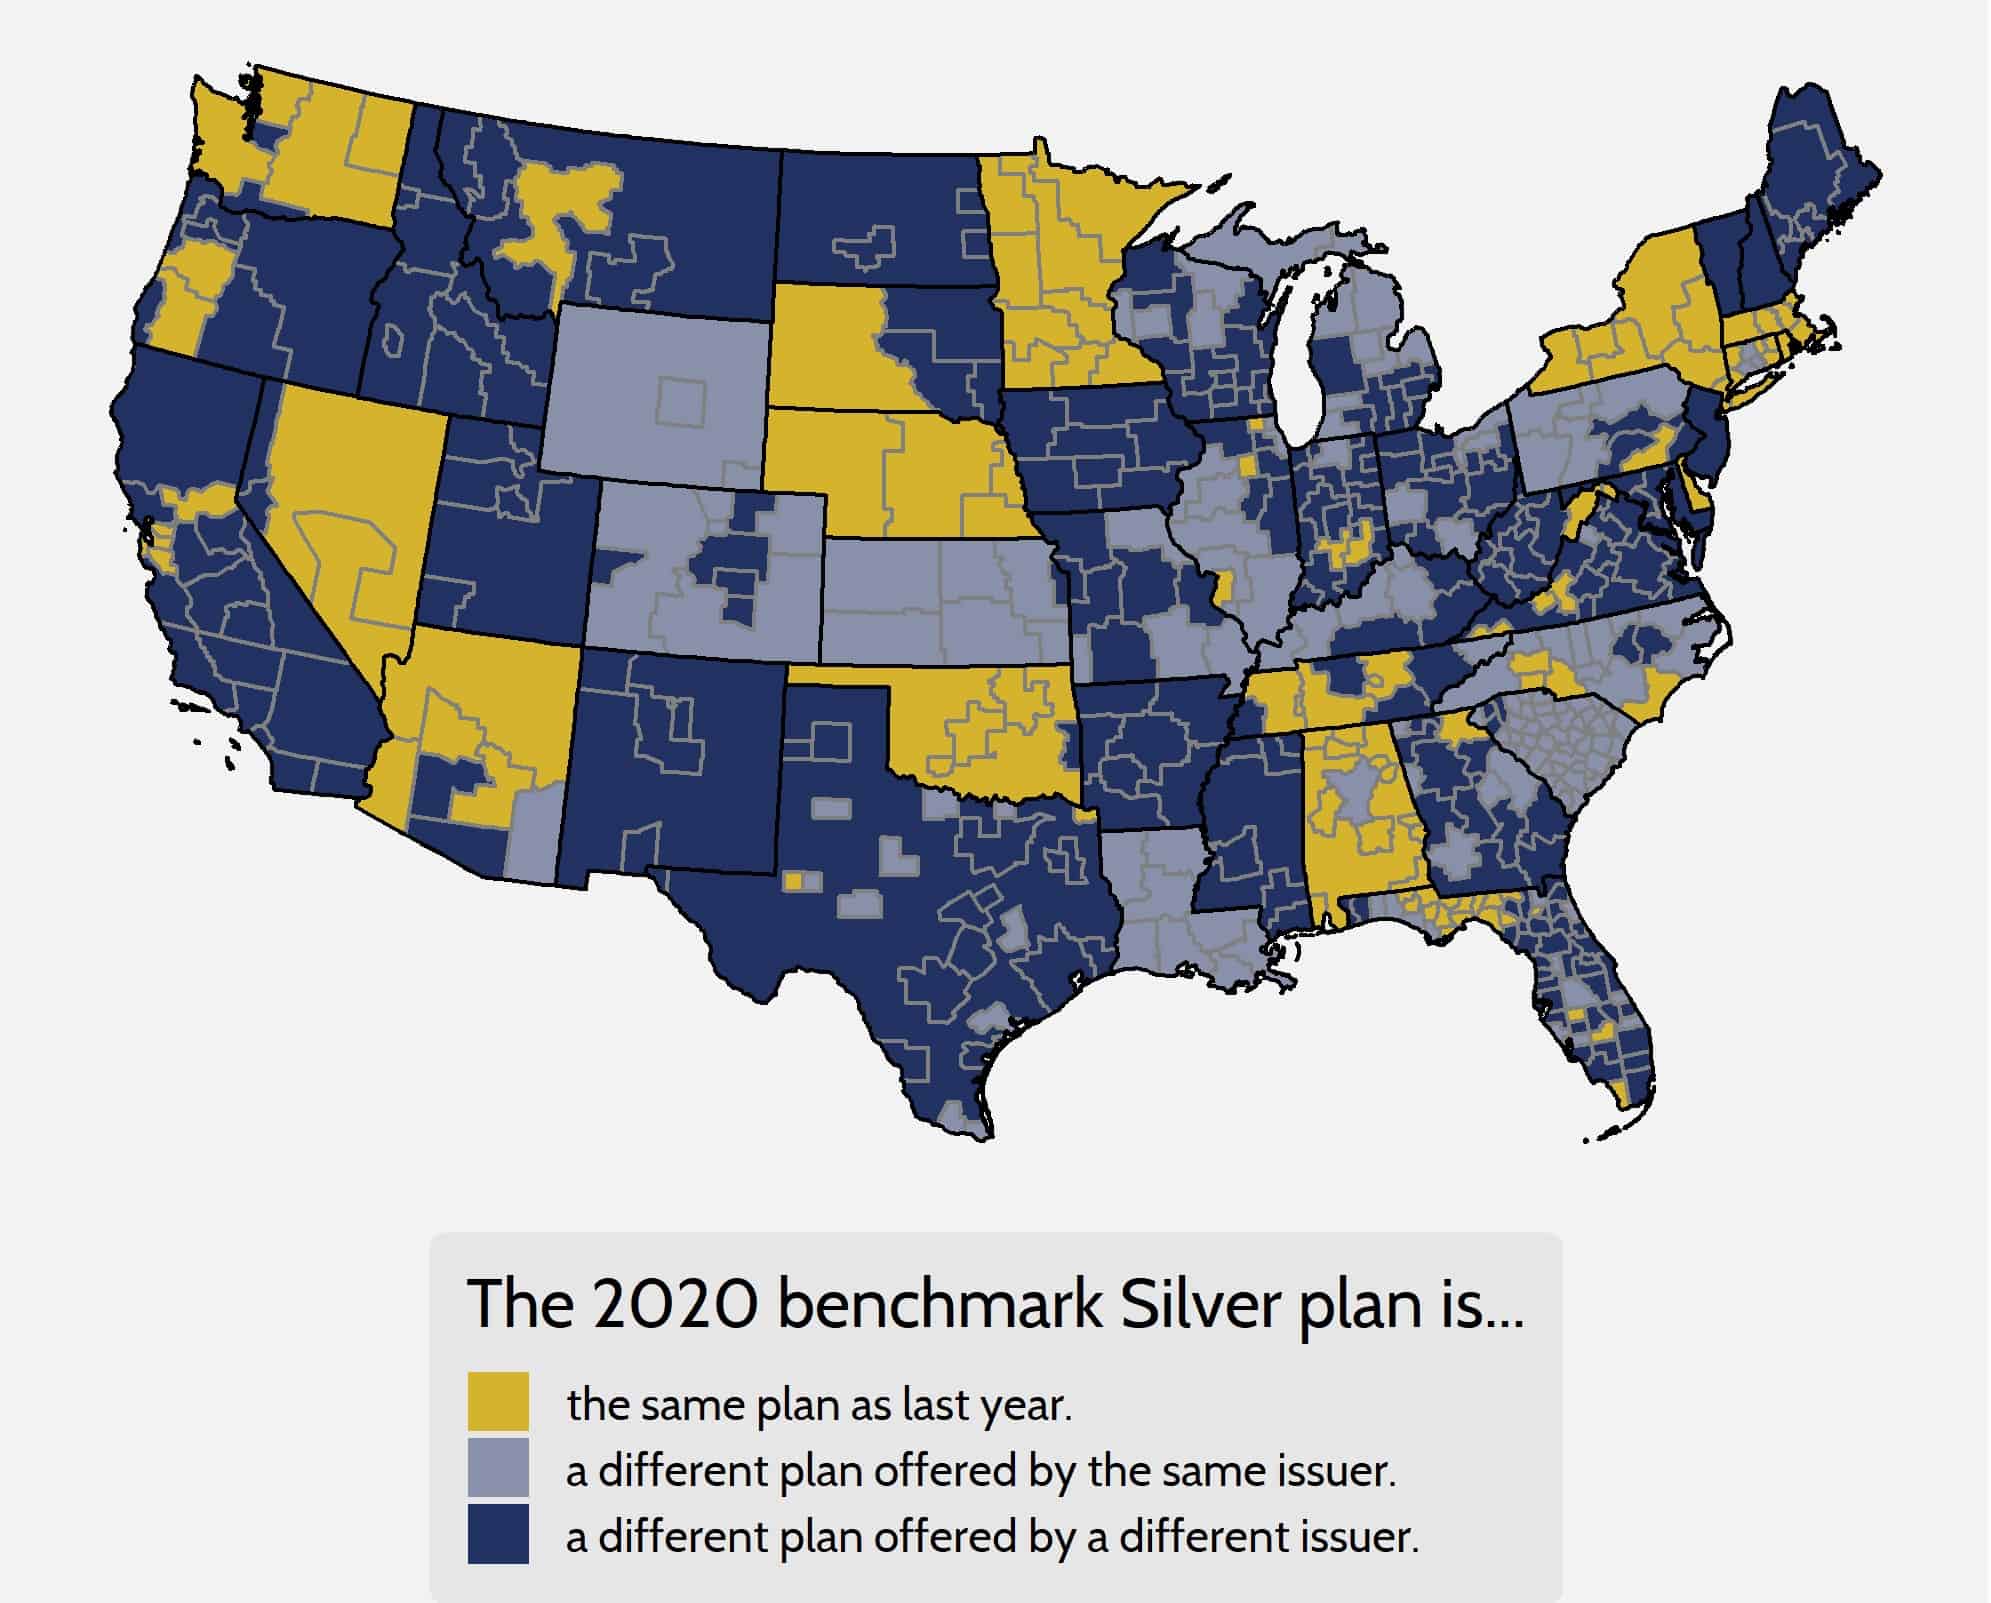
Despite the increase in overall stability, most rating areas still experience churn in the benchmark plan from year to year. In other words, two different plans are being compared instead of the premium growth for a single, unique bundle of benefits. Considered in one sense, benchmark plan churn can be seen as a positive because it shows that competition is taking place in those areas, placing downward pressure on premiums. On a less positive note, however, a new benchmark plan in a rating area creates less continuity for the consumer. A new plan, though it may have the same actuarial value, will mean a different consumer experience and may even result in the need to change doctors as plan networks change.
As shown in Figure 2 below, in 2020 only 25 percent of rating areas feature the same benchmark plan as the 2019 plan year, though 88 percent of 2019 benchmarks are still offered on the exchange this year. The premiums for 2019 benchmark plans that are still offered on exchange in 2020, even if not as the benchmark for the new year, have increased by less than 1 percent, on average.
Figure 2. Benchmark Churn from 2019 to 2020
Looking at Gold and Bronze Premiums
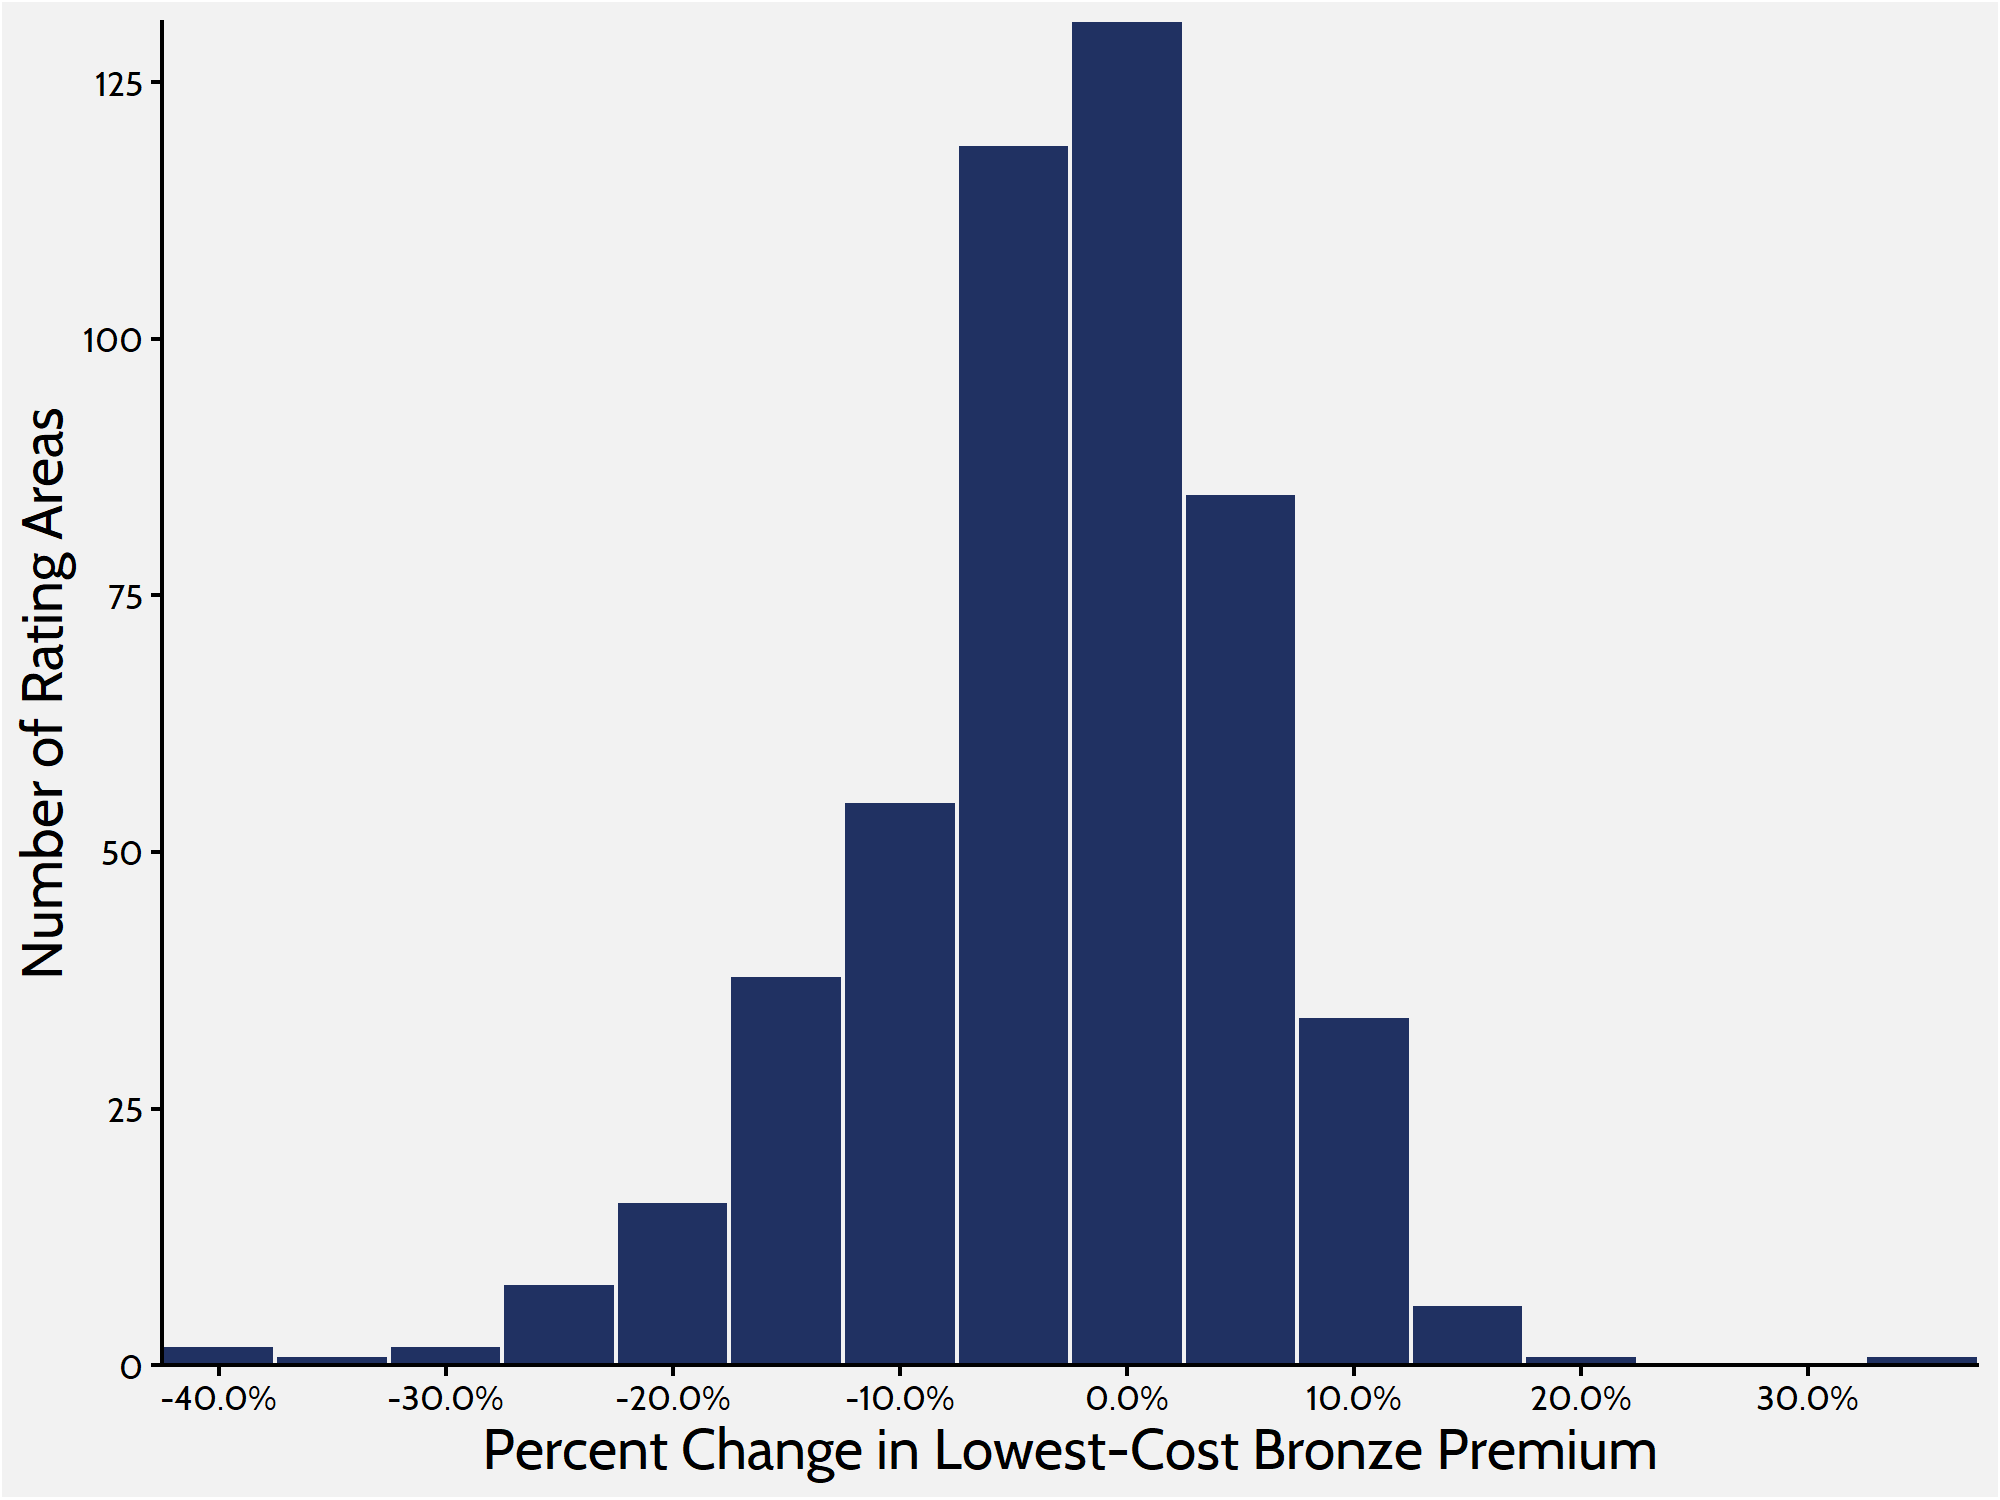
Analyzing Bronze and Gold plans provides a more complete picture of what is happening on the exchange. Silver plans enrolled roughly 59 percent of the marketplace in 2019, while Bronze plans—the cheapest metal level on the market—enrolled about 31 percent.[3] Looking at the lowest-cost Bronze plan in each rating area provides a more comprehensive understanding of how premium changes are affecting people throughout the market, because lower-cost plans are more likely to attract those ineligible for subsidies and cost sharing. When weighted by population, premiums for the lowest-cost Bronze plan have kept in lockstep with benchmark Silver plans, decreasing by 3 percent between 2019 and 2020.
Figure 3. Lowest-Cost Bronze Premium Increases
Gold premiums, on the other hand, increased. The average lowest-cost Gold plan in each rating area is set to increase by an average of 9 percent for plan year 2020. Historically, a much smaller share of consumers enrolls in Gold plans than in Silver or Bronze plans. Roughly 8 percent of exchange consumers enrolled in a Gold plan in 2019, up from 7 percent in 2018.
Table 1. Premium Increase Quartiles by Metal Level
| Metal Level |
Minimum |
25th Percentile | 50th Percentile | 75th Percentile |
Maximum |
| Lowest Bronze |
-40% |
-7% | -2% | 3% |
33% |
| Benchmark Silver |
-40% |
-8% | -3% | 3% |
74% |
| Lowest Gold |
-30% |
-0.1% | 7% | 17% |
66% |
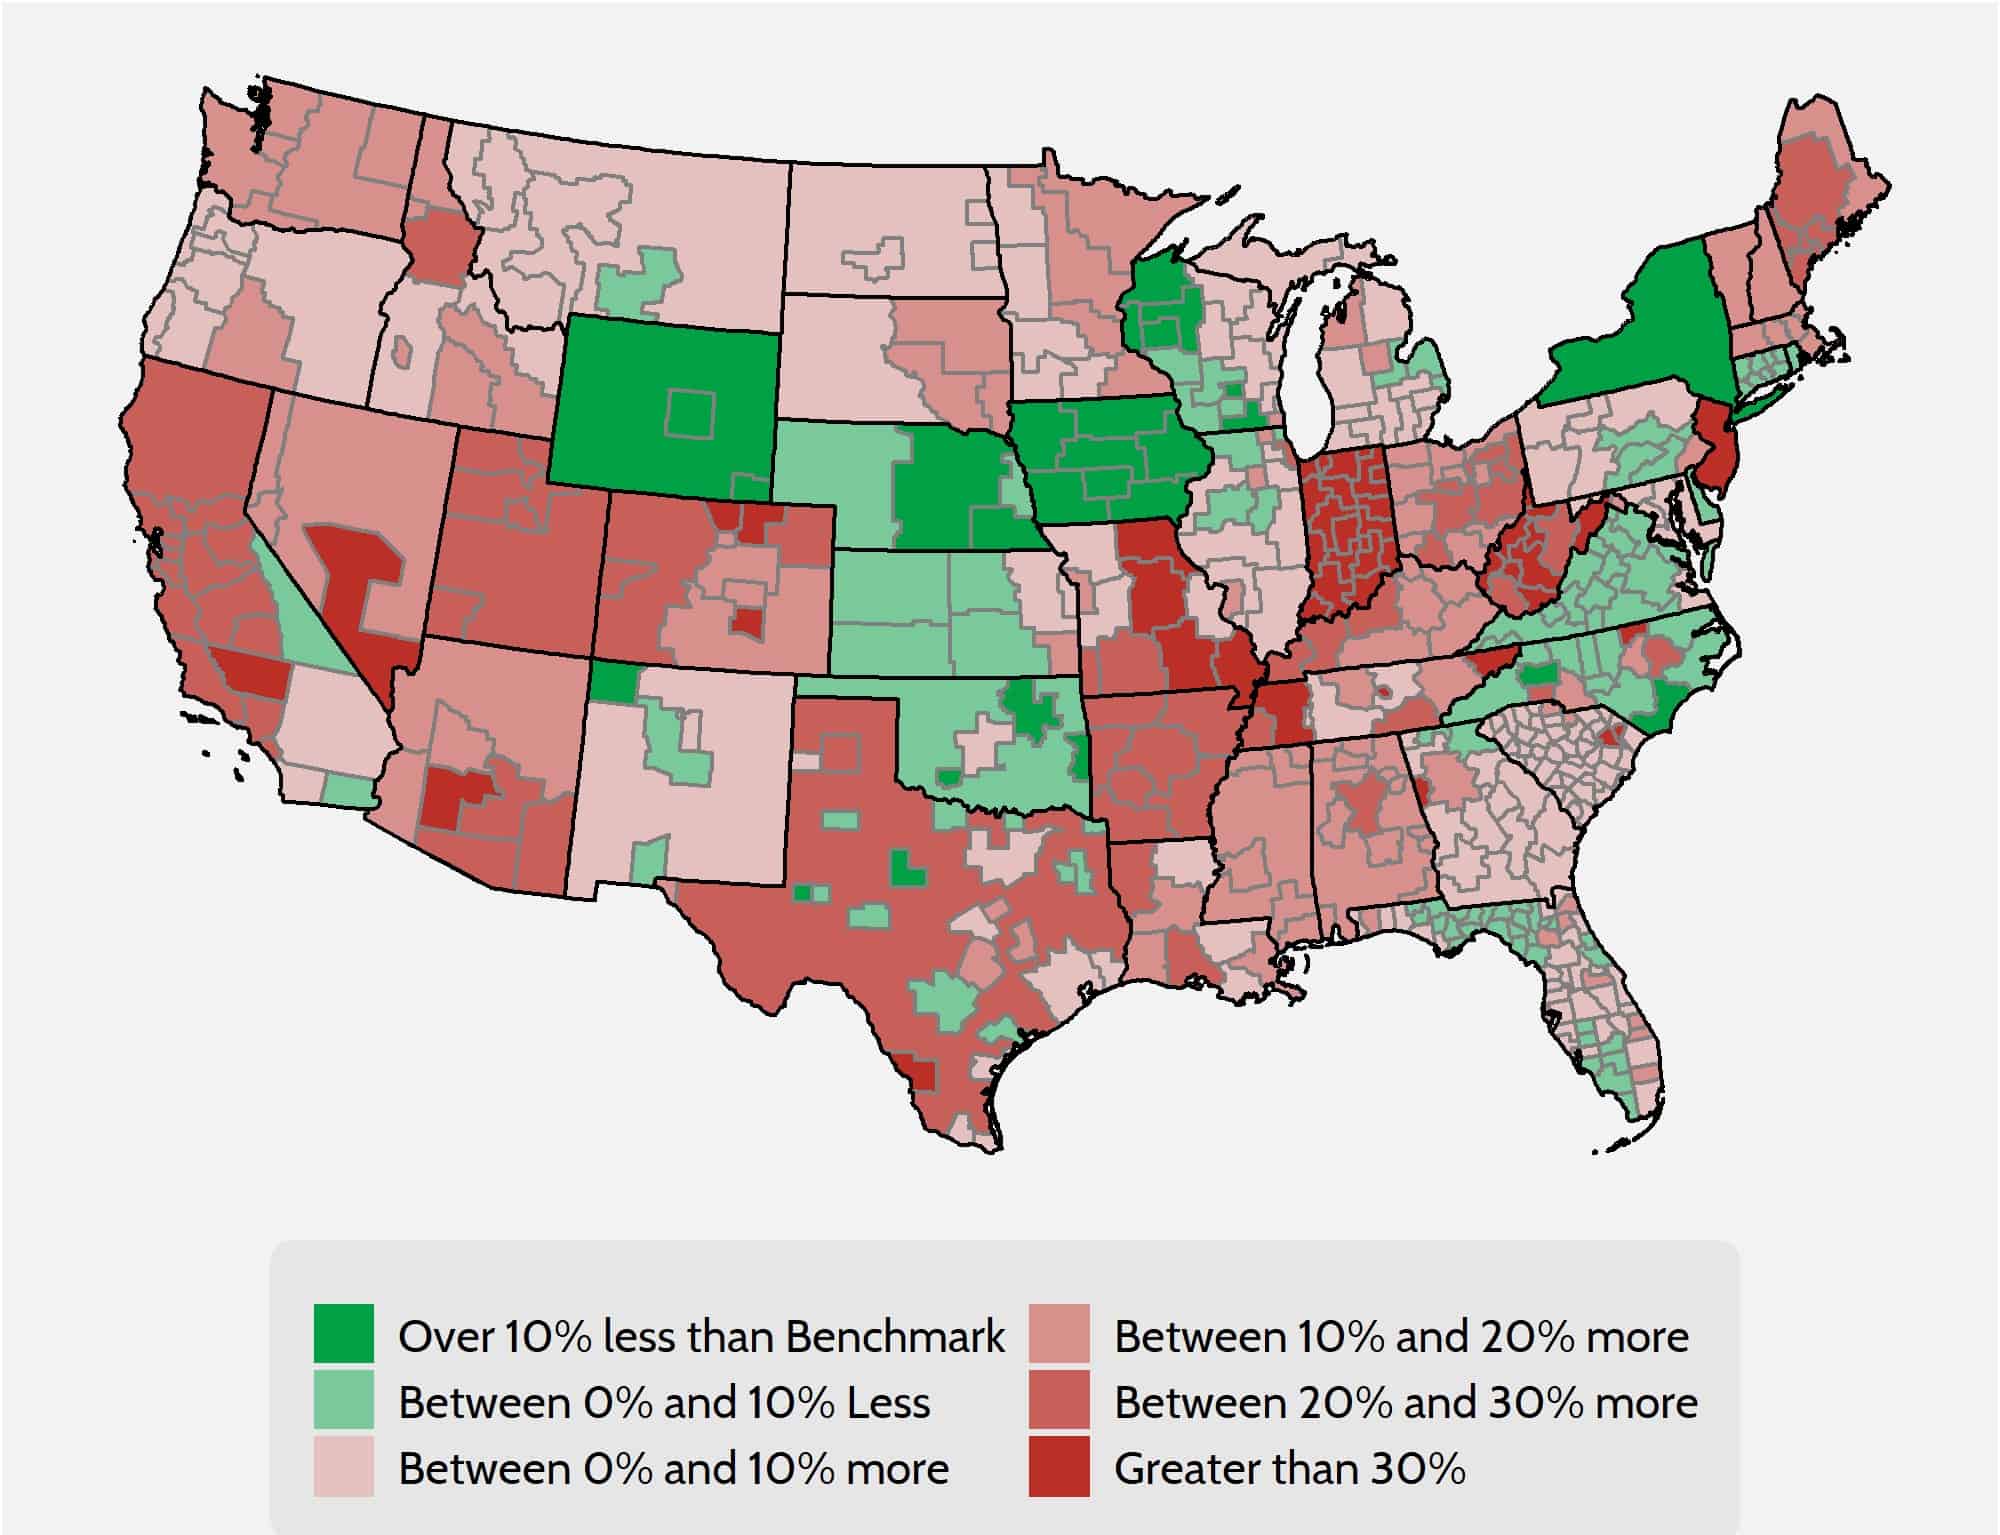
Gold plans continue to be of interest in this analysis because of the “Silver Loading” that continues to take place on the exchange. Insurers increased premiums substantially in 2018 in response to the discontinuation of CSR payments in 2017. In order to shield consumers ineligible for subsidies, many insurers loaded the bulk of their premium increases onto Silver plan premiums. Doing so keeps prices lower for Bronze and Gold plans, giving those without subsidies better options. As a result of this “Silver Loading,” there are many areas where Gold plans are cheaper than the benchmark plan. Of the 503 rating areas, 125 rating areas feature at least one Gold plan that costs less than the benchmark Silver plan.
Under current law, households between 300 and 400 percent of the Federal Poverty Level are entitled to subsidies if the benchmark premium is more than roughly 9 percent of their annual income. Because of the spike in benchmark premiums, many people in this income range may consider enrolling in Gold plans because of those plans’ smaller cost sharing—in other words, these consumers can buy higher-quality products at a cheaper price.
Figure 4. Lowest Gold Premiums Compared with Benchmarks
Insurer Competition
The most encouraging development in the individual marketplace exchange over the last two years has been the increase in competition. Other federal health care programs designed around subsidized private insurance—such as Medicare Advantage and Medicare Part D—demonstrate that competition among insurance companies is an important means of controlling prices. In the ACA exchange’s first year of open enrollment, research showed that a lack of competition was correlated with higher premiums and $1.7 billion in higher subsidy spending.[4] For the 2019 plan year, 100 rating areas saw at least one new firm enter the marketplace. This trend has continued for the 2020 plan year, as 154 rating areas will see the entrance of at least one more firm. Furthermore, the number of rating areas with more than one firm in 2020 is increasing by 61 to 418.
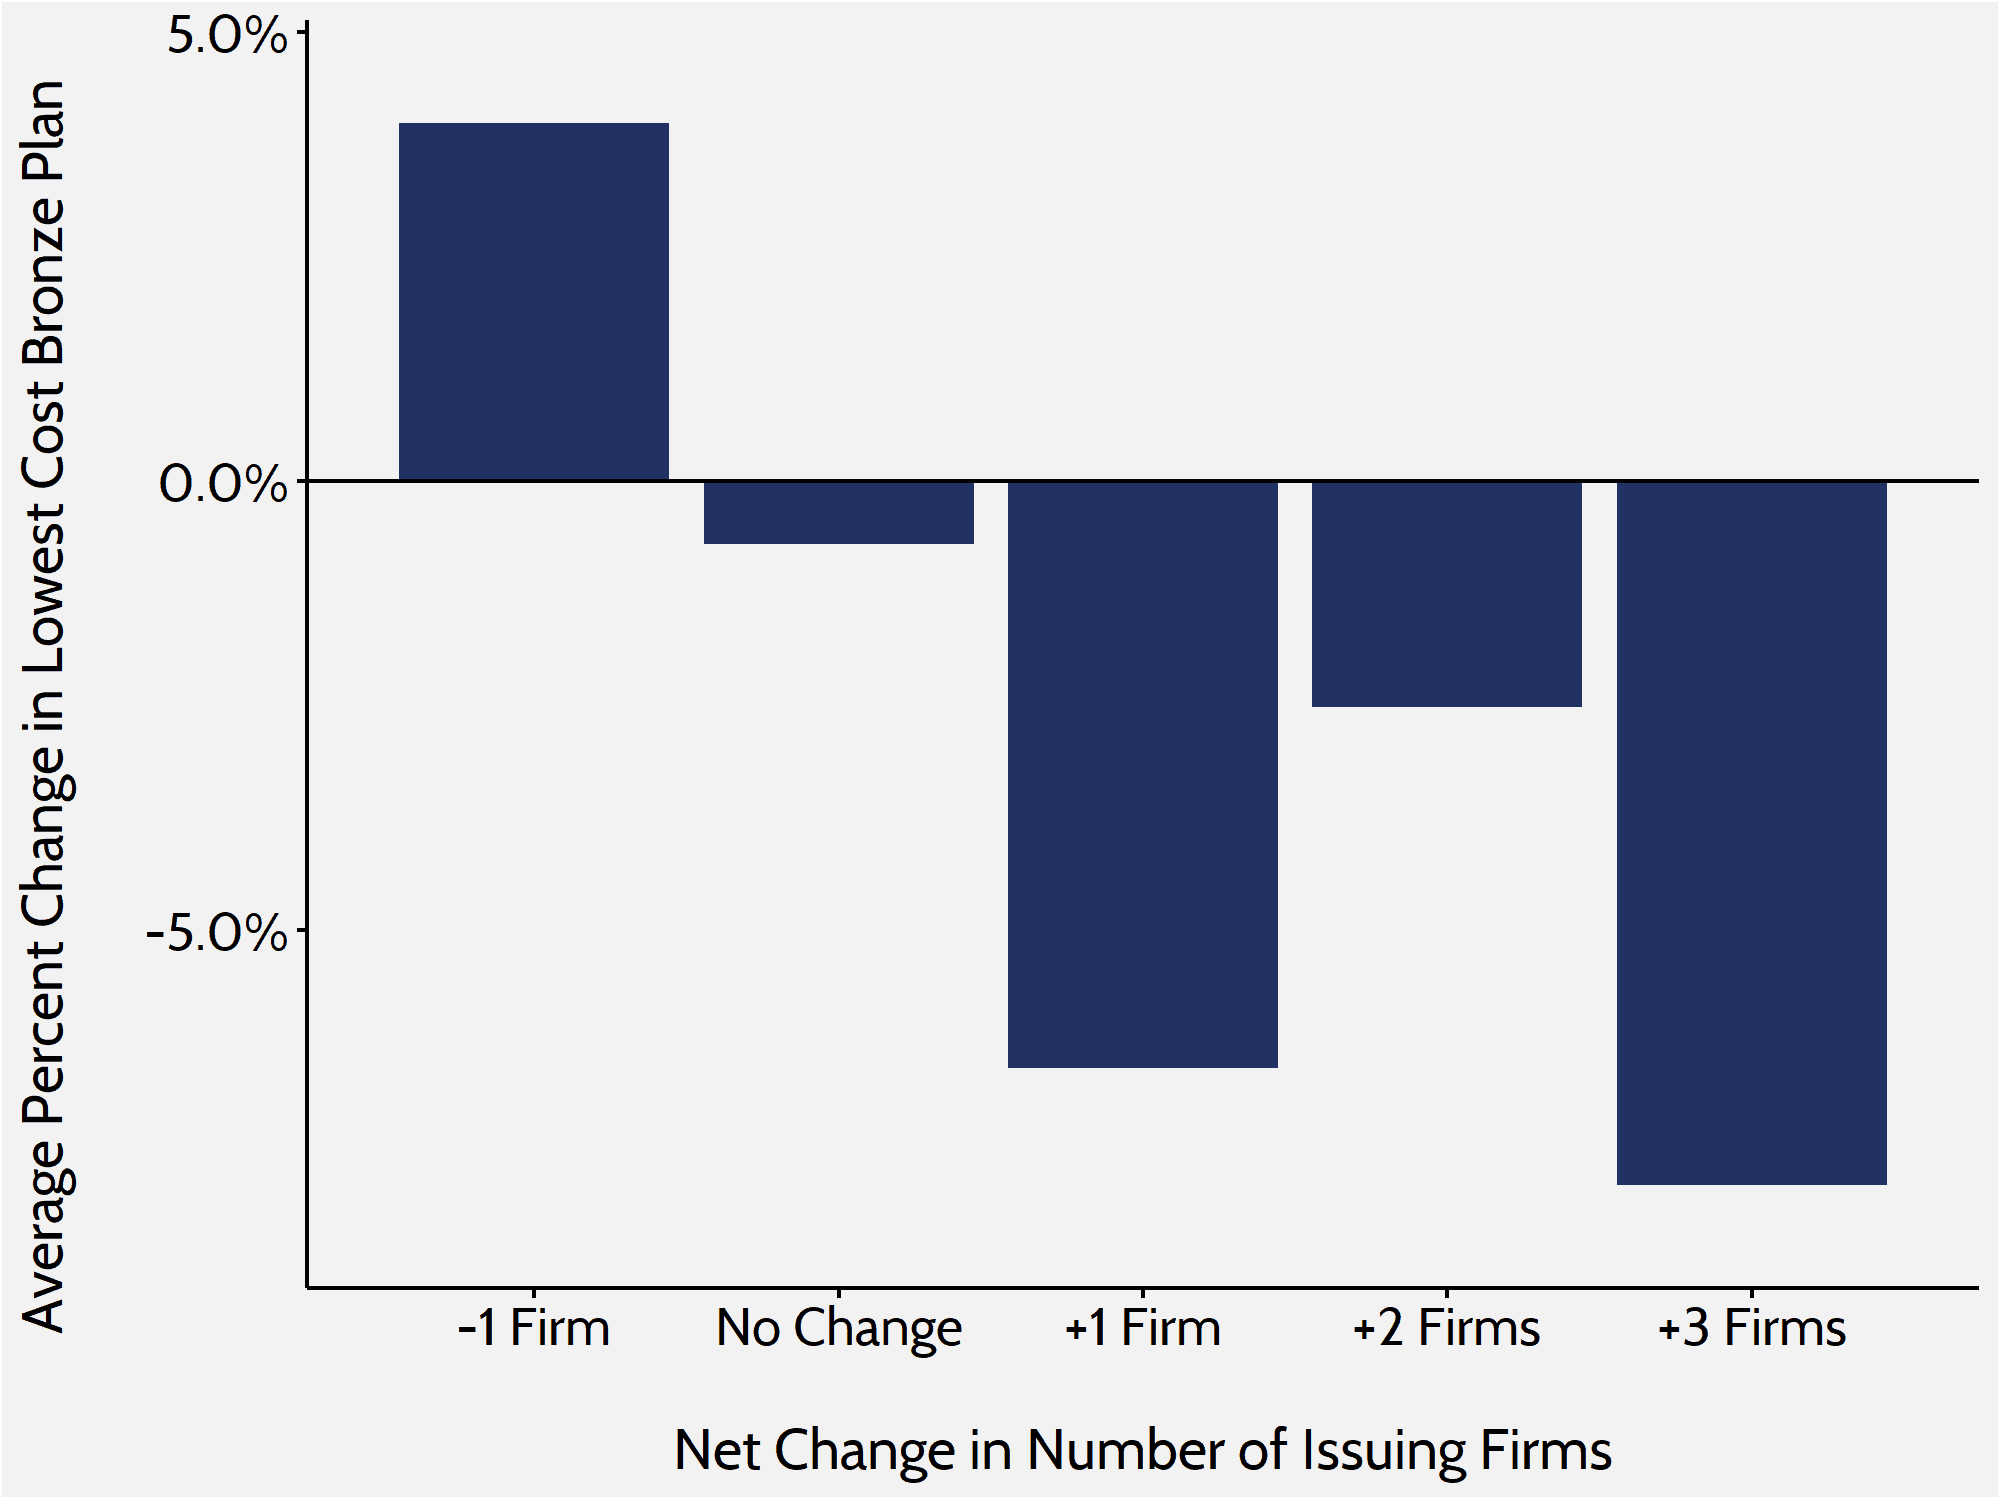
In previous research, the American Action Forum found that increased competition in the marketplace led to smaller increases in premiums. During the last two years, the exchange has seen even more encouraging results: Increased competition has led to a decrease in premiums on average. In rating areas where competition increased, the average lowest-cost Bronze premium decreased by roughly 6 percent. In areas where competition stayed the same, premiums decreased by about 1 percent. Where competition decreased, premiums increased by 4 percent.
Figure 5. Bronze Premium Changes and Issuer Fluctuation
Data and Methodology
The primary sources of data for this report are the 2019 and 2020 individual market medical landscape files that are available through the Centers for Medicare and Medicaid Services (CMS).[5] These landscape files contain data on the health insurance plans that were or are offered through the federally facilitated or federal-state partnership exchanges.
Health insurance costs vary between regions even within states. To adjust for these variances, the states are divided into geographic rating areas that all insurers must use as a part of their rate-setting process. This study examines premium changes at the level of rating area, to give greater granularity and precision to the analysis.
The Robert Wood Johnson Foundation (RWJF) also offers exchange data for all states from 2014 through 2020.[6] The RWJF data supplement the CMS data on federal exchanges with data on state exchanges. To fill any gaps in the RWJF data, this study uses plan-comparison tools on state-based exchanges where they are available. Overall, the study analyzes data on 2019 and 2020 Bronze, Silver, and Gold plans for all 50 states and the District of Columbia, accounting for all rating areas nationwide. The estimates for the number of health insurance issuers in each rating area are based on Silver plan data.
When computing average price changes across rating areas, this study uses the potentially eligible population in each rating area to calculate a weighted average of the change in each area. The potentially eligible population is defined as the number of individuals who are either uninsured or insured through the individual market, ineligible for Medicaid or the Children’s Health Insurance Program, and determined to be a legal resident. This study estimates this population using the 2011-2013 American Community Survey.[7] All the premium estimates in this report are based on those offered to a 27-year-old non-smoker. Unless otherwise noted, the premium changes do not include any subsidies that are available to middle- to low-income households.
The ACA’s structure eliminates the need, for the purposes of this study, to calculate premium changes for different age groups. The ACA employs an age-based community rating, which limits insurers to charging older, higher-risk enrollees no more than three times as much as younger, lower-risk enrollees. Because of this restriction, age-based rates between 21 and 64 are typically a multiple of the base rate by a factor between one and three. Therefore, there is no real need to consider different ages when determining premium growth as a percentage, because each age is going to see proportional growth. For example, if a 21-year-old’s premium increases by 25 percent, then a 55-year-old’s premium will increase by 25 percent as well, even though the 55-year-old is being charged more. Under current law, states may adopt a more restrictive age-based community rating than the federally mandated 3:1, which would change the ratio insurers use to calculate rates. The three states that do this for the individual marketplace are New York (1:1), Vermont (1:1), and Massachusetts (2:1).[8]
Conclusion
Though premiums vary widely from state to state, 2020 is the first year that average benchmark premiums within the ACA exchange has decreased. Plan year 2020 will also see the lowest premium increases for the previous year’s benchmark plans that are still offered on the exchange.
Ever since the implementation of the ACA, the individual market, and particularly the ACA exchange, has been volatile and difficult to predict. The plan years from 2014 to 2016 saw fairly high premium increases, as insurers adjusted to the new regulatory structure and a less-balanced risk pool than predicted. Plan years 2017 and 2018 saw massive premium increases—even though the risk pool had stabilized—as regulatory uncertainty tied to a new administration ruled the day. But, for plan years 2019 and 2020, the exchange risk pool remained constant and regulatory change was minimal.
What can be learned? First, the zeroing out of the individual mandate has had a negligible effect on the overall make-up of the risk pool. Second, the introduction of STLDI plans has had little effect on the overall balance of the risk pool. These two changes to the ACA’s health insurance exchange represent the most significant that were made, which lead to the third lesson learned: The market appears to have stabilized, as indicated by premiums increasing modestly and even decreasing over the last couple of years.
Though there are still many problems with the ACA that need to be resolved, the repeal of the mandate and the introduction of STLDIs demonstrate that the individual market can be reformed without shocking the entire system. These two paths perhaps indicate a path forward for further reform.
[1] https://www.cms.gov/research-statistics-data-and-systems/statistics-trends-and-reports/nationalhealthexpenddata/nhe-fact-sheet.html
[2] https://www.cms.gov/Newsroom/MediaReleaseDatabase/Fact-sheets/2015-Fact-sheets-items/2015-10-26-2.html
[3] Marketplace Selections by Metal Level. Kaiser Family Foundation (KFF), 2019. Accessed at: https://www.kff.org/health-reform/state-indicator/marketplace-plan-selections-by-metal-level-2/?dataView=1¤tTimeframe=0&sortModel=%7B%22colId%22:%22Location%22,%22sort%22:%22asc%22%7D
[4] Gruber J, Dafny L, and Ody C, “More Insurers Lower Premiums: Evidence from Initial Pricing in the Health Insurance Marketplaces,” NBER Working Paper No. 20140, May 2014, available at: http://www.nber.org/papers/w20140
[5] Individual market medical landscape files are available for download at data.healthcare.gov
[6] Robert Wood Johnson Foundation, available at: https://hixcompare.org/. Data accessed on 11/5/2018
[7] https://www.census.gov/programs-surveys/acs/
[8] Market Rating Reforms. Centers for Medicare and Medicaid Services (CMS), Department of Health and Human Services (HHS), March 15, 2017. Accessed at: https://www.cms.gov/CCIIO/Programs-and-Initiatives/Health-Insurance-Market-Reforms/state-rating.html