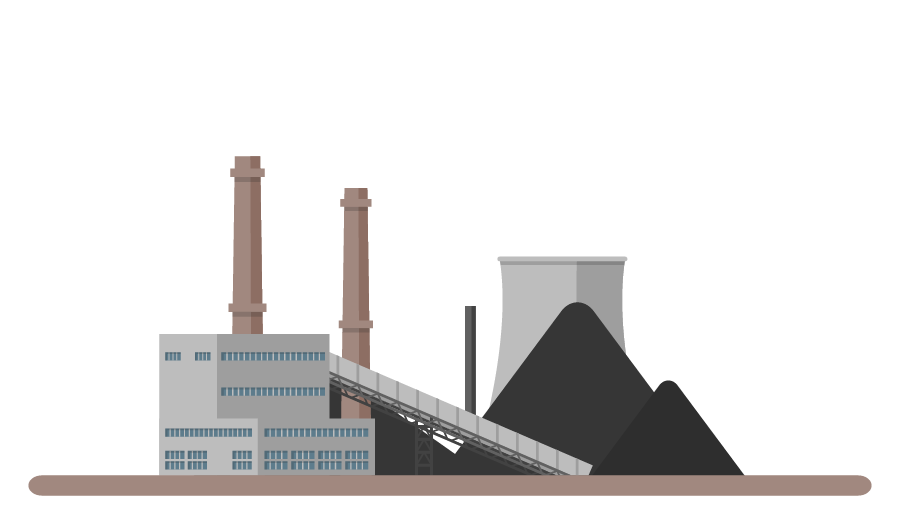
Power Plants
Greenhouse gas emissions combusting coal, natural gas, or waste for electricity generation is included. This also includes emissions from producing electricity for homes, buildings, and factories.
Industrial
Greenhouse gas emissions from manufacturing, metals production, cement production, and other industrial processes. This excludes emissions from electricity generation, which comes from power plants.
Residential
The greenhouse gas emissions from fuel use for kitchen stoves and home heating are included. Emissions from electricity generation are under the power plants section.
Commercial
Like residential homes, commercial buildings for offices and businesses need gas to heat them, and keep stoves in restaurants going. Those greenhouse gas emissions are included.
Transportation
Greenhouse gas emissions from combustion engine vehicles (biofuels are excluded). This is the gasoline you put in your car, compressed natural gas for city buses, and the jet fuel for powering flight.
Coal Mining
Coal deposits have trapped greenhouse gases, which are released in the process of mining. These are the greenhouse gas emissions from both active mines and abandoned ones.
Agriculture
Lots of agricultural activities create greenhouse gas emissions. Livestock, manure piles, fertilizer, and tilling soil are all included in this category.
Chemicals
Chemical production is one of the most greenhouse gas intensive industries. The emissions from industrial production and use of chemicals are included.
Waste Management
Garbage from homes and businesses that end up in landfills break down and emit greenhouse gases. Those emissions, along with emissions from composting and treatment of sewage, are included.
Miscellaneous
This includes everything not covered in the above categories. These are emissions from U.S. territories, natural gas production, oil refineries, non-energy use of fossil fuels, and others.


