Research
May 8, 2019
Comparing the Benefits and Costs of Notable Climate Policies
Summary
- Advocates of dramatic climate policy often presume that the urgency and scope of the problem by default means that no policy proposal is too costly or too radical.
- An “at any cost” approach to policy can lead to outcomes that have higher costs than benefits, inflicting more harm than help, and this is true even for exigent collective action problems.
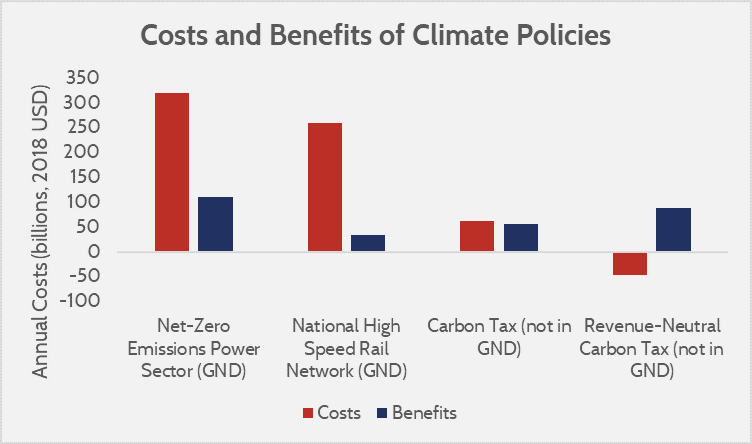
- Analyzing the costs and benefits of electricity and transportation policies in the Green New Deal using the Social Cost of Carbon shows the costs are several times larger than the capturable benefits—but policies not in the Green New Deal, like a revenue-neutral carbon tax, are more likely to produce more benefits than costs.
Introduction
A common contention among advocates of the Green New Deal (GND) is that climate change represents an existential crisis, and the costs of inaction therefore justify extraordinary federal action regardless of the associated costs. This argument, however, is fundamentally flawed given that policymaking requires the strategic application of resources to maximize benefits despite limited resources.
The challenge of scarcity is not new. In fact, the Obama Administration commissioned an Interagency Working Group (IWG) specifically to develop the “Social Cost of Carbon” (SCC). The SCC allows policymakers to appreciate the tradeoffs associated with potential climate policies and provide a way to assign a dollar figure to the actual climate benefits of reducing carbon emissions for the sake of cost-benefit analysis. Using the SCC, it is possible to examine policies and infer which are cost-effective, and which are not.
This study takes the benefits of reducing carbon emissions—the SCC, as calculated using the methodology of the Obama Administration’s Environmental Protection Agency (EPA)—and applies those benefit values to the potential costs of some of the better defined climate proposals in the GND resolution that the Senate debated in March 2019. This study also applies the same metric of benefits to the more moderate proposal of a carbon tax. The comparison shows that the GND takes a far less efficient approach to mitigating greenhouse gas (GHG) emissions than alternative proposals.
Understanding Climate Benefits
The SCC is typically set at a value of $50 per metric ton of carbon dioxide in 2030. That is in 2007 dollars, so updating for inflation would cause that figure to climb to $62 per ton. The text of the SCC explains what is specifically being included in its valuation:
The SC-CO2 is meant to be a comprehensive estimate of climate change damages and includes changes in net agricultural productivity, human health, property damages from increased flood risk, and changes in energy system costs, such as reduced costs for heating and increased costs for air conditioning. However, given current modeling and data limitations, it does not include all important damages.
Note that the SCC does not include potential low-probability, high-consequence effects (known as tail effects). There is an alternative value, roughly triple the standard SCC, if one assumes “high impact” scenarios will come to pass. This value is couched as being outside the 95th percentile, or outside the normally accepted range of statistically probable costs (to be 100 percent confident that a range of costs covers the potential outcomes, the high end of the range would approach infinity). Nonetheless, as the “high-impact” SCC is based on the costs as projected by surveyed experts, it offers a useful insight as to the potential benefits even under dire possible scenarios.
Readers should be cautioned that the SCC has received substantial criticism for bucking established guidelines of measuring environmental benefits. The first critique of the SCC is that it fails to use the discount rates required in the Office of Management and Budget’s (OMB) guidelines, Circular A-4. The SCC, if it followed these guidelines, would offer a range of values using discount rates between 3 and 7 percent (and the $62 figure above uses a standard 3 percent discount rate). The discount rate is how one determines the present-day value of a future benefit, and a simple corollary is thinking about how much one has to invest in retirement today to get a future retirement value. If the expected rate of return is high, you have to invest less; similarly, if you adjust large future costs with a larger discount rate, the present-cost equivalent will be significantly lower. Discount rates allow policymakers to weigh the costs and benefits of policies when recognizing that resources are scarce and come at a cost to alternative policies. The SCC’s range only uses discount rates ranging from 2.5 percent to 5 percent, or a range of $73 per ton to $16 per ton. Had a 7 percent discount rate been included, the range would be $73 per ton to $4 per ton. The IWG defends this exclusion by claiming that the 7 percent rate, while prescriptive, does not match the “descriptive” goals of the OMB in aligning discount rates to returns on capital.
Another major critique is that the SCC uses global benefits to compare against domestic costs. OMB guidelines specifically state that domestic benefits must be used to justify domestic costs. Yet, the authors of the SCC posit global benefits should be used, because “Using a global estimate of damages in U.S. regulatory analyses sends a strong signal to other nations that they too should base their emissions reductions strategies on a global perspective, thus supporting a cooperative and mutually beneficial approach to achieving needed reduction.” In other words, it does not matter that the returns of investment do not go to the investor. The SCC technical support document notes that the domestic benefits are somewhere between 7 and 23 percent of the total benefits, which would amount to between $3.50 and $11.50 for a $50 per ton value, or between $4.34 and $14.26 for a $62 per ton value.
In this analysis, the standard procedure of the EPA in using a 3 percent discount rate is used because that rate more accurately reflects prior measurements of climate benefit. But readers should understand that the benefits can be higher (if tail effects come to pass) or substantially lower (if the higher prescriptive discount rates are used and only domestic benefits are measured).
Costs and Climate Benefits of GND Policies
The GND outlines several proposals that would reduce emissions, but estimating the climate benefits associated with them is problematic. For example, the GND calls for both upgrading every existing structure in the United States for energy efficiency, but also calls for having an electric power sector that has net-zero GHG emissions. Counting the benefits of both of these proposals simultaneously would lead to double counting, as efficiency upgrades yield no climate benefit if their power and heating sources do not contribute to climate change. Outside of the power sector, the GND calls for eliminating emissions as much as is “technologically feasible,” but the constraints and opportunities of such language are not well understood in all sectors of the economy. Agriculture, for example, would struggle to reduce emissions from soil fertilization while maintaining productivity, and the optimal tradeoffs for productivity and emissions are not fully explored.
This paper instead attempts to focus on two of the best defined and most probable sources of emissions reductions in the GND: the electric power sector, and transportation emissions.
The Power Sector
The power sector has the clearest potential benefits and also the most plausibility for achieving them. It is theoretically and technologically feasible to transition to a low-carbon electricity grid, but the relevant question is the cost. The costs of transition are poorly understood, as the incremental integration of non-dispatchable (i.e. cannot produce electricity on demand) resources, such as wind or solar power, also create an increased burden and demand for dispatchable resources (predominantly fossil fuels) to overcome what is called the “duck curve” demand shift.[1] To assess these costs, this paper presumes that a mixture of renewable resources, storage, and new nuclear power plants would be brought online to replace the approximately 700 gigawatts (GW) of existing and anticipated fossil fuel electricity resources.
| 2029 Baseline Capacity (GW) | Required Capacity for Zero Carbon (GW) | Net Capacity Difference (GW) | Net Annual Cost Change (Capital, O&M, and Fuel) (billions 2018 USD) | |
| Coal | 164.8 | 0.0 | -164.8 | -34.8 |
| Natural Gas | 547.1 | 0.0 | -547.1 | -53.8 |
| Nuclear | 81.6 | 438.7 | 357.1 | 175.4 |
| Solar | 93.1 | 681.3 | 588.2 | 65.6 |
| Wind | 118.7 | 681.3 | 562.6 | 72.9 |
| Hydroelectric | 79.2 | 199.1 | 119.9 | 23.2 |
| Battery | 1.9 | 459.3 | 457.4 | 72.8 |
| Other | 38.1 | N/A | N/A | N/A |
| Total | 321.4 | |||
| Total Annual Cost per Household (2018 USD) | 2,546.0 | |||
| Total Annual Climate Benefits | 110.0 | |||
The capital cost associated with replacing these resources is $5.36 trillion. The increase in annual operation and maintenance costs would be approximately $118 billion annually. These costs would be offset by $89 billion of reduced fuel and capital costs for fossil fuel power plants. The total net difference in annual costs, assuming a 20-year capital recovery for new assets, would be $321 billion annually, or $2,546 per household every year.
On the benefits side, the power sector represents 28 percent of total GHG emissions in the United States, at approximately 1.78 billion metric tons annually. At a $62 per ton rate, the climate benefits would be $110 billion globally. If one used the high-impact benefits, the benefits would be $334 billion. Alternatively, if only domestic benefits were measured (of the $110 billion of global benefits), they would be between $7.7 billion and $25.3 billion. Using a conventional policy analysis that does not take into account the less likely impacts of climate change, it would be a struggle for the decarbonization of the power sector, if implemented as a mandate, to be net beneficial.
Transportation
The GND is vague on the transportation sector, and unlike the power sector where the available alternatives are relatively well understood, the transportation sector emissions could be constrained in multiple ways. The GND resolution has the following to say on the subject:
(H) overhauling transportation systems in the United States to remove pollution and greenhouse gas emissions from the transportation sector as much as is technologically feasible, including through investment in—
(i) zero-emission vehicle infrastructure and manufacturing;
(ii) clean, affordable, and accessible public transit; and
(iii) high-speed rail
Clearly, the GND does not explain how the transportation system would be “overhauled,” or what constitutes “as much as is technologically feasible.” Perhaps the only specific proposal is an investment in high-speed rail (HSR). Presumably, this statement implies that if it were technologically feasible to supplant air travel with HSR, it would be pursued, regardless of if it were economically feasible (which is not standard in policy; the current Clean Air Act regulations are constrained by cost considerations). An accompanying document released with the GND resolution outright said that the GND would produce enough HSR that air travel becomes unnecessary, though the validity of this document is in question.[2] Regardless, the wording of the resolution implies a level of investment that would appreciably supplant incumbent travel.
The cost of an HSR network would depend largely upon its size. Track building is a capital-intensive process involving not just the cost of the track, but of the stations and the land required, too. The only existing example of an attempt to build HSR in the United States is in California, where the latest business plans of the now-defunct project showed a capital cost of $129.8 million per mile of track. This study uses this capital cost to estimate how much it would cost to expand HSR across the United States.
Exactly how many miles of an HSR system would be required is unclear. Existing transit rail systems in the United States comprise 11,190 miles. That number includes primarily commuting rail systems such as light rail or subway systems. A better corollary for the size needed for an HSR system would probably be the existing Amtrak system, which is 21,334 miles. Those who have used Amtrak outside of the nation’s Northeast corridor are undoubtedly aware of the limitations of available routes, however, and that it is not an acceptable substitute for alternative transportation methods. A better approximation of the size of a system necessary for HSR appreciably to mitigate transportation emissions would be the interstate highway system, which is currently 46,876 miles. This study simplistically assumes that the original congressional mandate of 40,000 miles is a better indicator of needed system size. The costs would be as follows:
| Potential Size of HSR Network | Miles | Capital Costs for System Size (Billions USD) |
| Transit Rail | 11,190 | $1,452.5 |
| Amtrak | 21,334 | $2,769.2 |
| Interstate Highway System | 40,000 | $5,192.0 |
The environmental benefits of such a system are less easily determined, as it is unclear how much people would shift to the new system. Total transportation sector emissions in 2017 were 1.86 billion metric tons, of which only 121.2 million metric tons were for air travel. It could be assumed that a national HSR network the size of the interstate highway system would supplant those air-travel emissions, and perhaps it would also supplant a large amount of freight transit (423.1 million metric tons). Personal vehicles may be impacted some, but it is doubtful that an HSR network would fully supplant that (and the GND resolution also calls for investing in low-carbon vehicle infrastructure). For the presumed benefits, this paper assumes that all air travel and all interstate freight hauling is replaced.
The total climate benefits would be approximately $33.7 billion per year. If one considers the costs of the HSR system as annualized over a 20-year period (note, this would not include personnel or rolling stock costs), the annual cost would be $259.6 billion. An HSR network would struggle to find enough climate benefits to justify its implementation.
Non-GND Policy Ideas
The content of the GND is quite broad, but puzzlingly it does not include more broadly supported strategies for GHG abatement. Carbon taxes or cap-and-trade, the typical examples of more market-based policies to reduce GHG emissions, are absent from the proposal. The lead sponsor of the GND called a carbon tax a “wimpy” solution, but that point of view is at odds with the data. The following offers a similar examination of the costs and benefits as the above, but of a carbon tax.
The last official governmental estimate of the emissions reductions from a carbon tax came from the Energy Information Administration’s (EIA) 2018 Annual Energy Outlook (AEO). In this estimate, over a 10-year period a $25 per ton carbon tax would reduce annual carbon dioxide emissions by 924 million metric tons, which would deliver an annual climate benefit of $57 billion. To put this estimate in context, the carbon tax would be able to achieve more than half of the emissions reductions promised by the most specific part of the GND, addressing the electric power sector. Further, it would have more than seven times the climate benefits of eliminating domestic air travel.
The costs of a carbon tax, though, are substantially lower than any of the aspects of the GND. After 10 years, the United States’ gross domestic product (GDP) would be $59 billion (2009 dollars) smaller than it otherwise would be, as estimated by the EIA. Updated for 2018 dollars, the value would be approximately $68 billion. Based on the conventional method for estimating climate benefits, however, the carbon tax would be nearly net beneficial by this point, with the benefits in rough parity with costs. As a caveat, it should be noted that over a 10-year period the estimated total GDP impact would be around $431 billion ($504 billion in 2018 dollars), with only $362 billion of climate benefits.
Consider, though, that the above costs are related to a simple carbon tax. Many proponents of a carbon tax today advocate for what is called a “revenue-neutral carbon tax.” The rationale is that a carbon tax raises revenue, but also reduces the purchasing power of Americans and the after-tax profits of businesses, thus harming the economy (as noted by the $59 billion smaller economy in EIA’s estimates). If the revenues simultaneously were used to reduce taxes that currently reduce Americans’ purchasing power and business’ after-tax profits, then at a macroeconomic level the impacts of the tax cut would at least partially counteract the impact of introducing a carbon tax. Estimates of the economic impact (apart from environmental benefits) of this “revenue-neutral carbon tax” typically show a negligible change in overall GDP. For example, Columbia University’s Center on Global Energy Policy estimated that by year 10, a revenue-neutral carbon tax that used revenues to reduce payroll taxes would have a positive impact on GDP of 0.18 percent per year by 2029. This also assumes a $50 per ton carbon tax, delivering more climate benefits than the EIA’s estimated carbon tax. If the economic impact is near zero, the policy becomes exponentially more cost-effective, and the revenue-neutral carbon tax would easily be the most cost-effective emissions mitigation policy. Previous AAF research has compared carbon taxes to alternative policies such as regulation, finding them to be twice as cost-effective.
Simply put, an ill-designed, simplistic carbon tax is nearly a net-positive climate policy by the standard metrics of measuring the benefits of GHG reductions (even though it would hurt domestic GDP). A well-designed, revenue-neutral carbon tax has the potential to have little or even beneficial impacts to the economy. In a comparison of policies, if the outcome is to seek the most benefits for the least cost, a market-based approach to emissions reduction is far superior to the more dramatic proposals that have been included in the GND.
Conclusion
Advocates of policies such as the GND often contend that climate change represents an urgent crisis that demands radical action, regardless of the costs. That underlying premise, however, is flawed. Climate change is not the only existentially threatening problem Americans face, and should not preclude policymakers from considering the cost-effectiveness of policies meant to mitigate it.
Using the methodology for measuring climate benefits established by the Obama Administration—though it has received criticism for inflating benefits by bucking established standards—the most defined aspects of the GND capture few benefits, while likely employing methods that would lead to costs multiple times greater than the benefits.
By way of contrast, policies that take a more market-based approach, such as a carbon tax, are far closer to being net beneficial. Further, a revenue-neutral carbon tax, which would use the revenues from a carbon tax to lower other taxes (leading to a more neutral tax treatment after reform), would have far lower costs than a carbon tax, and thus be even further likely to be net-beneficial.
A dramatic reorganization of the economy to combat a global collective action problem like climate change fails to properly align the costs and benefits. It is an infeasible approach to long-term policy success to subscribe to policy regardless of its efficiency. A nation that takes such an approach to policy would quickly find itself bankrupt. Even the most demanding “existential” policy issues, such as national security, are at least tacitly constrained by strategy and a justification for expenditures. U.S. military spending as a percentage of GDP rarely exceeds 4 percent since the end of the Cold War. The visions of a Green New Deal are not constrained by strategy, and the aspirations are not consistent with the scope of resources available. An “at any cost” approach to policymaking will never produce sustainable outcomes and can inflict more harm than good.
Appendix – Understanding the Costs of Transitioning to Clean Electricity
The methodology for determining the costs of a net-zero emissions electric power sector as above relies on replacing fossil fuel capacity with a mixture of renewable electricity resources and storage assets. The methodology and conclusions are roughly the same as those employed for a prior American Action Forum research paper on the Green New Deal’s costs, and the methodology also mirrors an American Action Forum estimate of the costs to get 100 percent of electricity from renewable resources. These assessments assume that replacing a megawatt of dispatchable fossil fuel capacity requires either replacing it with dispatchable nuclear capacity (in states without nuclear moratoriums), or with a combination of non-dispatchable renewable sources (photovoltaic solar and conventional wind turbines) and storage capacity to cover dispatch gaps. The above estimates assumes storage costs similar to a 4-hour battery, but this is likely an underestimation as at least 12-hours of storage is required for even moderate reliability. Costs for capital, operation, maintenance, and fuel are based on the latest official data from the Energy Information Administration’s Annual Energy Outlook.
A capital cost of $5.36 trillion, and an annualized net cost of $321 billion, or $210 billion after climate benefits may seem large but is consistent with other estimations. In 2016, Geoffrey Heal released a National Bureau of Economic Research paper that estimated the capital costs of reducing greenhouse gas emissions by only 80 percent would require a capital investment of between $3.3 and $5.99 trillion. Similarly, a 2016 research project known as Risky Business used a capital stock roll-over model to estimate the net change in capital investment to reduce greenhouse gas emissions dramatically between 2020 and 2050. That study found that the undiscounted net costs would be between $4.8 trillion and $7.0 trillion (in 2014 dollars), or between $2.7 and $3.8 trillion when discounted at 3 percent. ClearView Energy Partners’ Kevin Book estimated that generating all electricity from renewable energy would cost $2.9 trillion, though that figure may not include storage costs, which a Massachusetts Institute of Technology blog pegged at roughly $2.5 trillion (which would lead to a combined cost of $5.4 trillion). Benjamin Zycher, a scholar at the American Enterprise Institute, estimates that the costs of building and generating enough renewable electricity to meet the Green New Deal’s targets would cost $357 billion annually, with a total cost of $490 billion when including transmission, land, backup generation, and other costs.
Simply, virtually all academic research that has pursued the topic of a top-down directed transition to a purely clean energy grid concluded that several trillions of dollars of investment would be required.
Alternatively, a couple notable pieces of research have claimed the costs are exceptionally low—but their methodology is problematic. Professor Mark Jacobson of Stanford University claimed that the costs of transitioning to a 100 percent renewable electricity grid were quite low. However, scrutiny of the research methodology revealed an assumption of utilizing more hydroelectric capacity than was technically achievable within the United States. Similarly, a Lappeenranta University of Technology and Energy Watch Group assessment found the costs of transitioning to renewable energy would be quite low, but this is because of an assumed price drop in lithium ion batteries (roughly 90 percent). Recent data suggests that the price of lithium ion batteries are rising, not falling, largely on account of cobalt prices that rose by 117 percent from 2016 to 2017.
[1] The “duck curve” is a term of art referring to the unusual shape of daily demand for non-renewable resources when operating on a grid with renewable resources, particularly solar power. Intermittent renewable power generation does not align with the daily demand curve, so as power generation from renewables falls, it must be replaced by a “dispatchable” resource. The more renewables on a grid, the steeper the slope of demand increase, and the more dispatchable resources needed to supplement renewable ones. Energy Information Administration explains here: https://www.eia.gov/todayinenergy/detail.php?id=32172
[2] Significant legislative proposals or resolutions are typically accompanied by supplemental summary documents. The lead sponsor of the Green New Deal released a Frequently Asked Questions document outlining the proposals, but the text had extreme proposals that did not fully align with the resolution including providing “economic security” to individuals “unwilling to work.” The Congressional office in question has disavowed the document, and in an interview with MSNBC blamed its release on a staffer who “had a bad day.” (https://twitter.com/dcexaminer/status/1112095971331227648)