Research
July 18, 2019
Projecting Future Skill Shortages Through 2029
Executive Summary
- The economic benefits of education are well known, as any education above a high school diploma boosts a worker’s likelihood of being employed, his or her earnings, and the economy as a whole.
- This study estimates that, over the next decade, employers in nearly every state will face significant shortages both of workers with an associate degree or some college (nearly 800,000 workers) and of workers with a bachelor’s degree or higher (over 8.5 million workers), leading to nearly $1.2 trillion in lost economic output.
- The labor shortage is likely driven in part by demographic shifts, but these findings indicate that current levels of educational attainment are insufficient, and policymakers can address these shortfalls by encouraging higher levels of education and skills development.
Introduction
Prior AAF research found that higher educational attainment has clear economic benefits for both workers and the economy. All education levels beyond a high school diploma lead to increased chances of employment and higher wages, and, as a result, educational attainment has a powerful effect on the national and state-level economies.
Given the economic value of education and the skills it provides, it is worth considering whether the United States educational system is producing workers with the skills and educational qualifications that employers are demanding now and will be in the future. This study seeks to answer this question.
Recent demographic and employment trends make understanding potential shortfalls in the labor force even more pressing. A recent survey of employers found that about 83 percent of respondents are having difficulty finding suitable candidates to hire, and about 75 percent of those respondents believed a skill shortage existed in their applicant pools.[1] Government data provide more evidence of a labor shortage. In the Bureau of Labor Statistics’ (BLS) April 2019 release of Job Openings and Labor Turnover,[2] there were about 7.4 million job openings, but about 5.9 million hires – a gap that has persisted since January 2015, as the chart below from the Federal Reserve[3] shows.
Chart 1: Unemployment, Job Openings, and Hires, 2010-Present
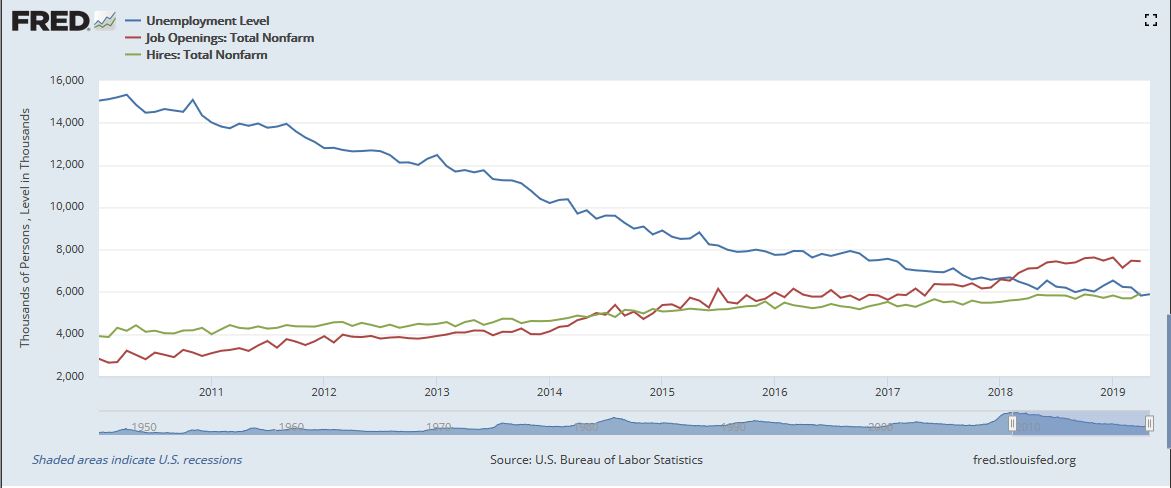
This gap between job openings and available labor is likely due in large part to demographic shifts: The United States faces an aging workforce,[4] decreasing labor force participation rates, and a general slowing in growth of the civilian noninstitutional population (i.e. people not either incarcerated or in the military).[5] These factors mean that firms and businesses face difficulties hiring new workers with the appropriate skills, in part because there simply aren’t the number of workers there have been in the past (relative to the size of the economy). The stagnating labor force will put more pressure on the educational system to produce workers with the skills that employers need; employers can’t simply count on a large labor pool from which to choose the right workers.
This analysis estimates both educational attainment and employer demand for workers with these credentials in order to estimate the possible future skill shortages the nation could face through the next decade. It uses regression models that causally link the size of the economy to demand for workers with certain credentials. This study indicates that, based on current trends, all states will face a shortage in workers with the needed education.
Data and Methodology
This study focuses on skills as defined by two groups. The first is workers with associate degrees or some college. The second is those with bachelor’s degrees and higher. Data was collected from the Census Bureau’s American Factfinder tool to retrieve figures for the number of employed workers with these education levels.[6] While a more robust analysis could concentrate on the industry-specific skills or specific professional certifications that the employers of the future may require, this study takes a more general view of what sorts of higher education degrees are expected to be in demand.
Two regression models were used to project future employer demand for workers with these two levels of education. Using real state gross domestic product (RSGDP) to explain current demand for workers at these educational-attainment levels, the models were then able to project future demand for workers by skill level by applying CBO’s future estimate of real gross domestic product. [7] A more detailed explanation of methodology and regression results can be found in the Appendix.
To project the future supply of workers at each education level, this study calculates compound annual growth rates for states’ labor forces to calculate the size of future labor forces. Then using the average proportion within the labor force of employed workers at each education level, this study calculates the future supply of workers for both skill levels.
Finally, by comparing the supply estimates to demand estimates, we return either labor shortages or surpluses by skill level for each state in 2029.
To calculate lost economic output resulting from the skill shortages by each state, this study uses states’ 2018 GDP and divides those figures by the total number of employed workers in the respective state. This figure serves as a simple estimate of output per worker in 2018. Multiplying these figures by the estimated 2029 shortages for both skill levels gives a rough estimate for the lost economic output resulting from the projected skills shortage. These figures, although simple, could also be underestimates considering they used 2018 state RGDP instead of future 2029 state RGDP. They serve, however, as conservative signs of future opportunity costs the economy could face in the next decade due to skill shortages. These findings can be found in Table 2.
Shortages
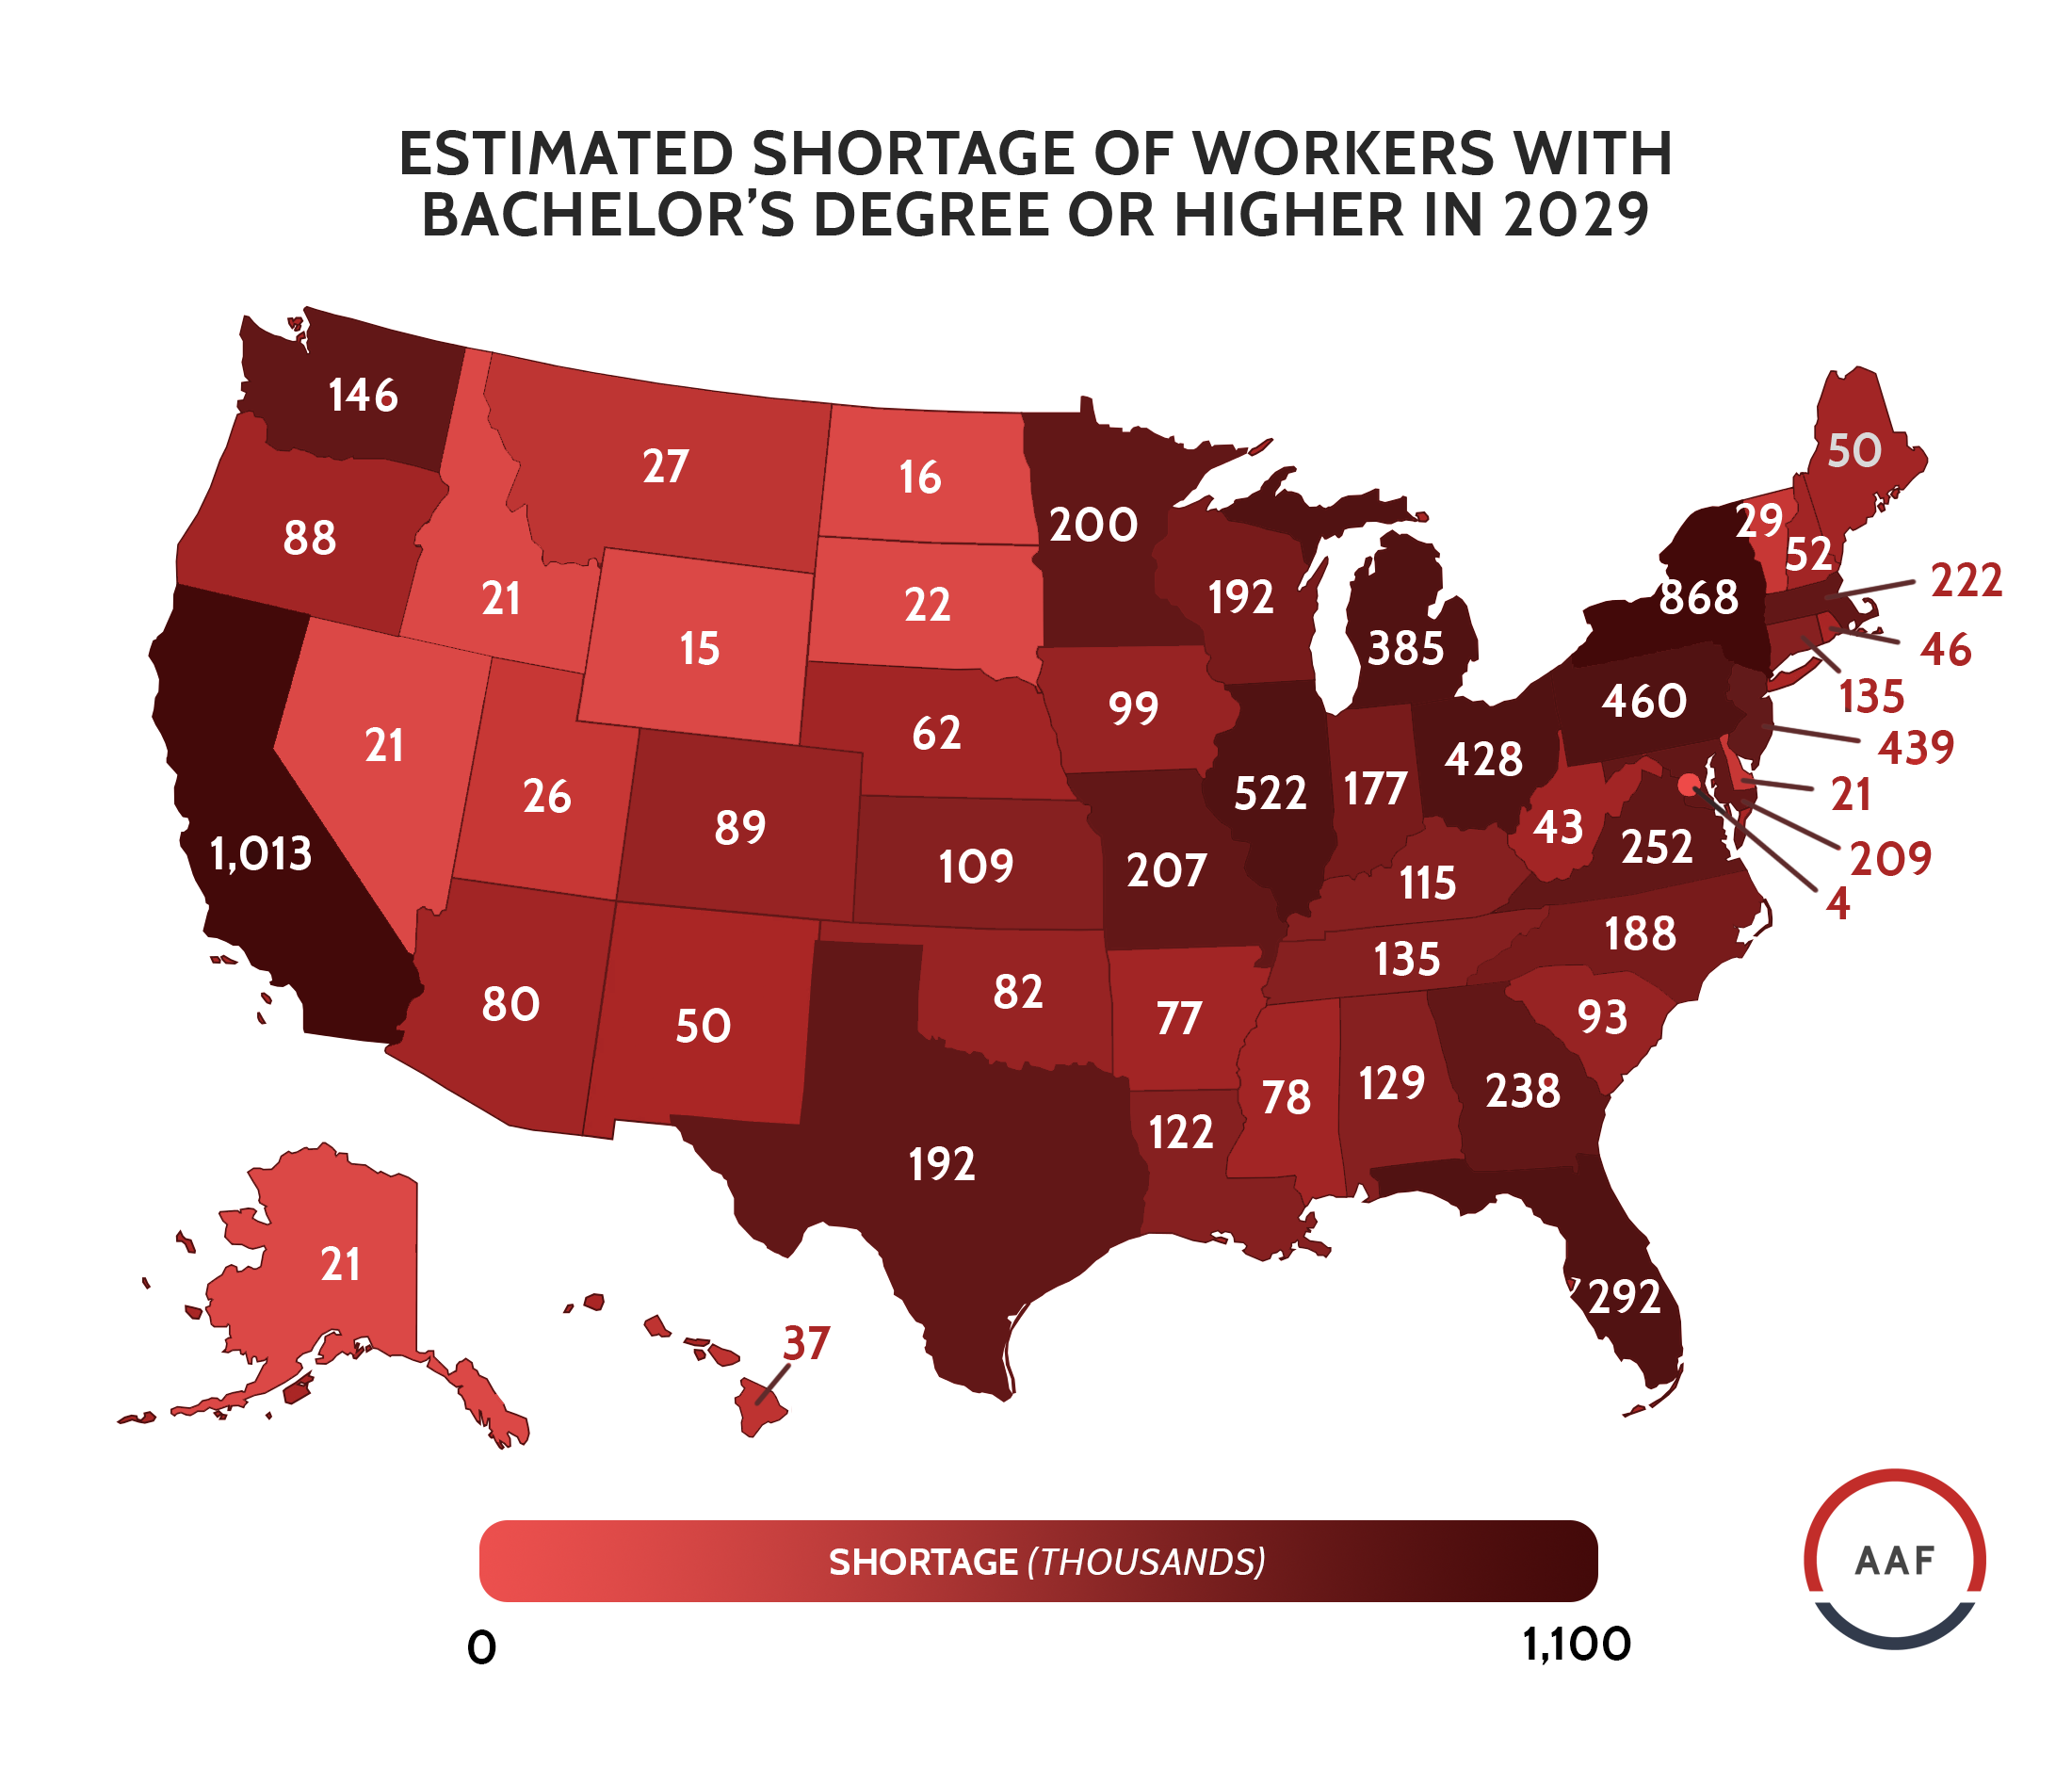
Maps 1 and 2 contain the estimated shortages for both skill levels broken down by state. These figures, rounded to the nearest thousand, are summed to calculate an estimate for the nation.
Over the next decade, the nation as a whole could face a shortage of about 765,000 needed workers with the skills that come from an associate degree or some college. For workers needing a bachelor’s degree or higher, the figure is about 8.62 million. These figures combined amount to about 5.6 percent of the estimated 2029 labor force.
Other studies have found similar figures, where overall skills shortages could range from about 6 million to 8 million.[8]
Map 1: Estimated Shortage of Workers With Bachelor’s Degree or Higher in 2029 (in thousands)
Map 2: Estimated Shortage of Workers With Associate Degree or Some College in 2029 (in thousands)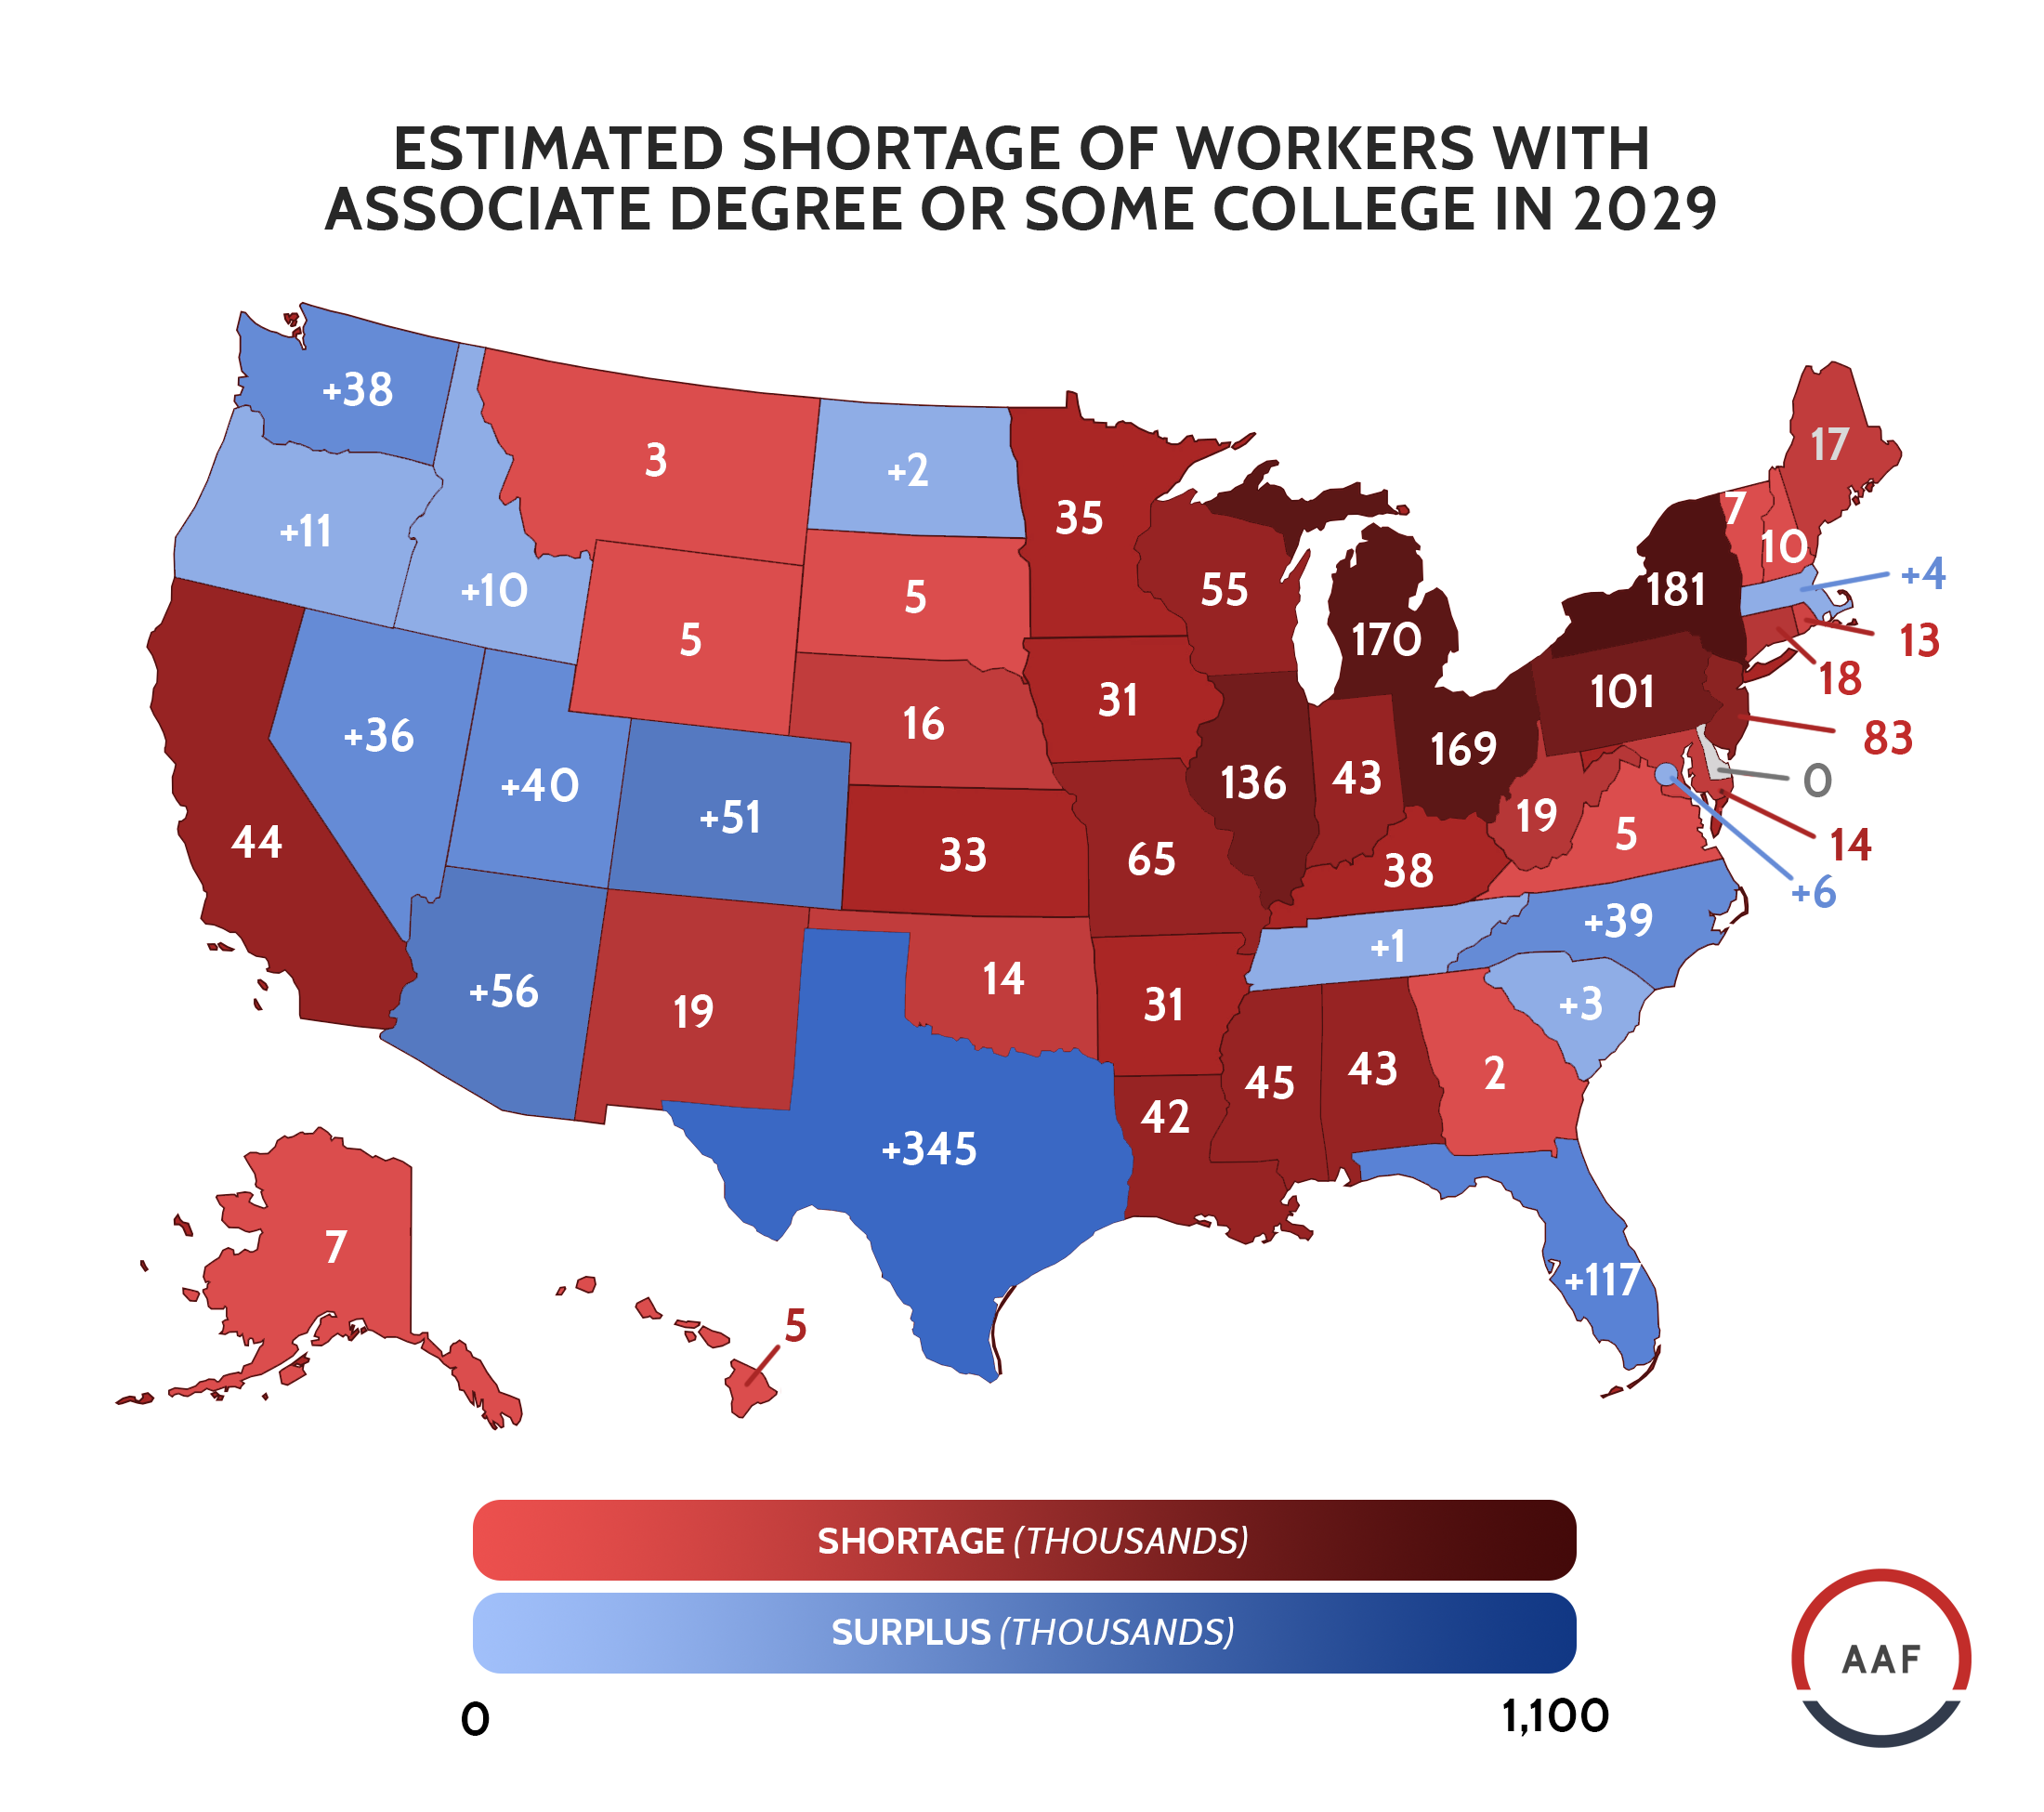
Every state is on track to face a shortage of workers needing a bachelor’s degree and up, while most states are on track to face a shortage of workers needing an associate degree or some college. While policymakers often focus on traditional four-year degrees and postgraduate attainment, this study demonstrates there could still be a substantial shortage of workers needing less than a bachelor’s degree but more than a high-school diploma.
Lost Economic Output
The United States faces about $1.2 trillion in lost economic output if these shortages do indeed exist and are not mitigated in the future. The lost output comes mostly from the shortage of workers with a bachelor’s degree or higher.
Table 1: Estimated Lost Economic Output in 2029 (Billions of USD)
| State | Associate/Some College | Bachelor’s and Up |
| Total | -$177.3 | -$1,064.5 |
| Alabama | -$4.1 | -$12.4 |
| Alaska | -$1.1 | -$3.4 |
| Arizona | -$8.7 | |
| Arkansas | -$2.8 | -$7.1 |
| California | -$6.9 | -$157.9 |
| Colorado | -$11.0 | |
| Connecticut | -$2.6 | -$19.4 |
| Delaware | -$2.9 | |
| DC | -$0.6 | |
| Florida | -$30.5 | |
| Georgia | -$0.2 | -$27.4 |
| Hawaii | -$0.6 | -$4.6 |
| Idaho | -$2.0 | |
| Illinois | -$17.0 | -$65.2 |
| Indiana | -$4.5 | -$18.4 |
| Iowa | -$3.3 | -$10.7 |
| Kansas | -$3.5 | -$11.7 |
| Kentucky | -$3.7 | -$11.1 |
| Louisiana | -$4.9 | -$14.2 |
| Maine | -$1.5 | -$4.5 |
| Maryland | -$1.9 | -$28.0 |
| Massachusetts | -$30.6 | |
| Michigan | -$18.0 | -$40.8 |
| Minnesota | -$3.9 | -$22.4 |
| Mississippi | -$4.0 | -$6.9 |
| Missouri | -$6.4 | -$20.2 |
| Montana | -$0.3 | -$2.5 |
| Nebraska | -$1.8 | -$6.8 |
| Nevada | -$2.2 | |
| New Hampshire | -$1.1 | -$5.8 |
| New Jersey | -$11.1 | -$58.6 |
| New Mexico | -$2.1 | -$5.5 |
| New York | -$26.9 | -$129.0 |
| North Carolina | -$20.8 | |
| North Dakota | -$1.9 | |
| Ohio | -$18.3 | -$46.3 |
| Oklahoma | -$1.6 | -$9.4 |
| Oregon | -$9.8 | |
| Pennsylvania | -$12.0 | -$54.5 |
| Rhode Island | -$1.4 | -$5.0 |
| South Carolina | -$8.8 | |
| South Dakota | -$0.5 | -$2.3 |
| Tennessee | -$14.2 | |
| Texas | -$25.7 | |
| Utah | -$2.7 | |
| Vermont | -$0.7 | -$2.8 |
| Virginia | -$0.6 | -$30.0 |
| Washington | -$21.7 | |
| West Virginia | -$1.9 | -$4.2 |
| Wisconsin | -$5.5 | -$19.4 |
| Wyoming | -$0.7 | -$2.0 |
Policy Implications
These shortages and the consequent loss in economic output suggest that policymakers should address the rate at which workers receive certifications related to any form of post-secondary education. Even though the rate of return on a bachelor’s degree reflects its continuing value,[9] increasing tuition costs and the rising levels of student debt associated with these costs put this kind of education out of reach for many; further, not everybody wants or needs to pursue a bachelor’s degree. Other kinds of post-secondary education are often more affordable, attainable, or useful for many.[10] Nevertheless, states should not neglect bachelor’s degree programs, as these results show. All states need workers with the skills that come with a bachelor’s degree.
Narrowing the skills shortage would allow businesses to more easily hire workers who would then have the necessarily skills to fill future job openings. Especially as the labor force stagnates, skills development through education will be vital to a healthy economy. With wider educational attainment, firms could find good workers who can increase output and efficiency, and state and national economies could maximize productivity.
These findings lead to several further questions from a skills-development perspective. Are those graduating with bachelor’s degrees obtaining the skills they need to succeed in the workforce on average? In other words, does the credential truly signal that the bearer has the needed skills? Further, could the skills demanded by employers who currently require bachelor’s degrees or higher be obtained with other certifications? What other educational routes beyond the traditional two-year or four-year model could provide the same skills?
Caveats and Conclusions
An aging workforce is characteristic of developed economies across the world. With millions of workers retiring and the economy still growing, there are projected to be millions of new job openings.[11] As a result, the future demand for skilled workers could vastly exceed the supply. By 2029, the demand for workers with an associate degree or some college could be about 800,000 higher than the supply. The shortage for workers with a bachelor’s degree or higher could be about 8.6 million. These educational and skill shortages could result in about $1.2 trillion in lost economic output.
These are simple estimates based on projections and extrapolations of census data, and they should not be interpreted as “forecasts” per se. They simply represent the implicit gap between the current growth in the demand for skills and the current generation of skilled graduates. While these estimates seem plausible and are similar to those found in other studies, both the demand and supply side of the labor force are likely to change, so the future reality likely will not exactly match these estimates.
Nevertheless, the basic message to policymakers and future workers is clear: Current levels of educational attainment and skills development are unlikely to be adequate over the next decade. These findings indicate the need for sound policies that encourage greater educational attainment and skills development. By boosting these, the labor force could better match the needs of employers, minimizing lost opportunities.
Appendix
Table 1: Estimated Skills Shortages in 2029 (Thousands)
| State | Associate/Some College Shortage | Bachelor’s and Up Shortage |
| Total | -765 | -8,624 |
| Alabama | -43 | -129 |
| Alaska | -7 | -21 |
| Arizona | 56 | -80 |
| Arkansas | -31 | -77 |
| California | -44 | -1,013 |
| Colorado | 51 | -89 |
| Connecticut | -18 | -135 |
| Delaware | 0 | -21 |
| DC | 6 | -4 |
| Florida | 117 | -292 |
| Georgia | -2 | -238 |
| Hawaii | -5 | -37 |
| Idaho | 10 | -21 |
| Illinois | -136 | -522 |
| Indiana | -43 | -177 |
| Iowa | -31 | -99 |
| Kansas | -33 | -109 |
| Kentucky | -38 | -115 |
| Louisiana | -42 | -122 |
| Maine | -17 | -50 |
| Maryland | -14 | -209 |
| Massachusetts | 4 | -222 |
| Michigan | -170 | -385 |
| Minnesota | -35 | -200 |
| Mississippi | -45 | -78 |
| Missouri | -65 | -207 |
| Montana | -3 | -27 |
| Nebraska | -16 | -62 |
| Nevada | 36 | -21 |
| New Hampshire | -10 | -52 |
| New Jersey | -83 | -439 |
| New Mexico | -19 | -50 |
| New York | -181 | -868 |
| North Carolina | 39 | -188 |
| North Dakota | 2 | -16 |
| Ohio | -169 | -428 |
| Oklahoma | -14 | -82 |
| Oregon | 11 | -88 |
| Pennsylvania | -101 | -460 |
| Rhode Island | -13 | -46 |
| South Carolina | 3 | -93 |
| South Dakota | -5 | -22 |
| Tennessee | 1 | -135 |
| Texas | 345 | -192 |
| Utah | 40 | -26 |
| Vermont | -7 | -29 |
| Virginia | -5 | -252 |
| Washington | 38 | -146 |
| West Virginia | -19 | -43 |
| Wisconsin | -55 | -192 |
| Wyoming | -5 | -15 |
Data was collected from the Census’ American Fact Finder and Federal Reserve St Louis Branch.
Regression models were fitted to project future demand for skills. We adopted a fixed-effect model to account for unobservable state and time characteristics. Our dependent variable for our models is the log number of employed workers with a specific skill level. Our independent variable is the log state real gross domestic product (LRSGP). We also included a variable to control for time effects (t). It takes integer values starting at 1 for the first year of our data (2005) and increases to 12 for our last year of data (2017).
The model to predict demand for associate degree or some college workers is
ln(number of workers with associate degree or some college) = β0 + β1 (LRSGP) + β2 (t) + e
Table 1: Dependent Variable: LN of Employed Workers with Associate Degree or Some College
| Variable | Coefficient
(Standard Error) |
| LN of RSGDP | 0.1889***
(0.0469) |
| t | 0.0051***
(0.0010) |
| Constant | 10.6797***
(0.5653) |
| R2 Overall | 0.8841 |
The model to predict demand for workers with bachelor’s degree and higher is
ln(number of workers with bachelor’s or higher) = β0 + β1 (LRSGP) + β2 (t) + e
Table 2: Dependent Variable: LN of Employed Workers with Bachelor’s or Higher
| Variable | Coefficient
(Standard Error) |
| LN of RSGDP | 0.3074***
(0.07289) |
| T | 0.0512***
(0.0011) |
| Constant | 9.2406***
(0.8799) |
| R2 Overall | 0.9487 |
We collected CBO estimates of future national real GDP from 2019 to 2029. We then multiplied these figures with the most recent available data on state contributions to real GDP to get estimates of state RGDP from 2019 to 2029. Using these figures, we calculated the annual growth rates in percentages of state RGDP and multiplied these with the coefficients of the LN of RSGDP, while also adding the coefficient of the time variable (T). This resulting figure is the growth rate of employed workers for the specific skill level for 2019 to 2029, associated with RGDP growth. We then take the previous year’s level of employed workers with the corresponding skill level (2018) and multiply it by the resulting growth rate from 2019. Then using that level of employed workers by corresponding skill level for 2019, we then multiply it by the 2020 growth rate, and so forth to 2029, to estimate number of workers employed at both skill levels. This result served as the estimate of future demand of workers through 2029.
For supply estimates, we calculated the compounded annual growth rate of a state’s labor force. We then grew the most recent figure of the state’s labor force (2018) by the compound annual growth rate through 2029. We took the average proportion of the labor force that is employed by the skill levels and multiplied it with the estimates of the future civilian labor force for each state, assuming educational attainment rates stayed relatively constant through the next decade. This result provided an estimate of the state’s supply of workers with either skill level from 2019 to 2029.
Finally, by comparing the estimates of workers in the labor force at both skill levels with the number of workers that would be employed, we estimate the shortage or surplus of workers by skill level in each state.
[1] https://www.shrm.org/hr-today/trends-and-forecasting/research-and-surveys/Documents/SHRM%20Skills%20Gap%202019.pdf
[2] https://www.bls.gov/news.release/jolts.nr0.htm
[3] https://fred.stlouisfed.org/series/JTSJOL
[4] https://www.bls.gov/careeroutlook/2017/article/older-workers.htm
[5] https://www.bls.gov/spotlight/2016/a-look-at-the-future-of-the-us-labor-force-to-2060/home.htm
[6] https://factfinder.census.gov/faces/nav/jsf/pages/searchresults.xhtml?refresh=t
[7] https://www.cbo.gov/publication/54918
[8] https://dsqapj1lakrkc.cloudfront.net/media/sidebar_downloads/FOWTalentCrunchFinal_Spring2018.pdf
[9] https://libertystreeteconomics.newyorkfed.org/2019/06/despite-rising-costs-college-is-still-a-good-investment.html
[10] https://libertystreeteconomics.newyorkfed.org/2019/06/the-cost-of-college-continues-to-climb.html
[11] https://1gyhoq479ufd3yna29x7ubjn-wpengine.netdna-ssl.com/wp-content/uploads/2014/11/Recovery2020.FR_.Web_.pdf