Research
March 2, 2020
The National Implications of Maryland’s All-Payer System
Executive Summary
- As part of the debate around single-payer government health care, some have advocated for a national version of Maryland’s All-Payer System (MAPS)—a statewide rate-setting program that requires all insurers, both public and private, to pay the same administratively set rate for any hospital service.
- Supporters argue that MAPS provides a model for ensuring equitable access to care and bringing down system-wide costs while preserving private insurance, but the data point to serious fiscal challenges in the program: From 1991 to 2017, MAPS has cost the Medicare Trust Fund over $20 billion more than it would have spent absent the program, and Maryland remains one of the highest-cost states in the country.
- If MAPS were expanded to every other state, it would have cost taxpayers an extra $77 billion in Medicare spending in 2016, expediting Medicare’s insolvency.
Introduction
As part of the debate around single-payer government health care, some have advocated for a national version of Maryland’s All-Payer System (MAPS), arguing that Maryland’s system is a way to ensure equitable access to care while preserving private insurance. Under MAPS, the state requires all insurers, both public and private, to pay the same administratively established rate for any service provided at a hospital. Such a system ensures that everybody has the same access to care, as providers have no reason to discriminate between payers.
To make MAPS work, however, Maryland receives disproportionately enhanced funding from Medicare. Maryland itself does not have the money to fund its own program, so in practice this increased funding translates to 49 states and the District of Columbia subsidizing the Maryland rate-setting program. Applying such a payment framework to all states would create serious financing problems. This year’s Medicare Trustees Report projected that the Hospital Insurance Trust Fund will be depleted in 2026, at which point it will be able to pay only a declining value of Medicare benefits.[1] Expanding this program to the entire country would result in a substantial increase in the cost of the Medicare program and would ultimately move forward the date of Medicare insolvency.
Background
In most states, hospitals negotiate with third-party payers in the private market in order to determine the rates that private insurers will pay for each service. Public payers such as Medicare and Medicaid, however, pay hospitals government-set, pre-determined rates. This price-fixing permits Medicaid and Medicare to pay hospitals on average 13 percent below the cost of treating patients.[2]
To make up for the shortfall in payments from Medicare and Medicaid, hospitals must negotiate higher payments from private insurers. For example, the Congressional Budget Office found that private insurers reimburse at rates 89 percent greater than Medicare, on average.[3] Similarly, the RAND Corporation found even greater disparity between Medicare and the private market, with private plans reimbursing at 241 percent of Medicare rates in 2017.[4]
This cost-shifting does not occur for hospital rates negotiated in Maryland. In order to relieve the payment disparities between private and public payers, Maryland formed an all-payer system. Established in 1977, MAPS requires all insurers, both public and private, to pay the same administratively established rate for any service at a given hospital. The Maryland Health Services Cost Review Commission (HSCRC) establishes the rates that are paid by all payers.[5] For such a system to allow providers to remain solvent, the price must be set somewhere between the low Medicare reimbursement rate and the rate charged to private payers. As a result, the federal government must increase payment rates for Medicare.
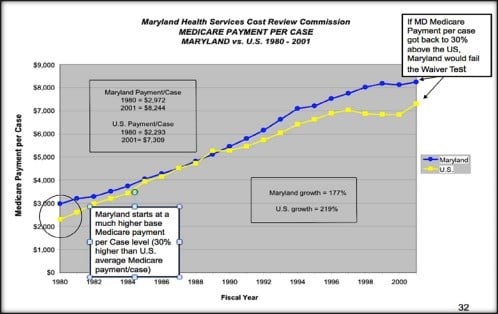
In the same year MAPS was established, Maryland received a waiver from Medicare, whereby Medicare agreed to pay the HSCRC-established rates in place of Medicare’s scheduled payments. The HSCRC payment per case for Maryland hospitals was about 30 percent higher than Medicare payments nationally in 1980. Under the system, the federal government must increase payment rates for Medicare to meet the rates set by the HSCRC.
MAPS and Medicare Costs
As shown in Figure 1, below, Medicare payment per case in Maryland approached the national average between 1980 and 1990, arguably because overall Medicare spending was already quite high during that period. But the All-Payer Program was altered numerous times after 1990 in reaction to market changes, increased managed-care penetration, and deteriorating hospital financial status, resulting in payment-rate increases. Furthermore, major cuts to Medicare payments under the Balanced Budget Act of 1997 were implemented nationally, which significantly reduced hospital payments. Since 1990, Medicare payments per case in Maryland have outpaced the national average.
Figure 1. Medicare Payment Per Case in Maryland Compared to National Average 1980-2001[6]
Comparing Maryland hospital payment rates with Medicare’s standard outpatient and inpatient payment rates for Medicare patients indicates that Maryland hospitals received $1.44 billion more in Medicare payments in 2017 than they otherwise would have—effectively a subsidy from other states.
Figure 2. Annual Medicare Subsidy to Maryland Hospitals FY 2013-2017 (millions)
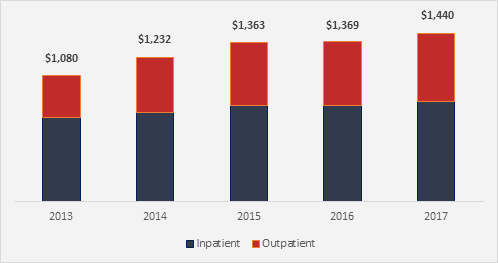
Source: RTI International, Evaluation of the Maryland All-Payer Model, November 2019
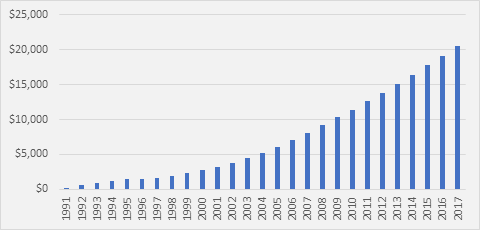
Moreover, it is estimated that the cumulative Medicare subsidy to Maryland hospitals between 1991 (the first year for which these data are available) and 2017 was $20.6 billion (displayed in Figure 3).[7],[8] It stands to reason that the significant increase of federal dollars that MAPS has brought into the Maryland hospital system has benefited the insurance industry as a whole, as the flat rate requires lower payment rates from private insurers.[9]
Figure 3. Cumulative Medicare Subsidy to Maryland Hospitals (millions)
MAPS and Per-Capita Costs
Even though it sets rates, MAPS has done little to produce a lower cost of care in the state, despite promises to the contrary. As of 2014, the per capita costs of personal health care in Maryland were $8,602—which ranked 33rd among states.[10]
In 2015, Maryland received approval from the Centers for Medicare and Medicaid Innovation to update MAPS by revising the per-capita waiver test and including a system of global hospital budgets for a subset of Maryland hospitals. Under this fixed global budget system, hospitals are incentivized to manage care and engage in other activities that reduce unnecessary hospital admissions, readmissions, imaging, and other ancillary and outpatient services to maintain profit margins.[11]
The updated program seeks to limit all-payer annual per-capita hospital spending growth to 3.58 percent, which is the 10-year per-capita growth rate of the Maryland economy. Another goal was to limit, between 2015 and 2018, annual Maryland Medicare per-capita hospital payment growth to a rate lower than Medicare’s national annual per-capita hospital growth rate, as well as to reduce the Medicare subsidy by at least $330 million over this period. As of August 2016, the estimated cumulative reduction in Maryland’s Medicare subsidy was estimated to be $429 million because of the waiver, which far exceeds the model’s five-year hospital savings requirement of $330 million.[12] While the Medicare subsidy to Maryland has declined, the net result is a continued annual subsidy of $1.4 billion.
Barriers to Expanding Maryland’s All-Payer System
Given current proposals that would introduce a Medicare for All-style system at the federal level, it is unsurprising that Maryland’s Medicare-subsidized rate-setting program is being referenced by some as a model to emulate. Proponents argue it would preserve private insurance while giving the federal and state governments more control to contain costs through rate setting.
Proponents fail to articulate the challenges to a national implementation, and these challenges largely stem from the payment imbalance between Maryland and other states. Despite the modest reductions in the Medicare subsidy resulting from recent reforms to Maryland’s system, the all-payer system still results in Maryland hospitals receiving greater payments from Medicare than they otherwise would. While it is estimated that the waiver resulted in a reduction in the subsidy of $796 million from 2014 to 2018, Maryland still received a subsidy from Medicare to the tune of $1.440 billion in 2017. And even if Maryland hospitals achieve the reformed program’s goal of $200 million in savings on average per year from 2019 to 2023, the state would still be receiving roughly $1.24 billion in extra Medicare payments per year. In other words, the subsidy from the Medicare Trust Fund that props up the rate-setting program dwarfs the savings the program aspires to achieve.
What would happen if the current program, with its current Medicare reimbursement levels, were expanded to every other state and Washington, DC? When adjusted for population and geographic variation in costs, the Maryland system would have resulted in an additional $77 billion in Medicare spending in 2016 alone.
On top of the budget concerns, it has been suggested that Maryland’s recent global budget cap model—which would be needed to help make this sort of program viable on a national scale—would lower hospital utilization or lower aggregate payments to hospitals, or both.[13] While these changes drive providers to find greater efficiencies, they could also result in access issues, as lower payments could lead some hospitals to close. Any implementation would need to account for these potential challenges.
Conclusion
The data around MAPS indicate that it has faced several problems. First, MAPS comes at the expense of the Medicare program as a whole—effectively requiring other states to subsidize it. Moreover, such a system has proven not to be a route to bending the cost curve: Maryland remains one of the highest-cost states in the country. These facts raise fundamental questions about the viability of rate-setting programs.
[1] https://www.cms.gov/Research-Statistics-Data-and-Systems/Statistics-Trends-and-Reports/ReportsTrustFunds/Downloads/TR2019.pdf
[2] https://www.aha.org/system/files/2018-05/2018-chartbook-table-4-4.pdf
[3] https://www.cbo.gov/system/files/115th-congress-2017-2018/presentation/52819-presentation.pdf
[4] https://www.rand.org/pubs/research_reports/RR3033.html
[5] https://olis.leg.state.or.us/liz/2017I1/Downloads/CommitteeMeetingDocument/139176
[6] Source: Global Health Payment LLP, https://olis.leg.state.or.us/liz/2017I1/Downloads/CommitteeMeetingDocument/139176
[7] “Health Expenditures by State of Residence, 1991-2014” CMS, https://www.cms.gov/Research-Statistics-Data-and-Systems/Statistics-Trends-and-Reports/NationalHealthExpendData/NationalHealthAccountsStateHealthAccountsResidence.html.
[8] This calculation was originally produced by Dobson DaVanzo & Associates. Medicare per-beneficiary hospital spending in Maryland was compared to national per-beneficiary spending from 1991 to 2014 using State Health Expenditure data from CMS to estimate the subsidy per beneficiary in each year, which was then multiplied by the number of Medicare beneficiaries in each year. The RTI estimated subsidy amounts for 2015 and 2016 (as shown in Exhibit 2) was used also. Similar data from 1980 through 1990 were unavailable for this estimate.
[9] John, E. McDonough, “Tracking the Demise of State Hospital Rate Setting”, Health Affairs, January/February 1997.
[10] https://www.cms.gov/Research-Statistics-Data-and-Systems/Statistics-Trends-and-Reports/NationalHealthExpendData/NationalHealthAccountsStateHealthAccountsResidence
[11] ”Maryland’s All-Payer Global Budget Cap Model and Its Implications for Providers” The Advisory Board Company, May 2016. https://www.advisory.com/health-policy/resources/2016/maryland-all-payer-model-and-implications-for-providers
[12] Nelson Sabatini, Joseph R. Antos, Howard Haft, and Donna Kinzer, “Maryland’s All-Payer Model – Achievements, Challenges, and Next Steps” January 2017, https://www.healthaffairs.org/do/10.1377/hblog20170131.058550/full/.
[13] “Maryland’s All-Payer Global Budget Cap Model and Its Implications for Providers” The Advisory Board Company, May 2016. https://www.advisory.com/health-policy/resources/2016/maryland-all-payer-model-and-implications-for-providers