Research
June 1, 2021
Tracker: Paycheck Protection Program Loans
Introduction
The following tracker uses the most recent data from the Small Business Administration (SBA) to chart the allocation of Paycheck Protection Program (PPP) funds.
Context
In the face of the economic and social disruption caused by the coronavirus, Congress has enacted three economic relief packages. With an estimated $2 trillion price tag, the third package, the Coronavirus Aid, Relief, and Economic Security (CARES) Act, is perhaps the largest and most significant federal emergency aid bill in U.S. history.
The CARES Act set aside $349 billion for the relief of small businesses, to be administered by the SBA in the form of the PPP. The SBA commenced the PPP on April 3, 2020, and closed the program on April 16, 2020, on the exhaustion of the $349 billion appropriated by Congress (Round One). Congress later provided an additional $320 billion for the PPP in H.R.266, the Paycheck Protection Program and Health Care Enhancement Act (Round Two). This brought the total funds available to the SBA and the PPP to $669 billion. The PPP program was due to expire at midnight on June 30 with funds remaining, but just hours for the expiration of the program Congress authorized an extension through August 8. This date passed without a second extension to the program.
On December 21 Congress passed the Consolidated Appropriations Act, 2020 (CAA) which was signed into law by President Trump December 27. Amongst other provisions, including jobless benefits and stimulus checks, the $900bn CAA package included $284bn once again for the PPP program, and, in addition to other program changes, made it possible for businesses to apply for a second PPP loan up to a maximum loan amount of $2m. The CAA also rescinded the $147bn that had remained in the program at the end of Round Two, simultaneously increasing and decreasing the funds available to the program on re authorization. The SBA reopened the PPP on Monday January 11, 2021, with a two-day period where access to the program would only be possible for the smallest businesses and those owned by minorities; after this the program was opened to all who qualify. On March 30 President Biden signed a bill extending the application deadline from March 31 to May 31; the American Rescue Act also added $7.25bn in additional funds to the program.
On May 5 the SBA announced that all funds for Round Three, and the PPP as a whole, had effectively been exhausted.
Detailed below are the total number and value of PPP loans and a resulting analysis, including data on lenders and state recipients.
Data in the below tracker are provided as of 5/31/2021. All data have been sourced from the SBA, which provides program information for the PPP here. This tracker will be updated with PPP data as the SBA makes it available, typically on Tuesdays.
Summary Data
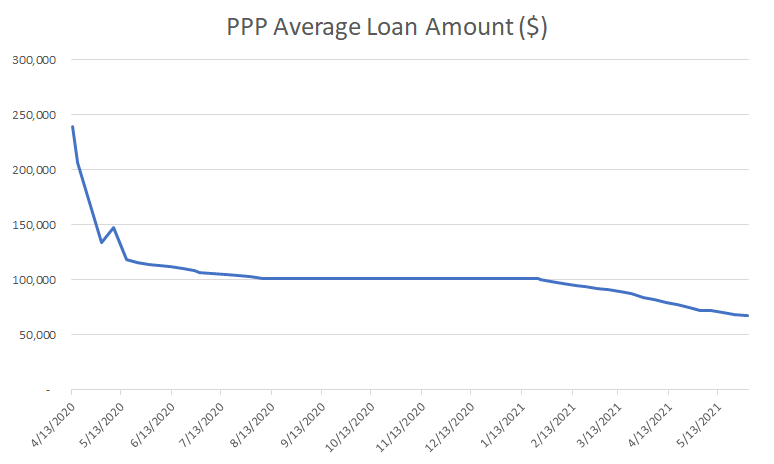
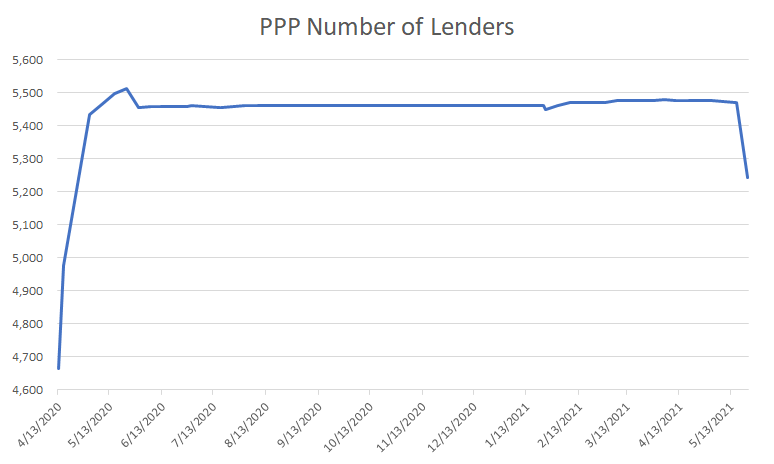
The tables below illustrate the total number and value of PPP loans disbursed to date in addition to the average value of a PPP loan and the total number of SBA-approved lenders.
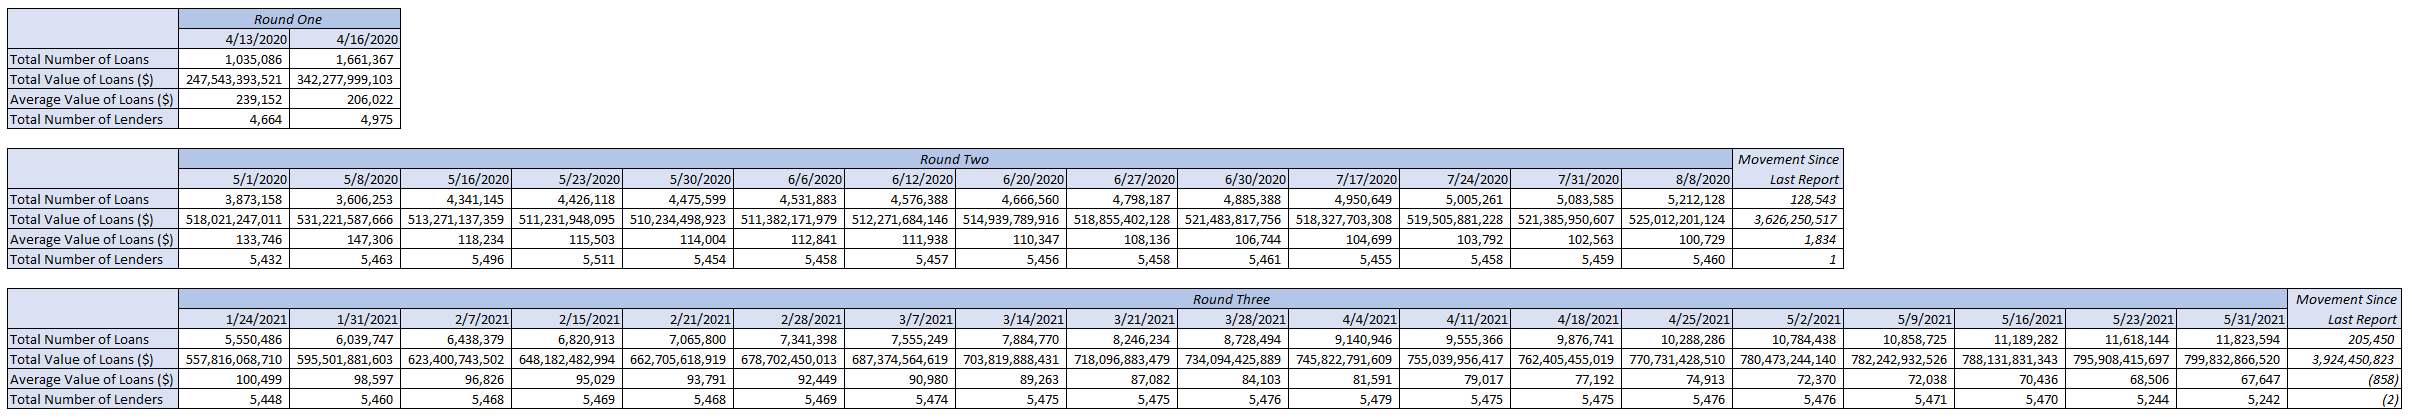
As of 5/31/2021 the SBA has disbursed $800 billion of the $813.5 billion so far appropriated by Congress to this program. As of Round Three, $6 billion, or 2 percent of Round Three PPP funding, remain available to the program.
On May 5 the SBA announced that all funds for Round Three, and the PPP as a whole, had effectively been exhausted.
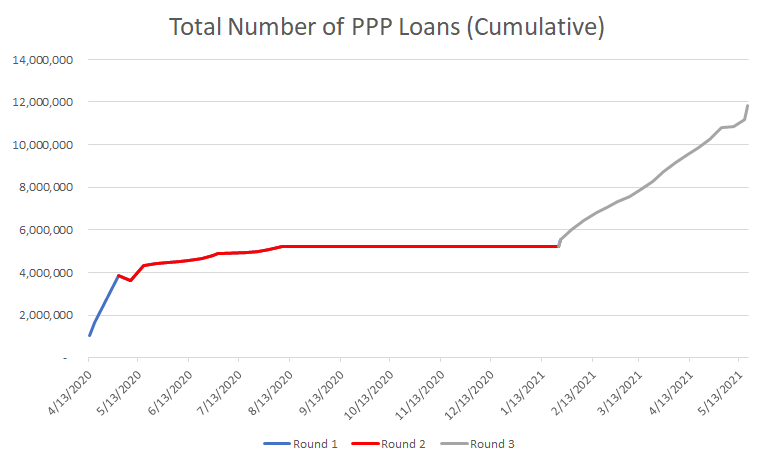
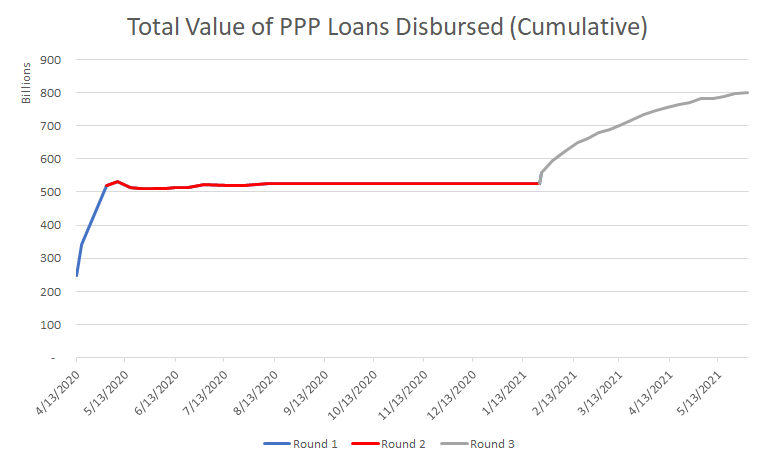
These data are represented in graphical form below.
First and Second Draw Data
As of the 1/31/2021 PPP report the SBA has provided a breakdown of PPP loans by first and second draw.
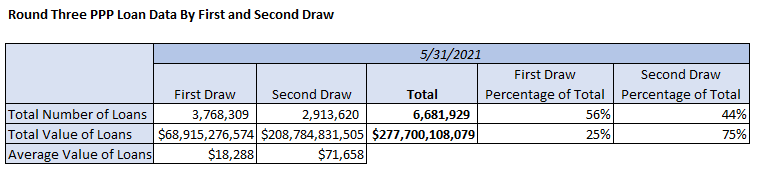
While first time applicants for PPP loans in Round Three make up 56 percent of all PPP loans by number, they represent only 24 percent of PPP loans disbursed by value, with the remainder of Round Three PPP loans by value going to small businesses obtaining their second PPP loan. These individual second draw loans are also in the region of four times larger than Round Three first draw PPP loans by average value of loan.
State-Specific Data
All reports issued by the SBA on the PPP to date have included state-specific data on number and value of PPP loans. Provided below are the total number of loans and total value of loans provided to the top five state recipients of PPP support. These data together also produce the average value of a state PPP loan.
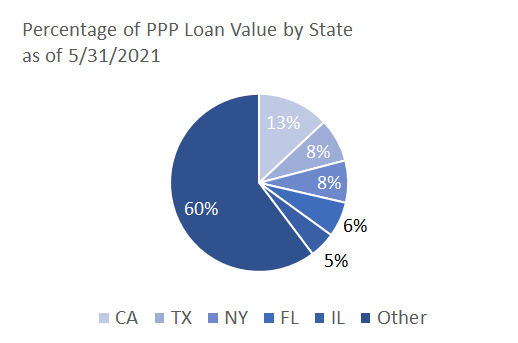

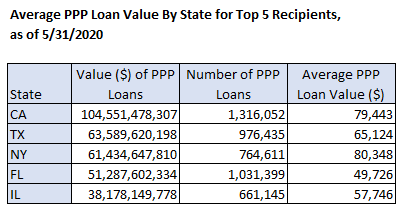
These (cumulative) state-specific average PPP loan values can be contrasted with the (cumulative) national average PPP loan value, which as of 5/31/2021 is $64,647.
Recipient by Industry Data
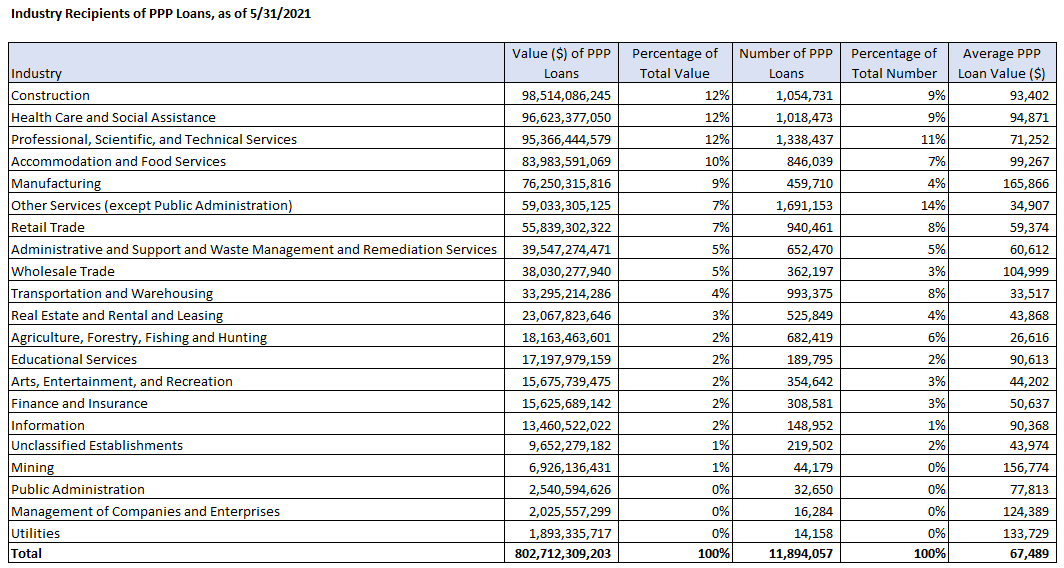
Please note that cumulative PPP total loan number and loan values do not match totals provided by the SBA per the latest Round Three report. This can only be due to data adjustments made by the SBA after the 8/8 SBA PPP report, the final data report of Round Two, but that adjusted figures have not since been made available to the public.
Lender and Loan Size Data
Where for Rounds One and Two the SBA presented lender size by total assets (presented below cumulatively as of 8/8/2020), for Round Three the SBA has provided a breakdown of lender by type.
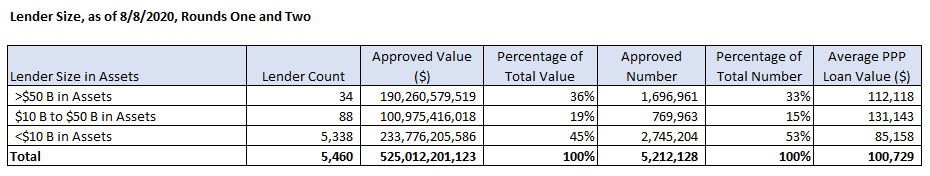
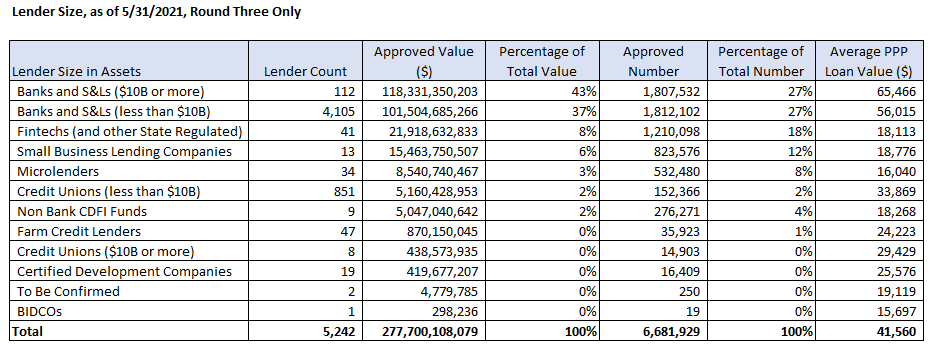
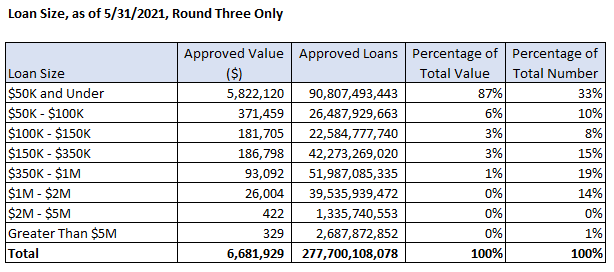
As of 5/31/2021, and for Round Three loans only, loans under $50K represent 87 percent of total PPP loans, and 33 percent by value. Loans over $5m are less than 1 percent of total PPP loans and 1 percent of loan value.
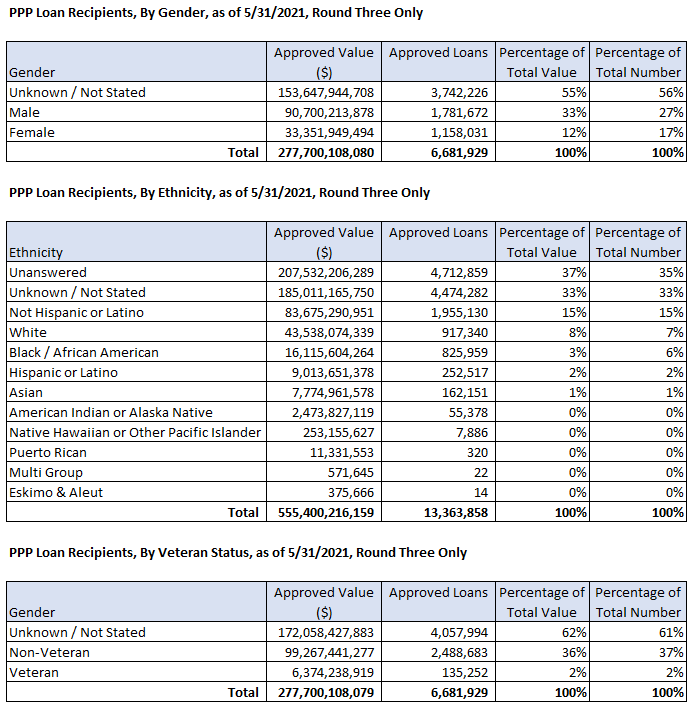
Demographic Data
For Round Three of the PPP the SBA is now reporting on PPP recipients by gender, ethnicity, and veteran status. This information is however not terribly useful given that it was not mandatory for applicants to provide this information and the vast majority did not.