Weekly Checkup
May 25, 2018
CBO Returns to the Individual Mandate Fray
On Wednesday, the Congressional Budget Office (CBO) released its 10-year outlook for health insurance-related federal subsidies, taxes, and coverage for people under the age of 65. One notable point is CBO’s latest answer to what has been a question central to the debate over the Affordable Care Act: “What does repealing the individual mandate actually do to enrollment?”
Relative to the September 2017 baseline, Wednesday’s report projects an increase of 3 million in the uninsured population in 2019 and 5 million by 2027—an estimate that is much lower than it has been in the past. For comparison, a year ago Congress was in the midst of a legislative battle over the American Health Care Act (AHCA). In what would have been the AHCA’s first year of implementation, CBO projected a 14 million increase in the uninsured population, resulting mainly from the repeal of the individual mandate.
How does a policy change that leads to 14 million more uninsured in a score from last year lead to only 3 million more uninsured in a baseline this year? A discerning eye could see last year that the effect of the individual mandate repeal in the AHCA was inflated for several reasons. First, CBO was forced to score the bill on an outdated baseline. Furthermore, CBO’s underlying assumptions about the effectiveness of the individual mandate were outdated and overstated. CBO recognized this flaw and late last year revised their assumptions about what effect the mandate actually had on the marketplace.
To be clear, CBO estimates that the isolated effects of the mandate repeal alone are greater than the bottom-line number that appears in this year’s baseline. CBO states that mandate repeal lowered its enrollment projections by an average of 8 million per year across all programs (which is still significantly less than 14 million). But economic factors along with the administration’s regulations on Short-Term, Limited Duration Insurance plans and Association Health Plans offset some of the mandate repeal’s estimated effects, which led to uninsured increases of 3 and 4 million rather than 8 million.
Why does this shift matter? While CBO is a first-rate organization, its staff are not omniscient. Predictions of the future are heavily dependent on assumptions about the present, and when those assumptions are off, the resulting predictions are off. CBO’s recent revision of their individual mandate assumptions and the resulting baseline serve as a reminder of this fact.
Chart Review
Tara O’Neill Hayes, Deputy Director of Health Care Policy
The Affordable Care Act slowed the growth rate of the Medicare Part D catastrophic coverage threshold from 2014 to 2019. As a result, fewer expenditures occurred in the coverage gap, and costs were reduced for drug manufacturers, beneficiaries, and the Part D plan sponsors. Instead, these costs were pushed to the catastrophic coverage phase, where the government covers 80 percent of the costs. In 2020, when the threshold will rise in line with beneficiary costs, the growth in the costs to the federal government will slow.
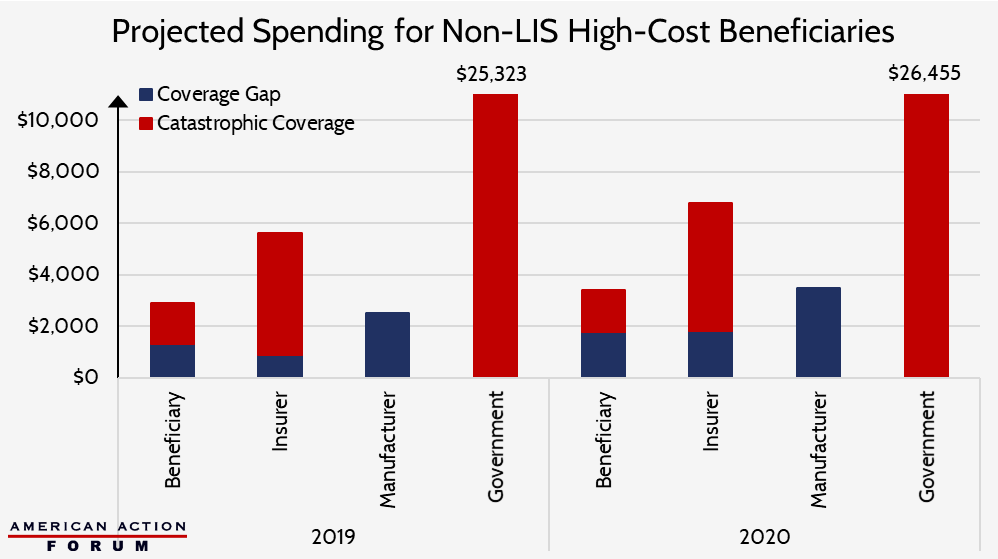
– Chart from The Impact of Raising the Threshold for Medicare Part D Catastrophic Coverage
From Team Health
The Art Of The Drug Deal
Tara O’Neill Hayes explains the problems inherent in the federal government negotiating drug prices directly.
Worth a Look
Axios: The challenges of “right to try”
New York Times: New Ebola Tactics Raise Hope but May Sow Confusion