Weekly Checkup
August 27, 2021
FDA Approval Won’t Change the Vaccine Wars
On Tuesday, the Food & Drug Administration (FDA) fully approved the Pfizer COVID-19 vaccine, lifting the shot out of Emergency Use Authorization (EUA) status and into the coveted realm of full certification. And, to hear the pundits, this approval is not a moment too soon! Vaccination rates are leveling off, with 71.3 percent of the total population over age 12 having at least one dose and 60.5 percent of that population fully vaccinated—a total that has been only inching upward since mid-summer. With the vaccine now fully approved, the Pentagon is requiring COVID-19 vaccinations for all military personnel (800,000 of whom are currently estimated to be unvaccinated) and private companies such as Delta Airlines and a host of others are either requiring employees to be vaccinated or instituting some negative incentives (such as the $200 monthly surcharge that Delta is placing on unvaccinated employees) for unvaccinated employees. A large volume of data shows the vaccines are safe and effective at lowering the risk of infection, lowering the risk of transmission (the Delta variant may change this), and preventing hospitalization and death, yet many are still resisting calls to get vaccinated.
Will full approval change this reluctance? Many hope so, but I doubt it.
Kaiser Family Foundation (KFF) polling in July noted that among all adults, 10 percent of those surveyed fell into the “wait and see” category, while 17 percent would either only get the shot if required (3 percent) or would “definitely not” get the shot (14 percent). A KFF poll in June found that 31 percent of unvaccinated adults are more likely to get the vaccine with full approval. Based on the KFF polling data, I estimate that just under 8.4 percent of all adults would be more likely (but not guaranteed) to get the shot. If we’re being super optimistic and every single one of those adults gets a shot (highly unlikely), that would bring the total to almost 80 percent of U.S. residents over the age of 12 with a vaccine.
I am not optimistic that FDA approval will change the needle at all. First, it’s not clear what more the “wait and see” category are waiting to see at this point. The vaccines have all undergone rigorous clinical trials and have real-world data on millions of results for people of all ages, races, ethnicities, genders, and geographies. Unless you want to wait a decade for long-term data, there’s nothing else to see here.
Second, as the KFF polling above shows, vaccination status has become yet another aspect of the all-consuming “culture war.” For rural residents, 34 percent fall into either “wait and see” (11 percent), “only if required” (2 percent), or “definitely not” (21 percent). For White Evangelical Christians, 8 percent are “wait and see,” 1 percent are “only if required,” and 23 percent are “definitely not.” Take a look at any 2020 election map and it lines up pretty well with vaccination rates; Democrats are far more likely to be vaccinated than Republicans—which is weird for a vaccine developed with the full support of, and approval by, the Trump Administration.
Regardless of the reason, vaccines have become yet another signifier of tribe for many. Vaccines have shifted into the emotion-based arena of identity politics, making the issue intractable.
These voluntarily unvaccinated folks don’t want the shot, they aren’t getting the shot, and no level of government approval is changing that. It’s possible FDA approval will push our vaccination rate just over 80 percent, which would be great. But it’s a very big “if,” and in the areas with the lowest vaccination rates and the worst COVID-19 surges, FDA approval probably won’t change the reality of over-crowded hospitals and demoralized health care workers any time soon.
Chart Review: ICU Bed Utilization and Vaccination Rates
Jackson Hammond, Health Care Policy Analyst
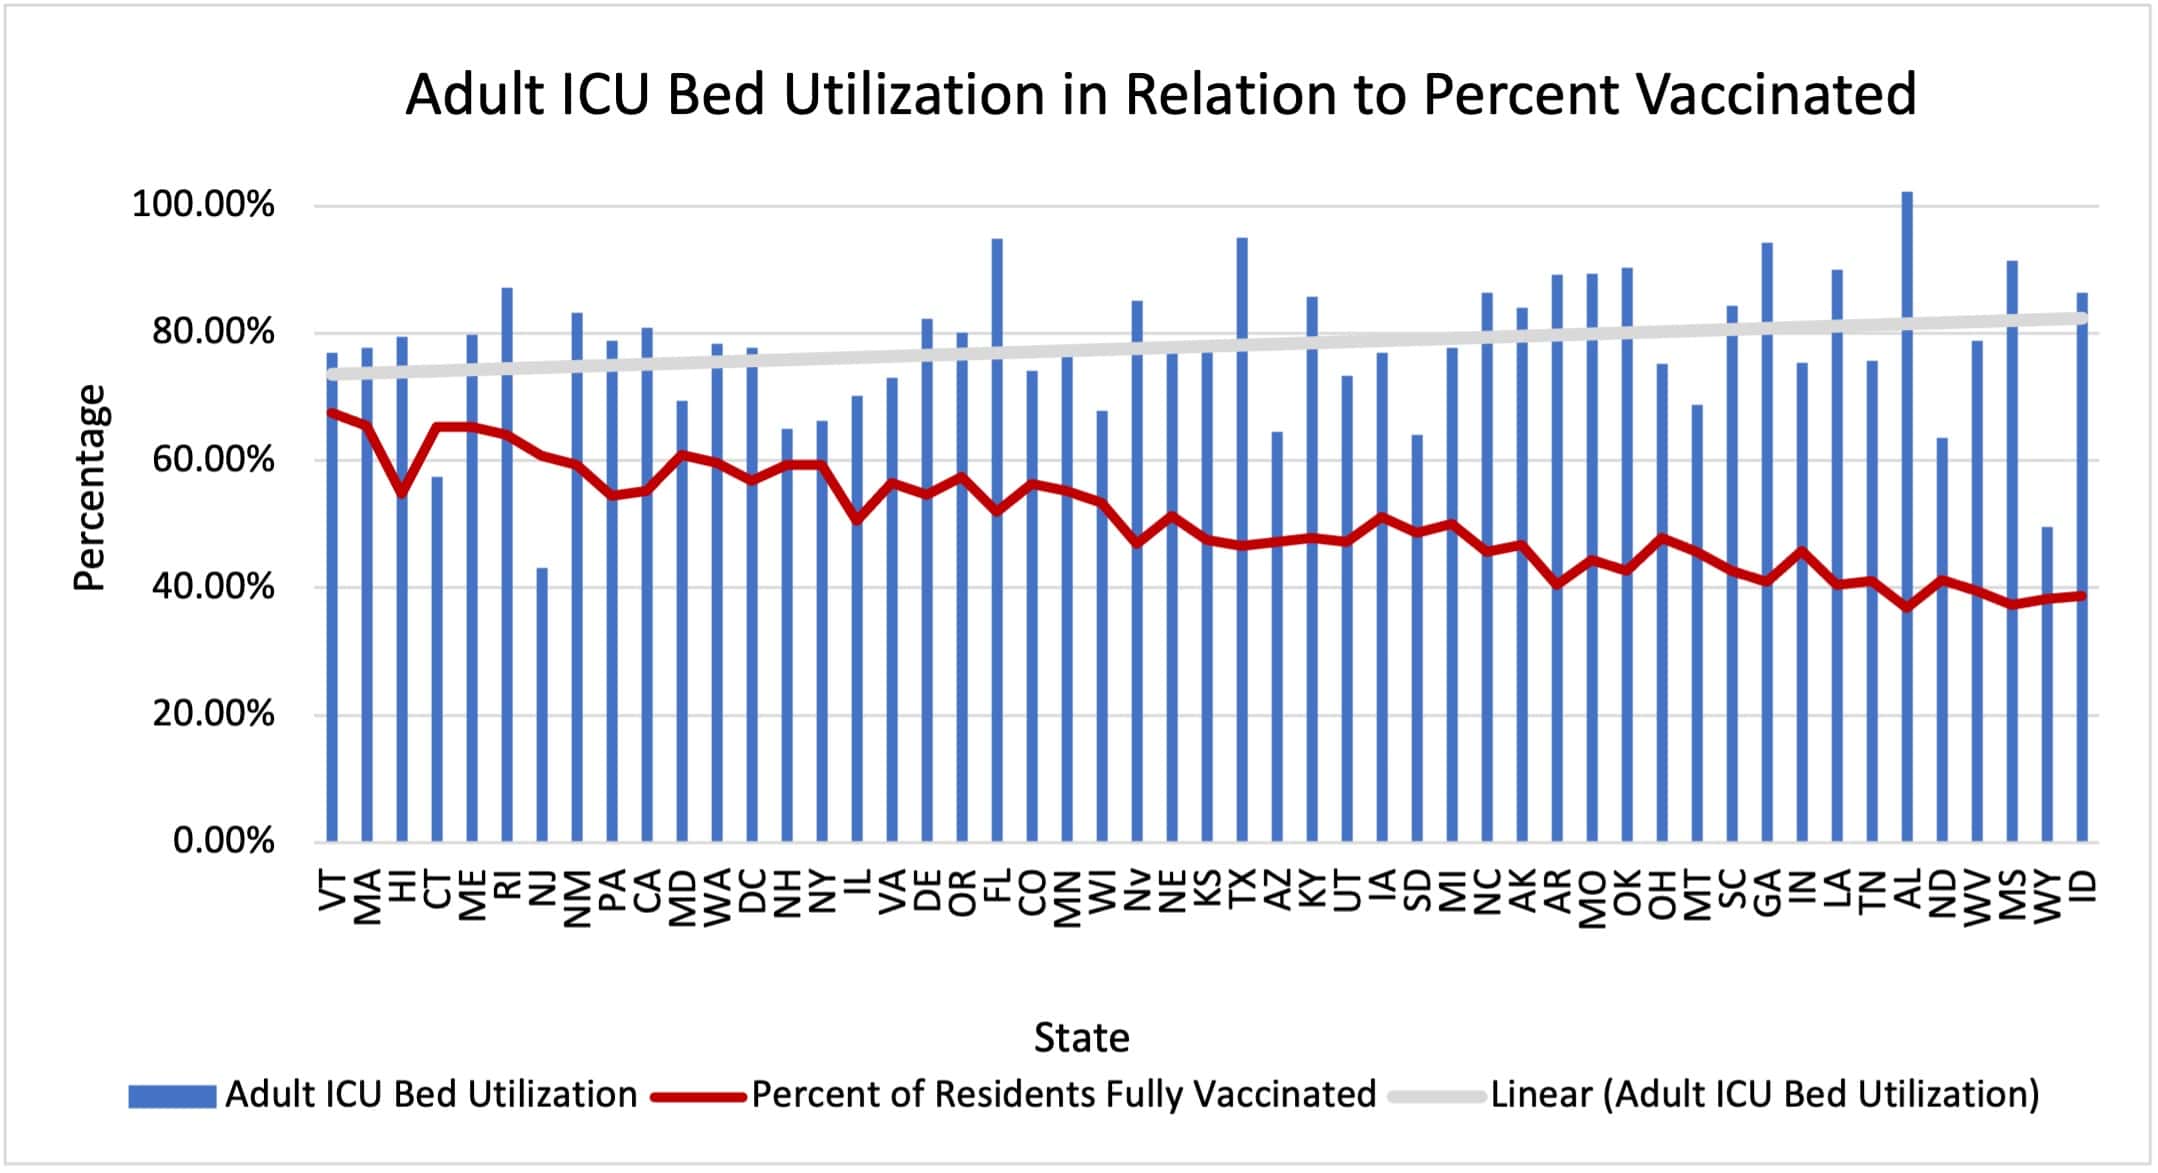
As COVID-19 cases have begun to surge again due to the Delta variant, primarily in communities with lower vaccination levels, Intensive Care Units (ICUs) have begun to fill up. Anecdotally, the country has seen reports of hospitals that are running out of space, and as this map by The New York Times showing localized data on ICU bed availability demonstrates, major shortages are concentrated in the Southeast. ICUs across the country were already closer to capacity than normal, as people returned to pre-pandemic levels of activity and thus pre-pandemic levels of injury, with additional stress added by procedures and treatment that had been put off since the spring of 2020. The chart below looks at adult ICU bed utilization compared to the percentage of a state’s population that is vaccinated. The grey line shows the trend line for adult ICU bed utilization. There is a clear, if not strong, correlation between vaccination rates and ICU bed availability, with a correlation coefficient of -0.328.
Sources: U.S. Department of Health and Human Services, Mayo Clinic
Tracking COVID-19 Cases and Vaccinations
Jackson Hammond, Health Care Policy Analyst
To track the progress in vaccinations, the Weekly Checkup will compile the most relevant statistics for the week, with the seven-day period ending on the Wednesday of each week
| Week Ending: | New COVID-19 Cases: 7-day average |
Newly Fully Vaccinated: 7-Day Average |
Daily Deaths: 7-Day Average |
| 25-Aug-21 | 142,006 | 255,775 | 864 |
| 18-Aug-21 | 138,087 | 297,680 | 778 |
| 11-Aug-21 | 121,673 | 239,296 | 678 |
| 4-Aug-21 | 99,978 | 212,064 | 500 |
| 28-Jul-21 | 70,633 | 205,268 | 359 |
| 21-Jul-21 | 45,034 | 223,748 | 273 |
| 14-Jul-21 | 29,408 | 245,826 | 232 |
| 7-Jul-21 | 16,619 | 242,229 | 193 |
| 30-Jun-21 | 13,935 | 322,077 | 232 |
| 23-Jun-21 | 11,947 | 408,027 | 250 |
| 16-Jun-21 | 12,411 | 628,783 | 292 |
| 9-Jun-21 | 15,335 | 733,024 | 356 |
| 2-Jun-21 | 15,001 | 525,699 | 388 |
| 26-May-21 | 22,276 | 824,973 | 444 |
| 19-May-21 | 27,936 | 1,067,946 | 520 |
| 12-May-21 | 34,872 | 1,280,156 | 556 |
| 5-May-21 | 45,435 | 1,477,500 | 587 |
| 28-Apr-21 | 52,058 | 1,512,182 | 618 |
| 21-Apr-21 | 61,133 | 1,532,800 | 628 |
| 14-Apr-21 | 68,638 | 1,787,504 | 645 |
| 7-Apr-21 | 64,694 | 1,613,063 | 617 |
| 31-Mar-21 | 64,353 | 1,397,332 | 700 |
| 24-Mar-21 | 57,212 | 983,302 | 737 |
| 17-Mar-21 | 53,580 | 1,039,381 | 859 |
| 10-Mar-21 | 54,201 | 970,895 | 1,121 |
| 3-Mar-21 | 60,997 | 929,817 | 1,357 |
| 24-Feb-21 | 64,999 | 855,709 | 1,728 |
| 17-Feb-21 | 73,825 | 753,586 | 1,910 |
| 10-Feb-21 | 100,550 | 711,775 | 2,359 |
| 3-Feb-21 | 129,511 | 490,947 | 2,719 |
| 27-Jan-21 | 159,909 | 340,398 | 3,173 |
Sources: Centers for Disease Control and Prevention Trends in COVID-19 Cases and Deaths in the US, and Trends in COVID-19 Vaccinations in the US.
Note: The U.S. population is 332,670,912.
Worth a Look
Fierce Healthcare: Cigna to expand ACA exchange footprint to 3 new states, 93 counties
Washington Post: Investigation of 2016 asthma child trial raises questions about placebos and treatment when control groups are used