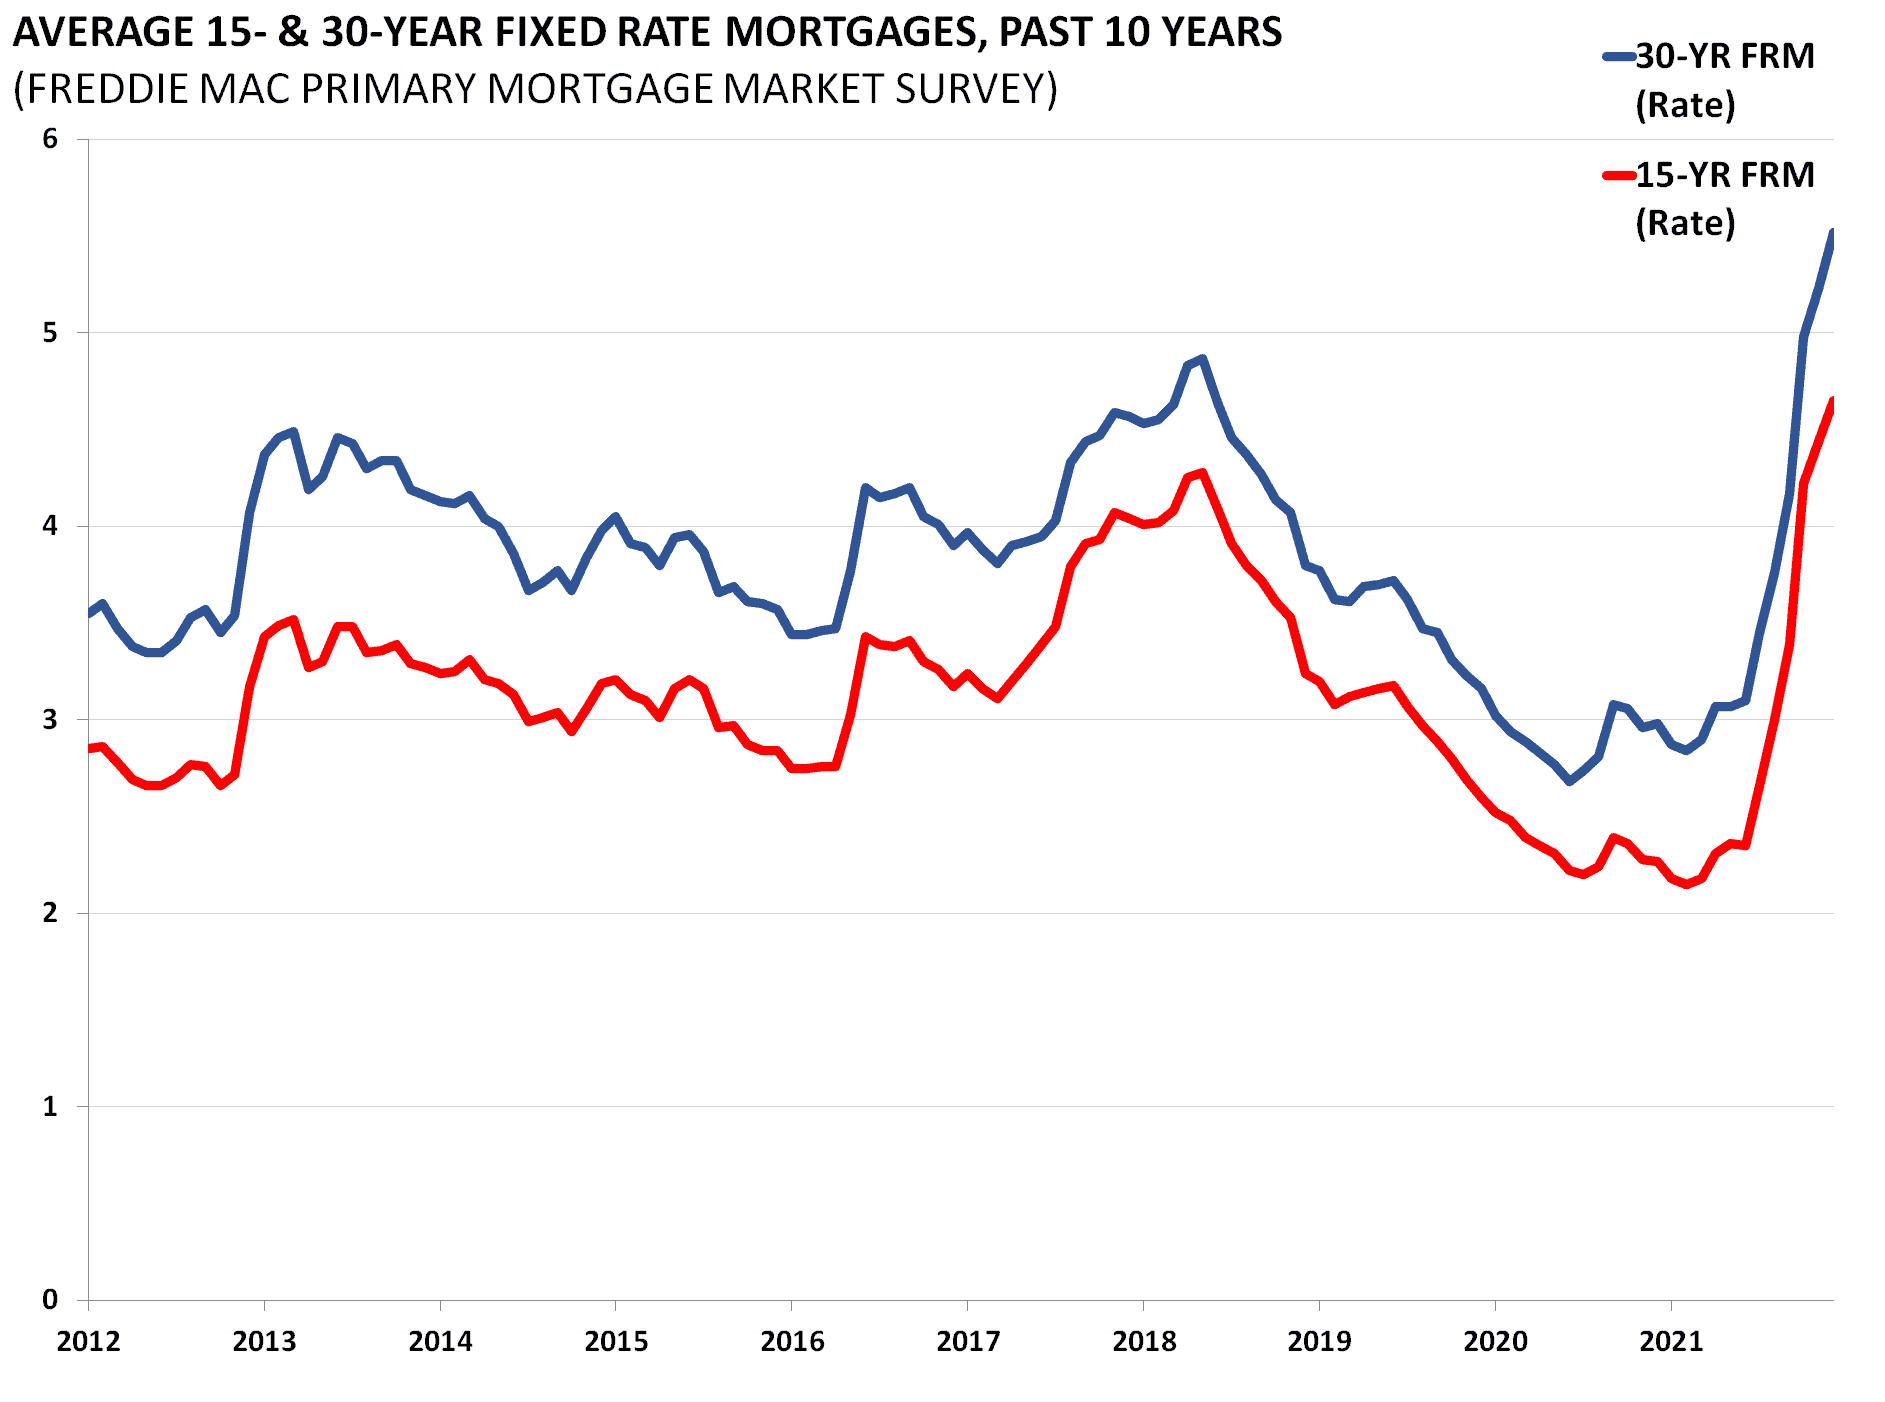
Average 15- and 30-Year Fixed Rate Mortgages
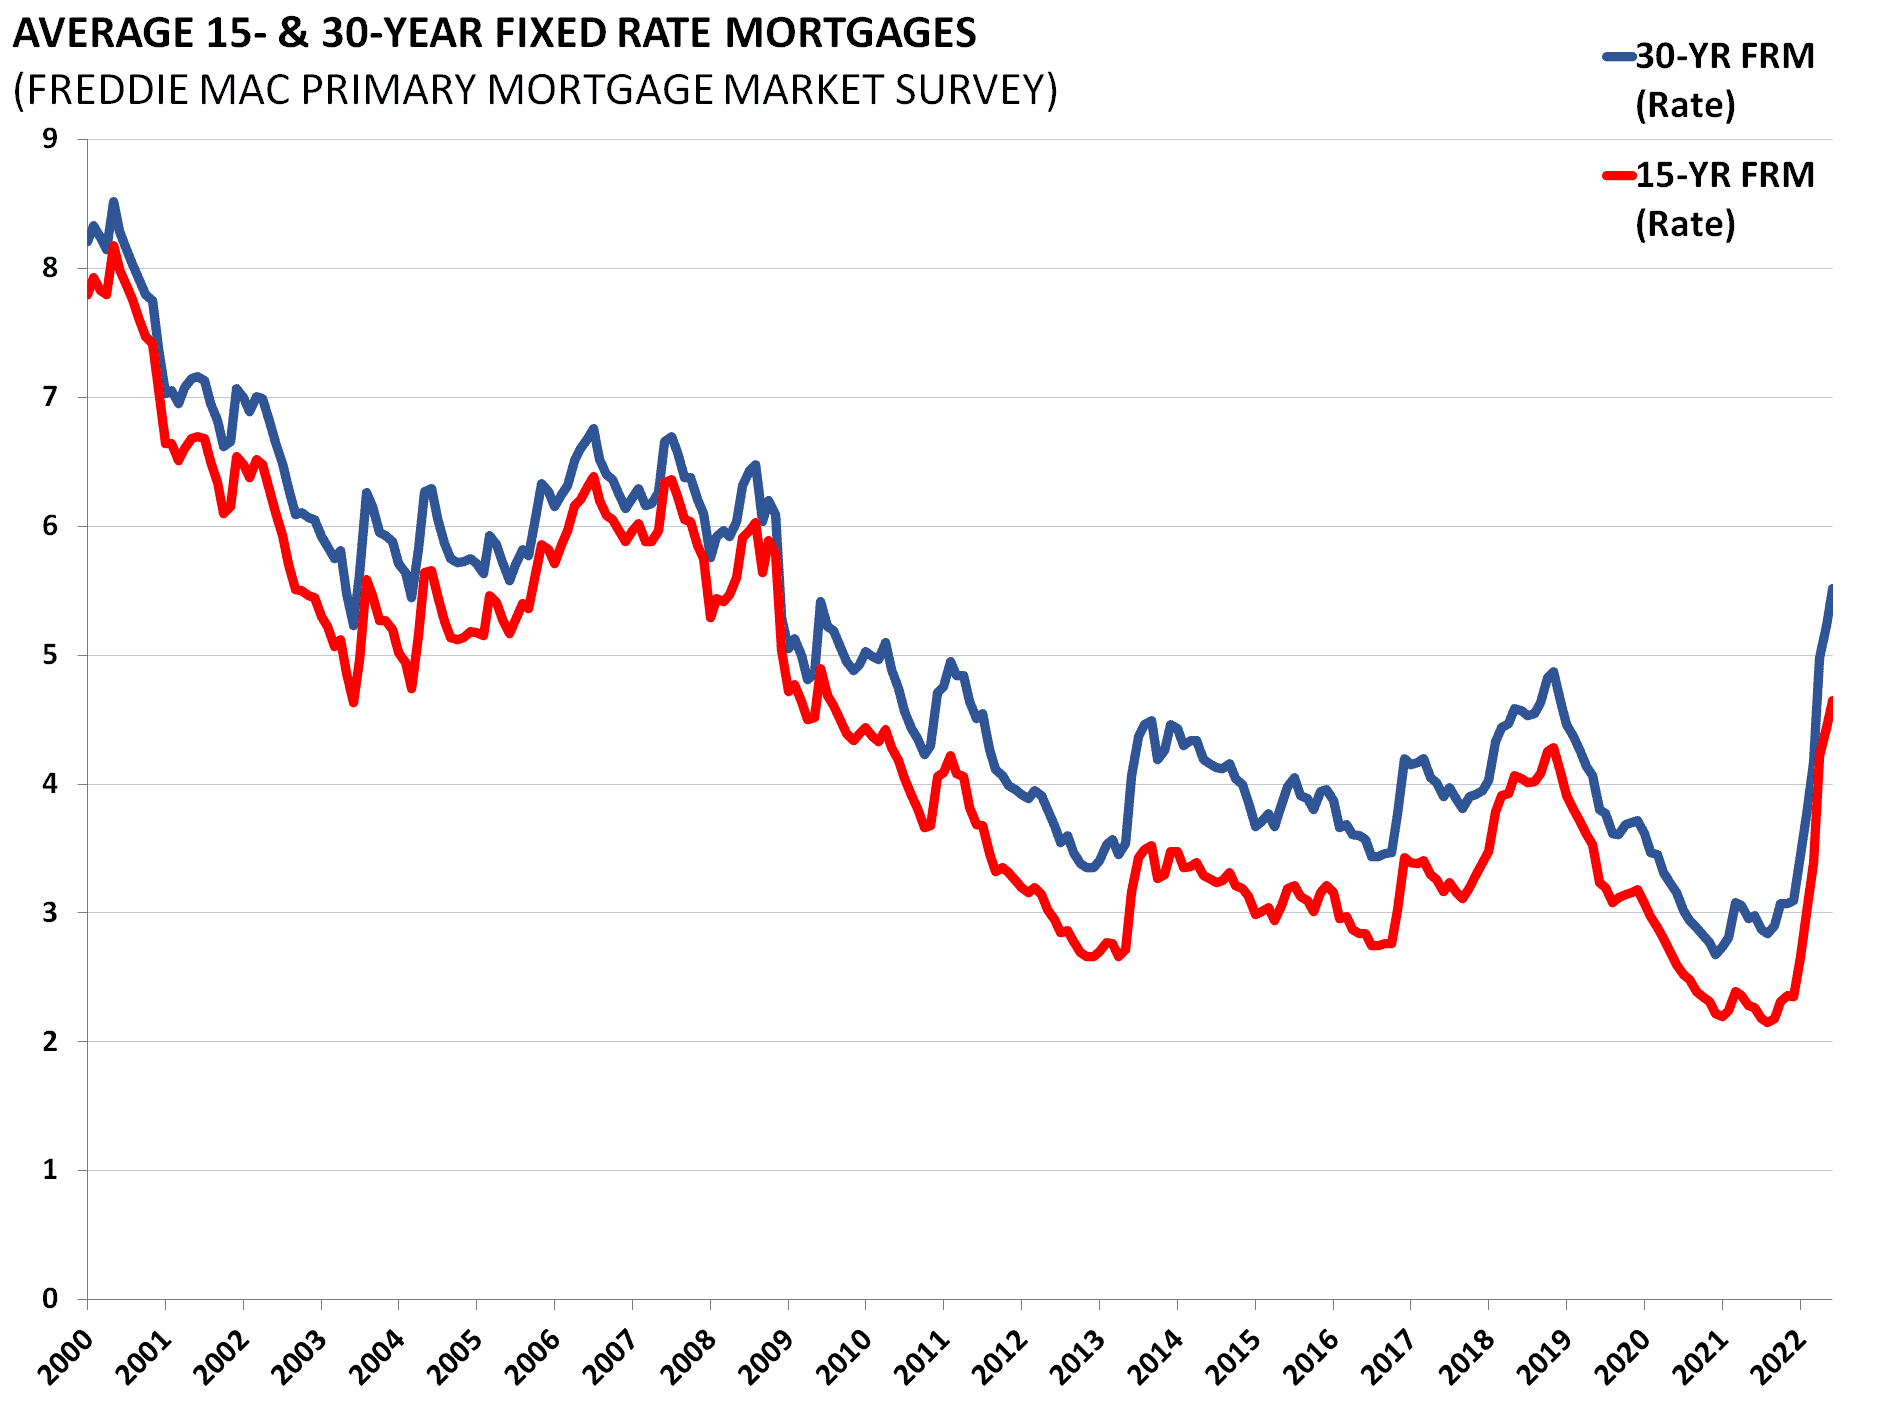
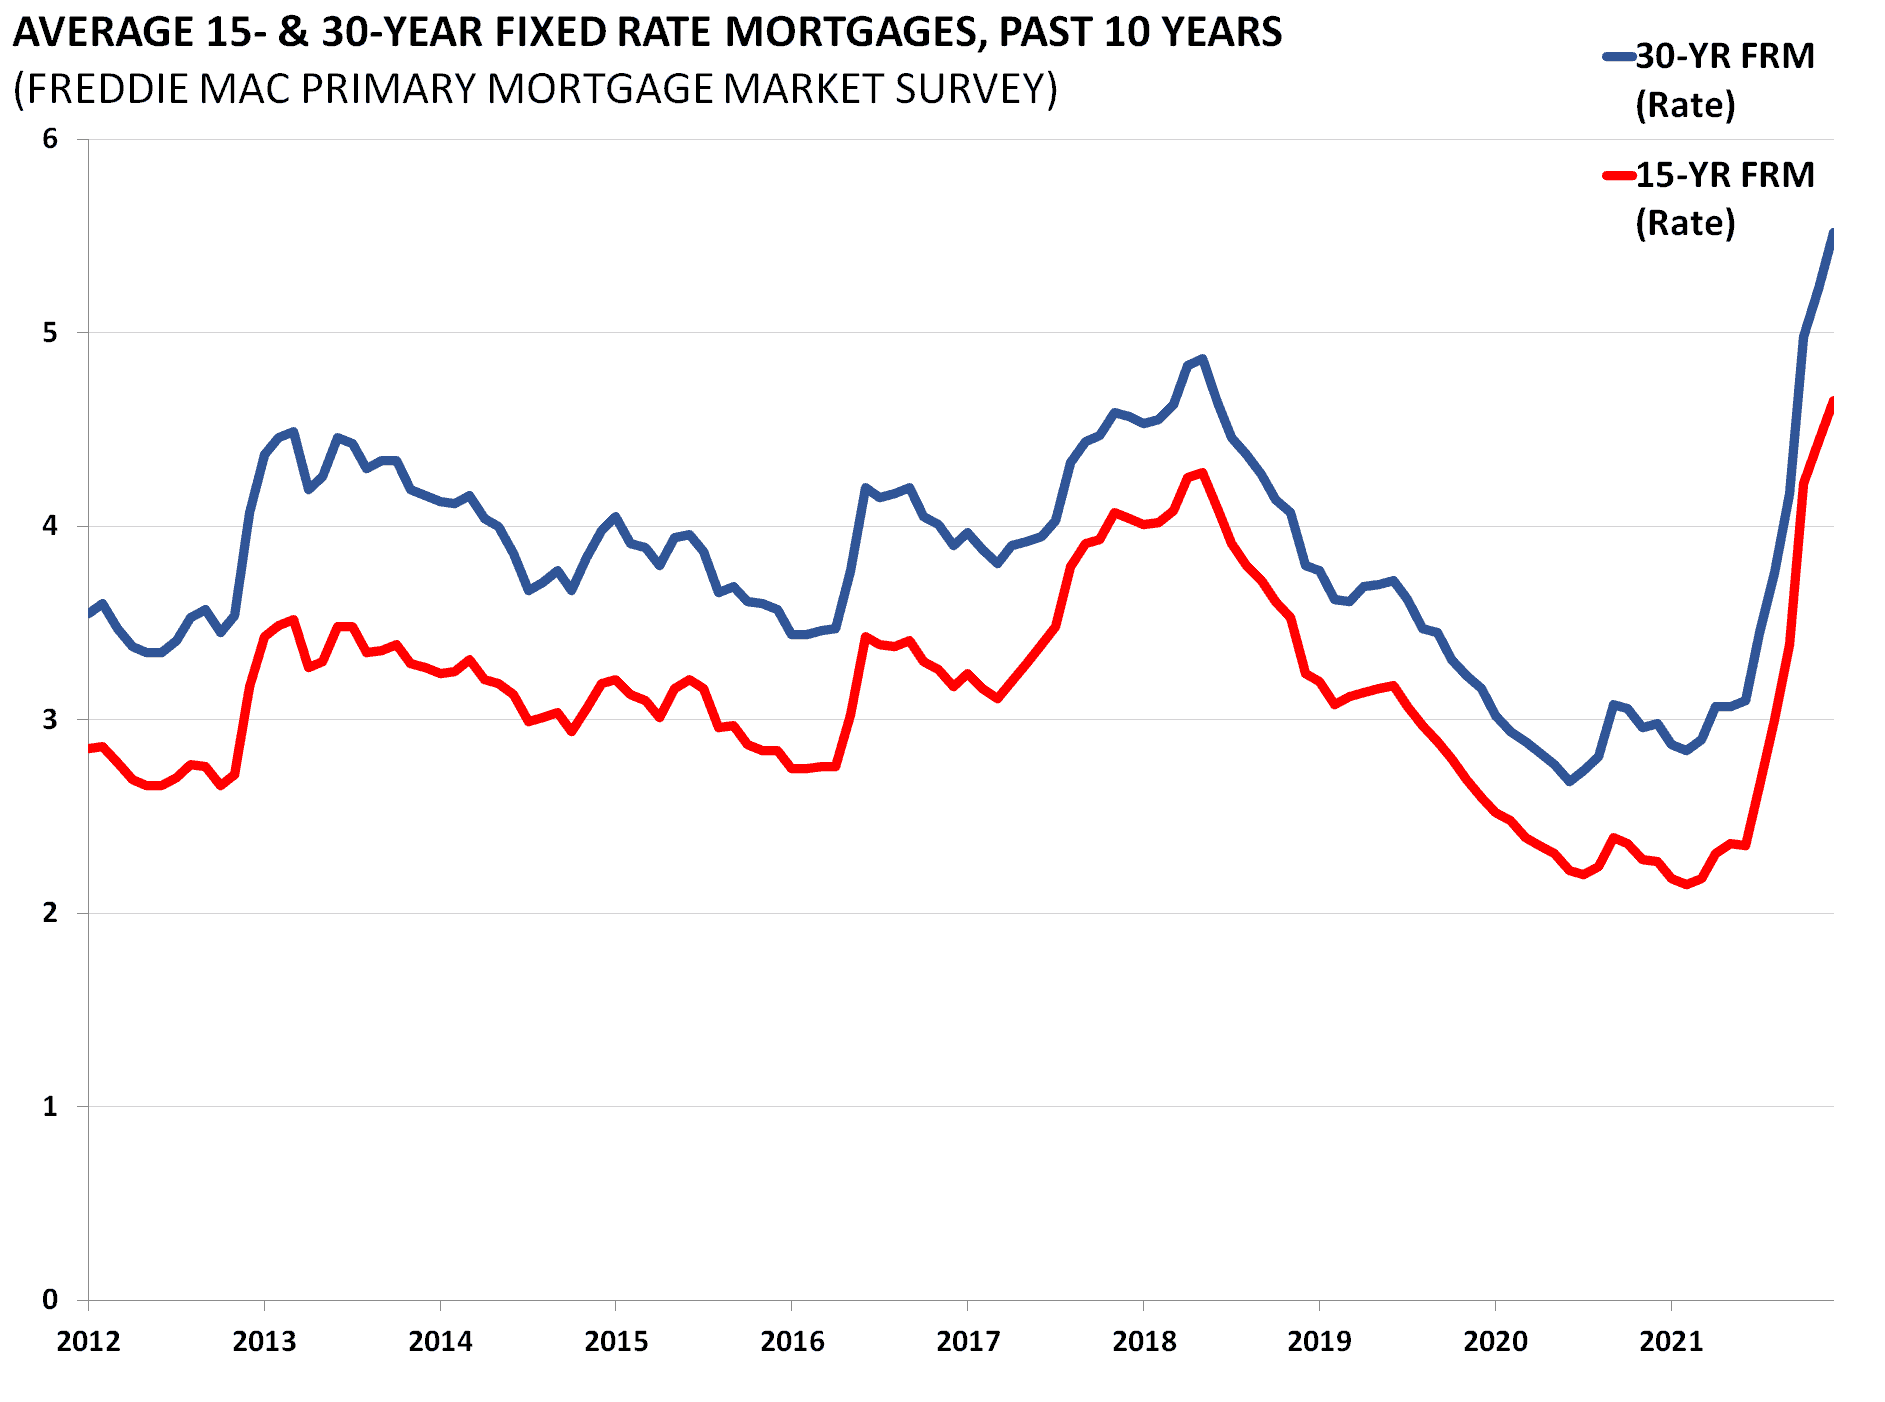
The Freddie Mac Weekly Primary Mortgage Market Survey (PMMS) reports the average popular 30-year fixed-rate for mortgage products. It comes from a survey of lenders and is based on first-lien prime conventional conforming mortgages with a loan to value ratio of 80 percent. Current rates, near historic lows, will help aid the housing recovery by incentivizing buying.
Permits and Starts
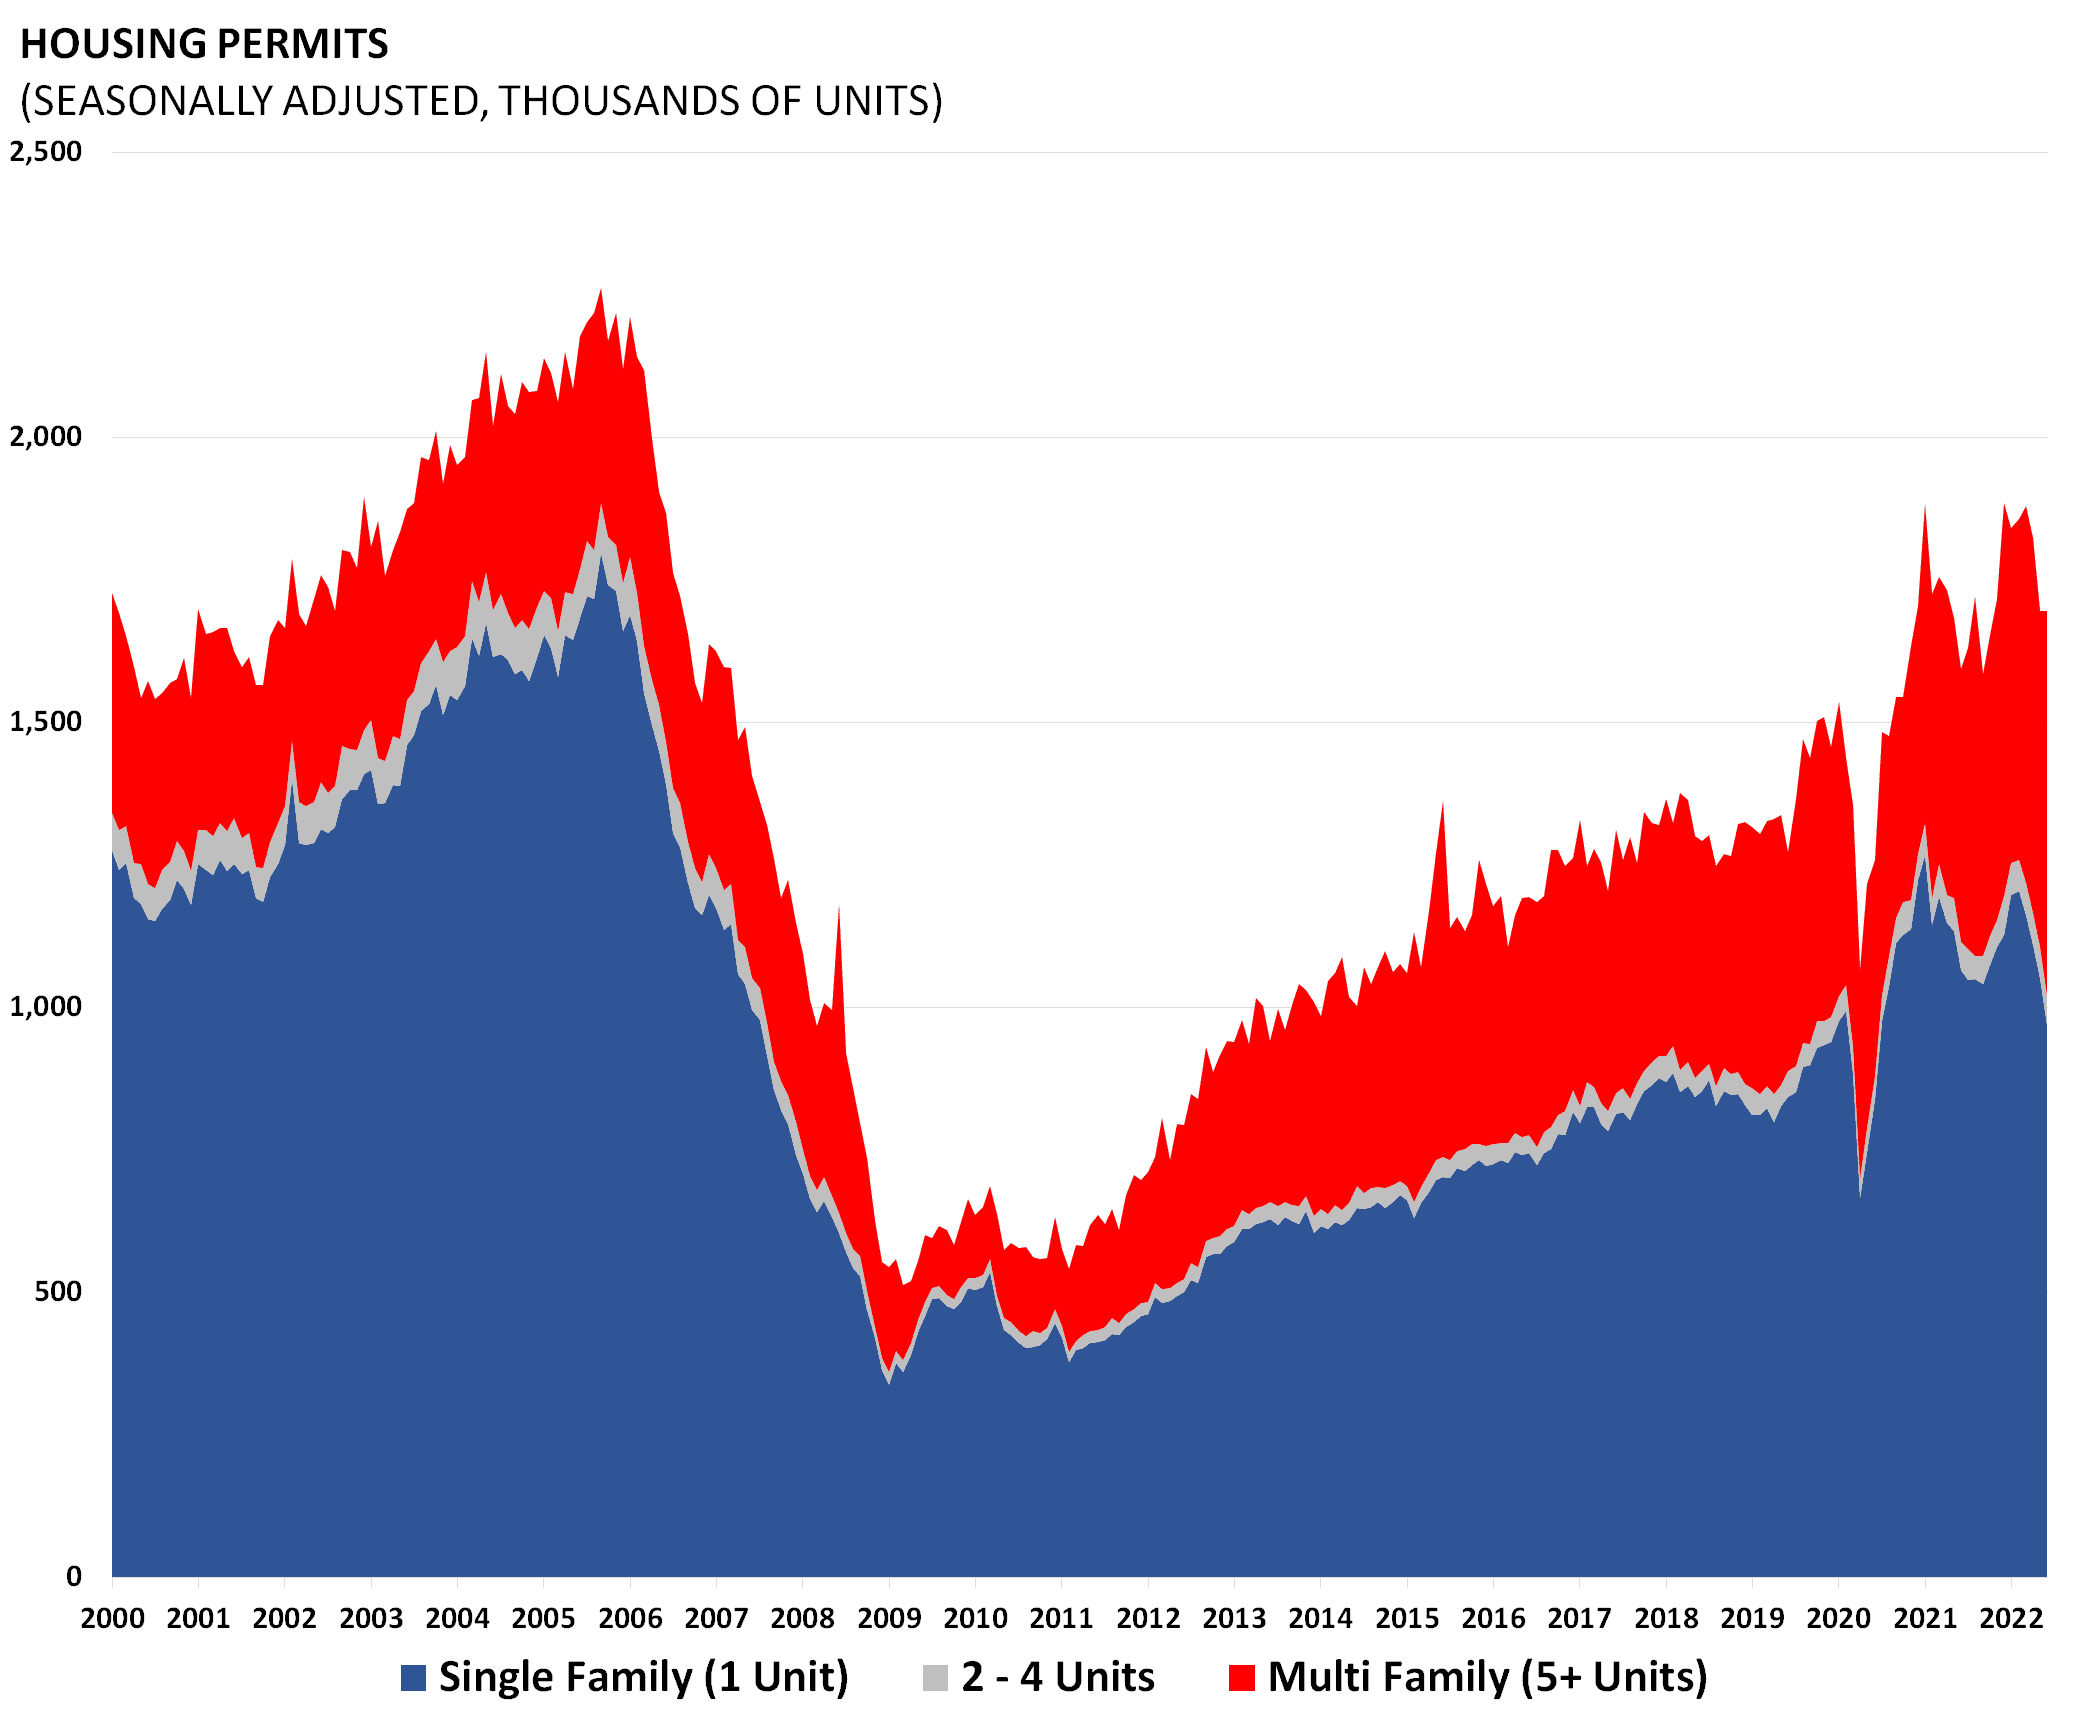
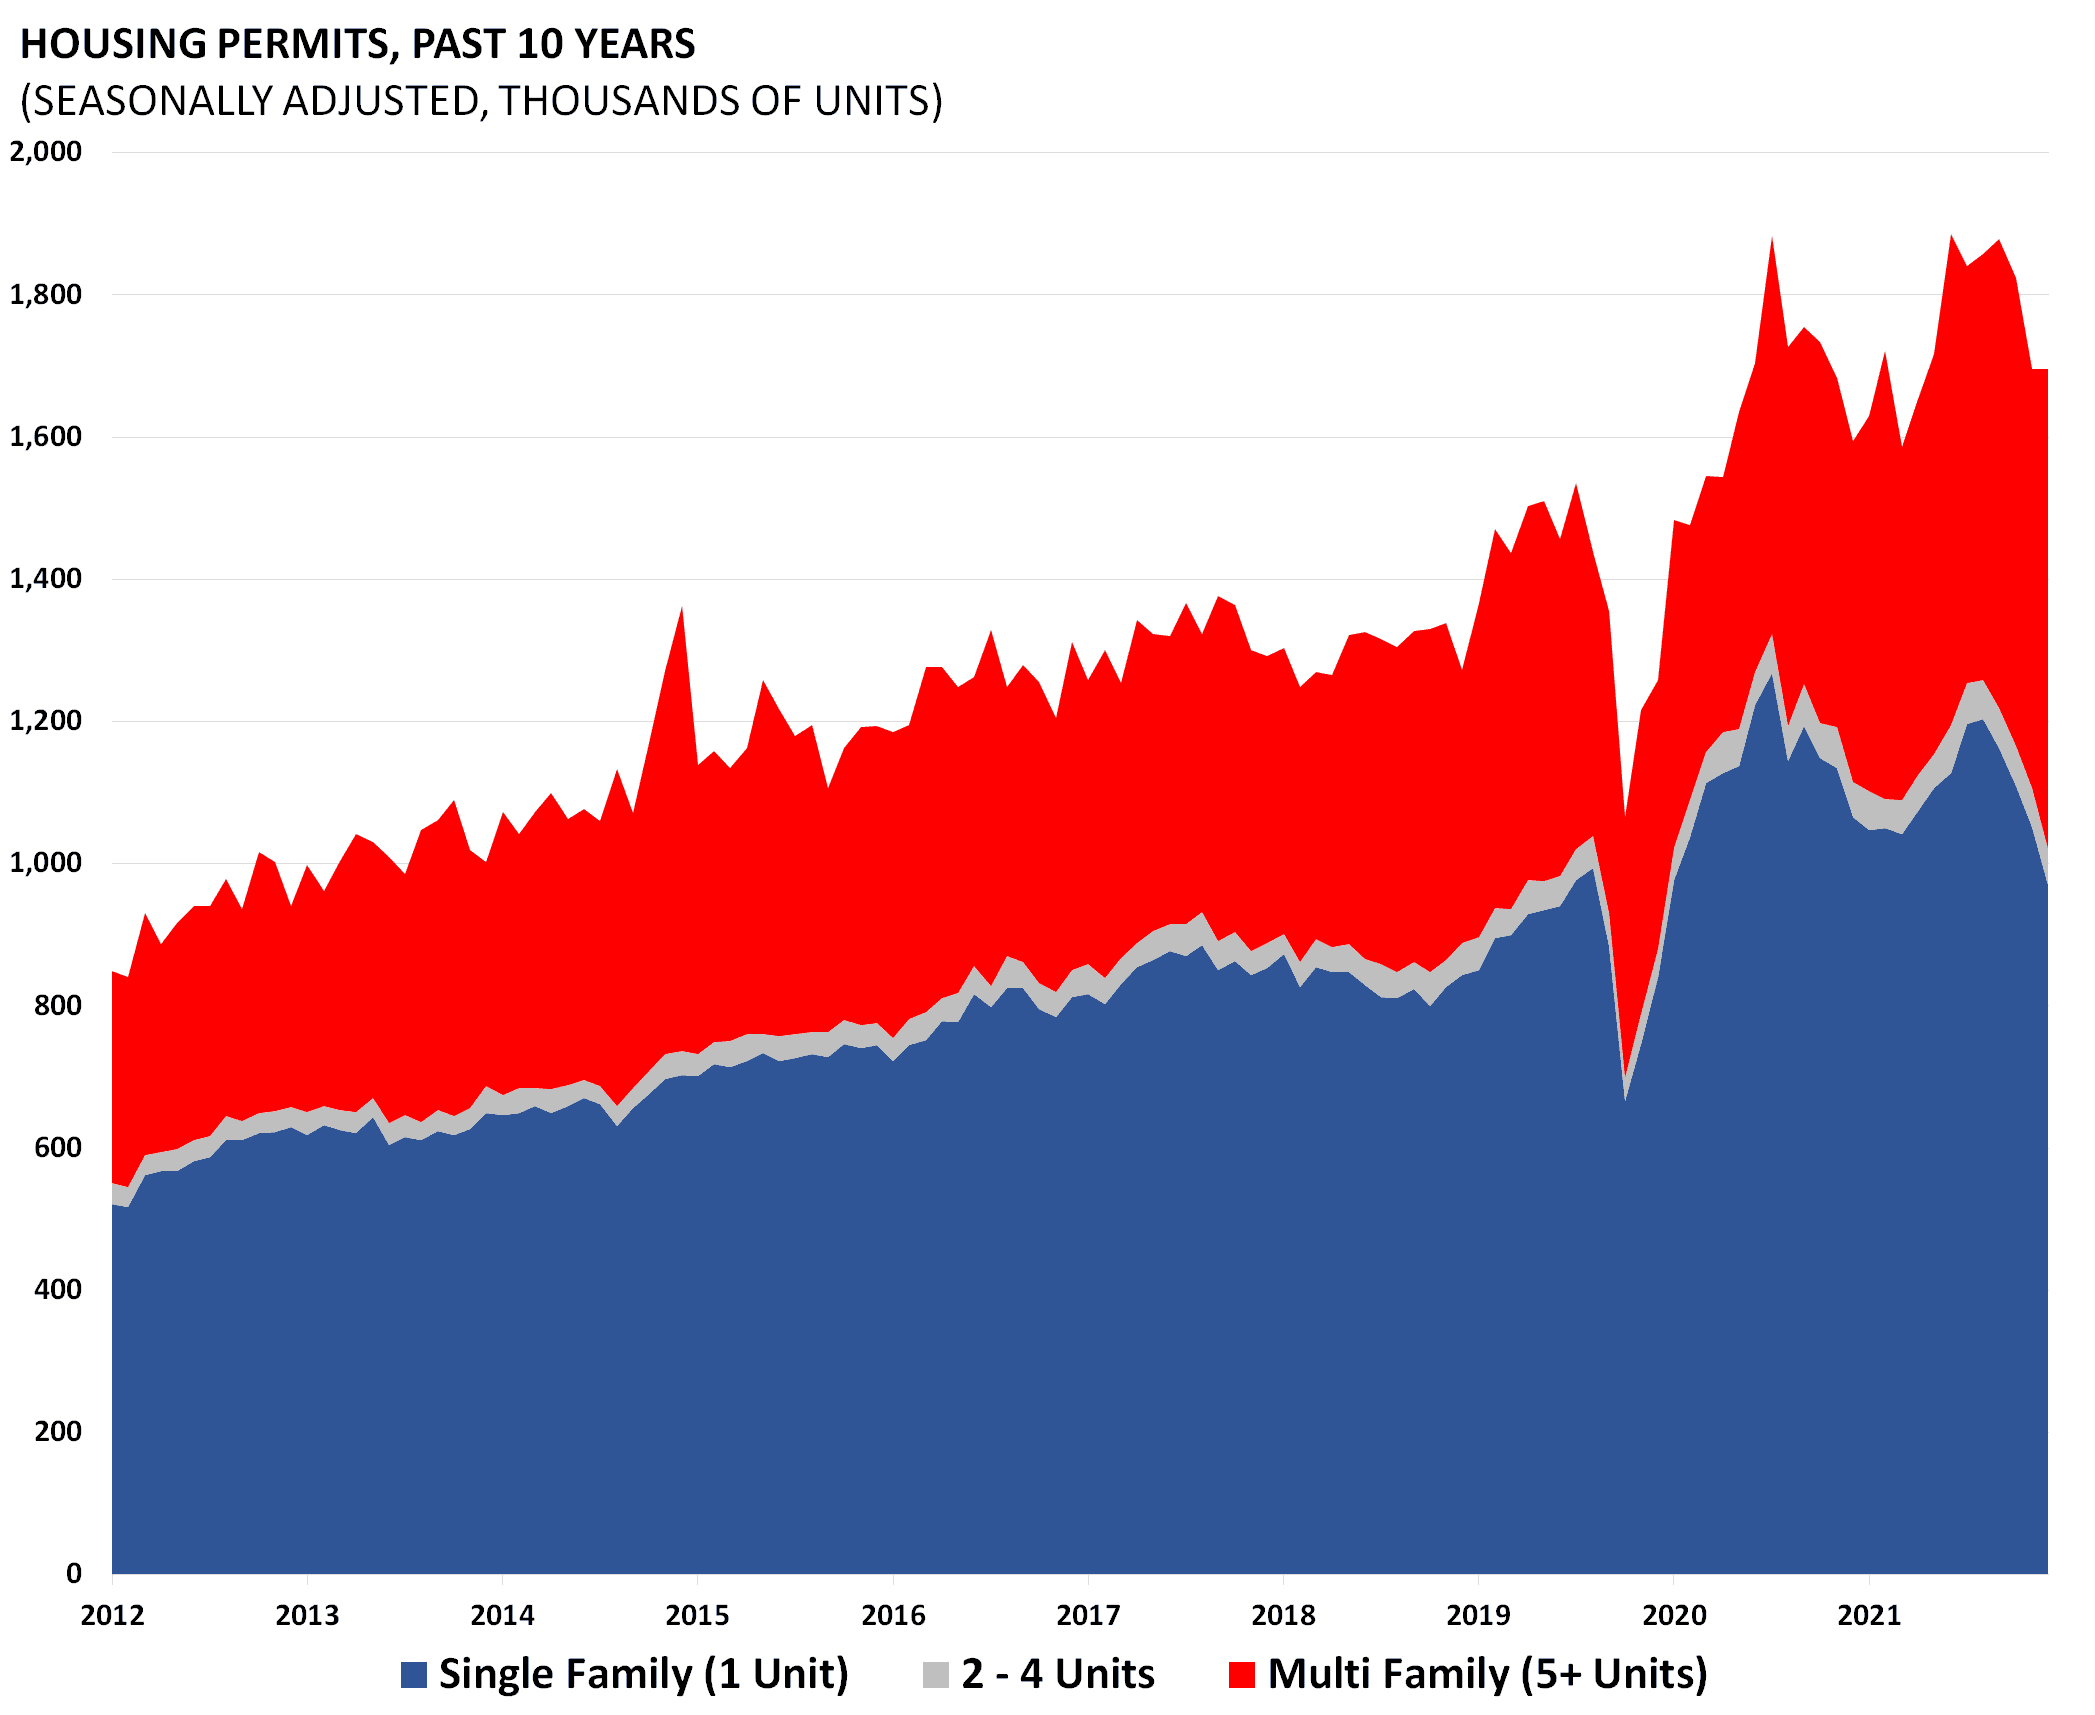
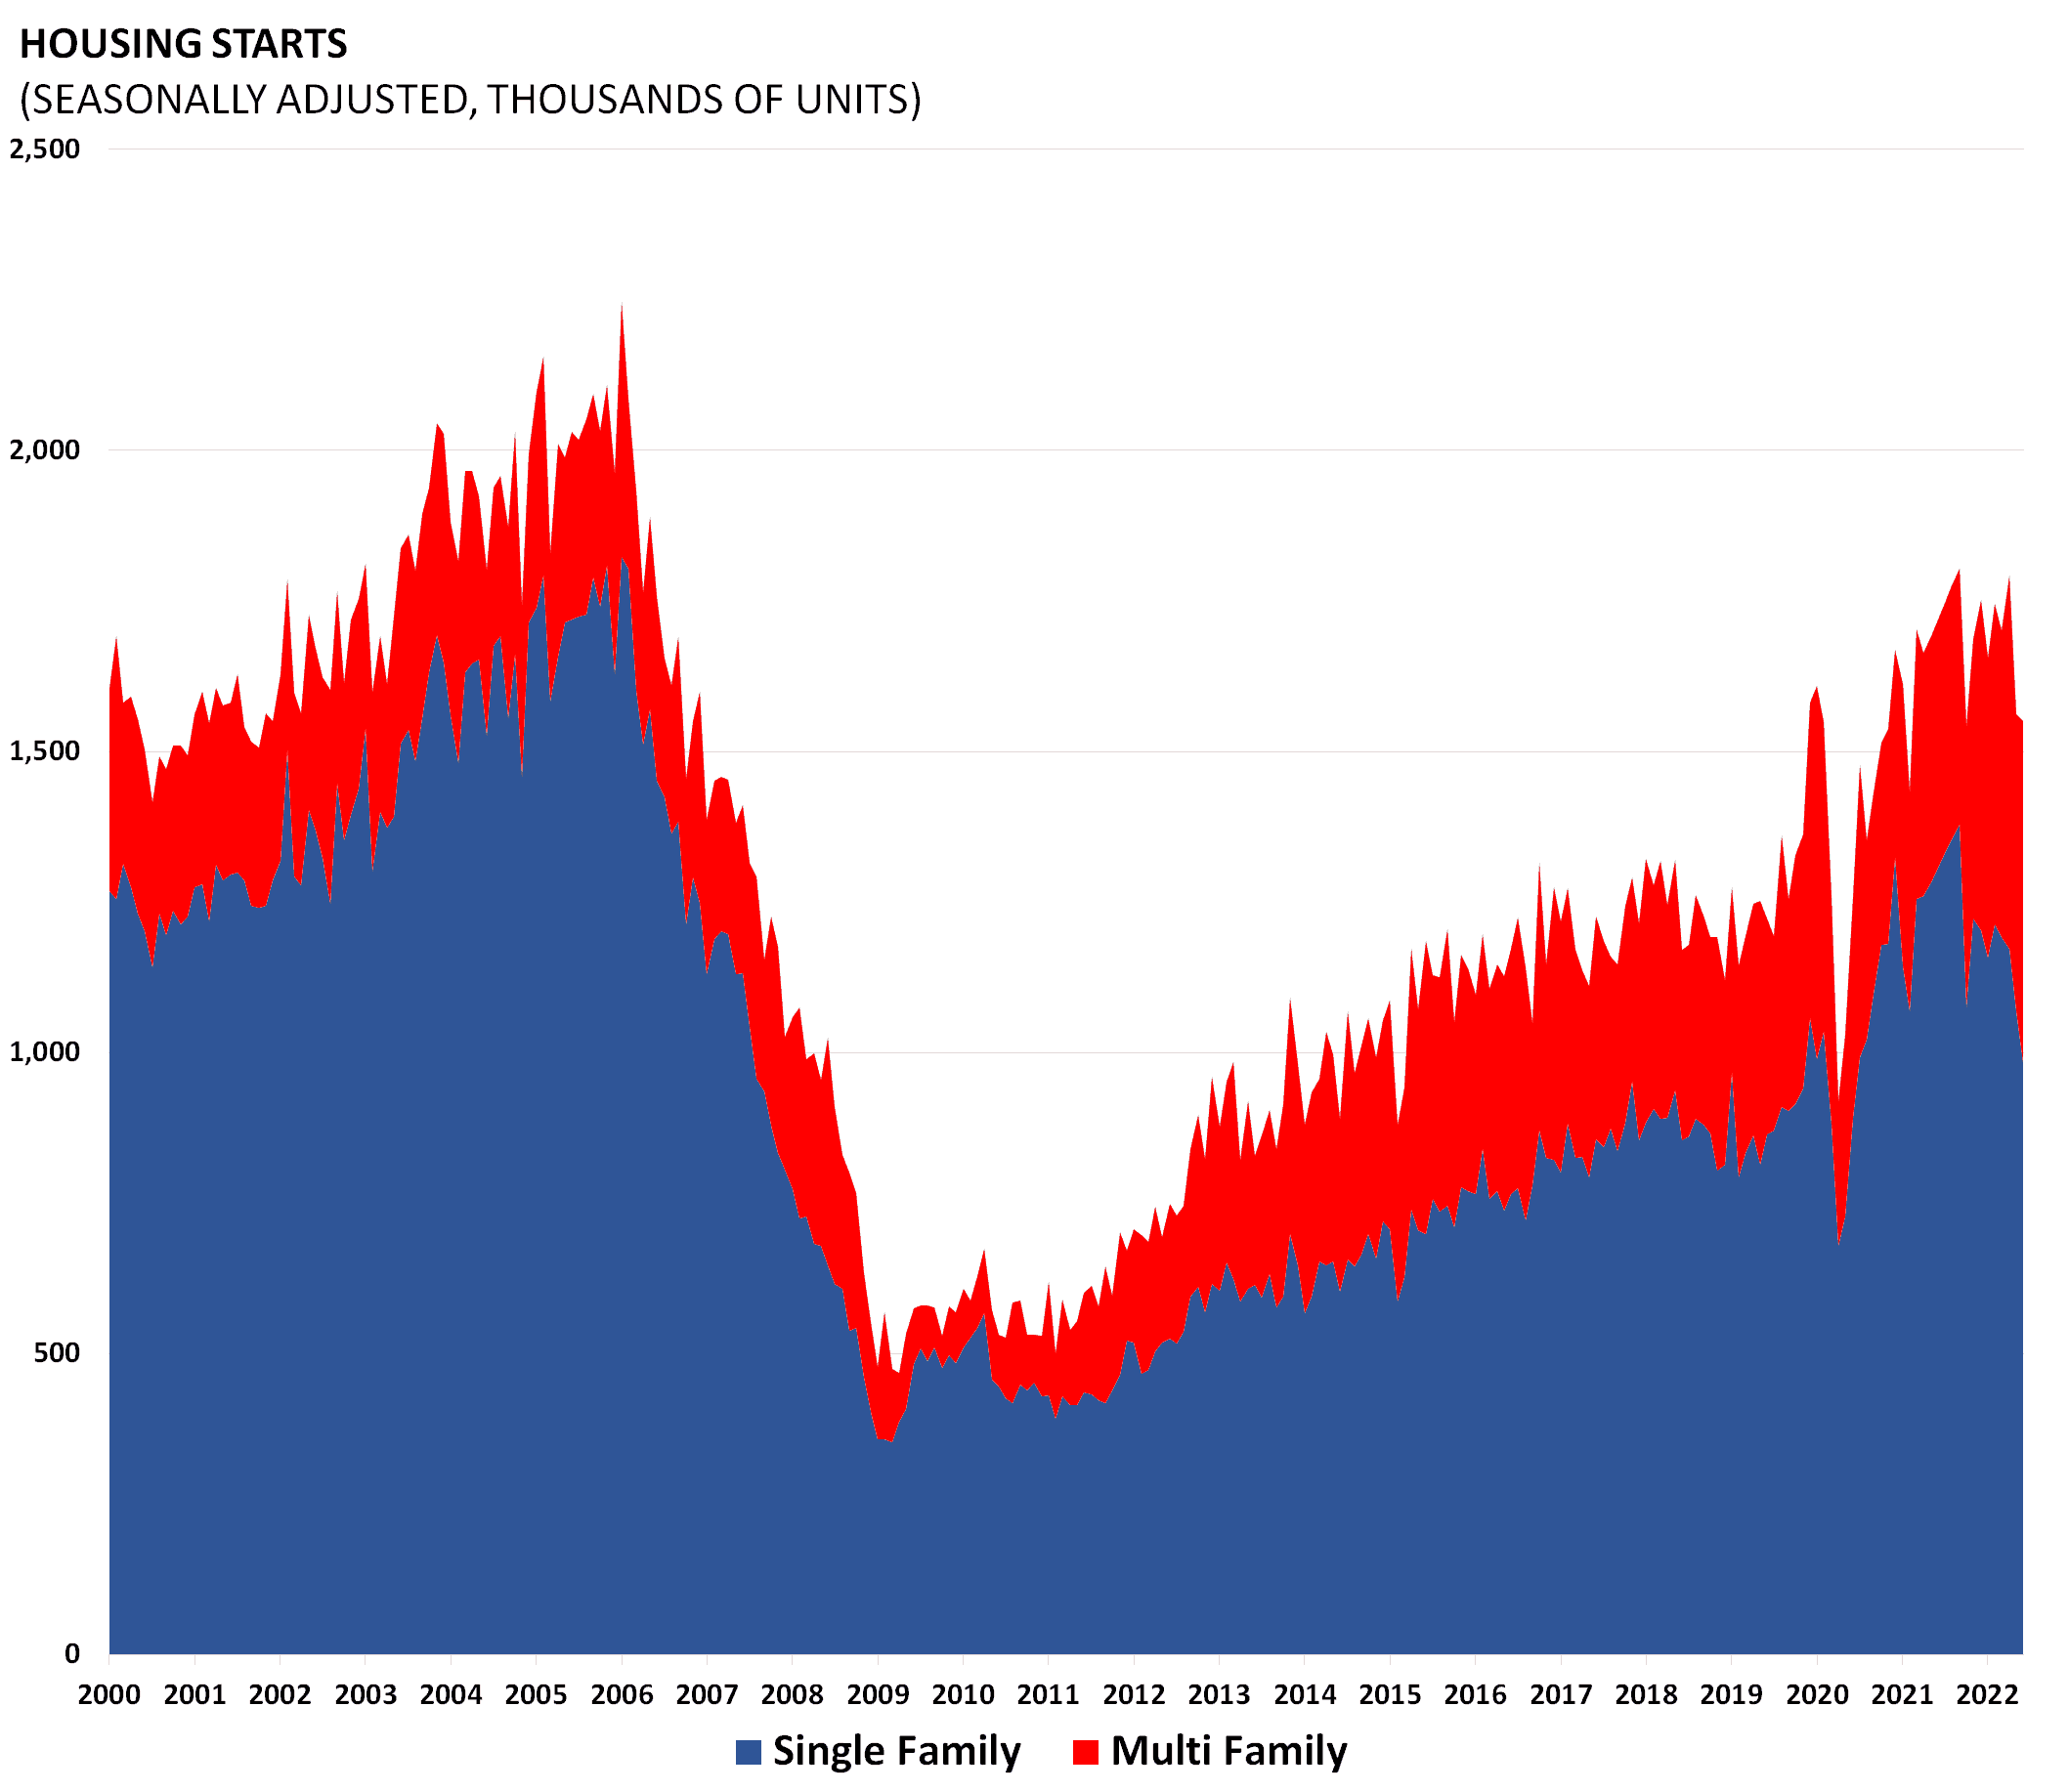
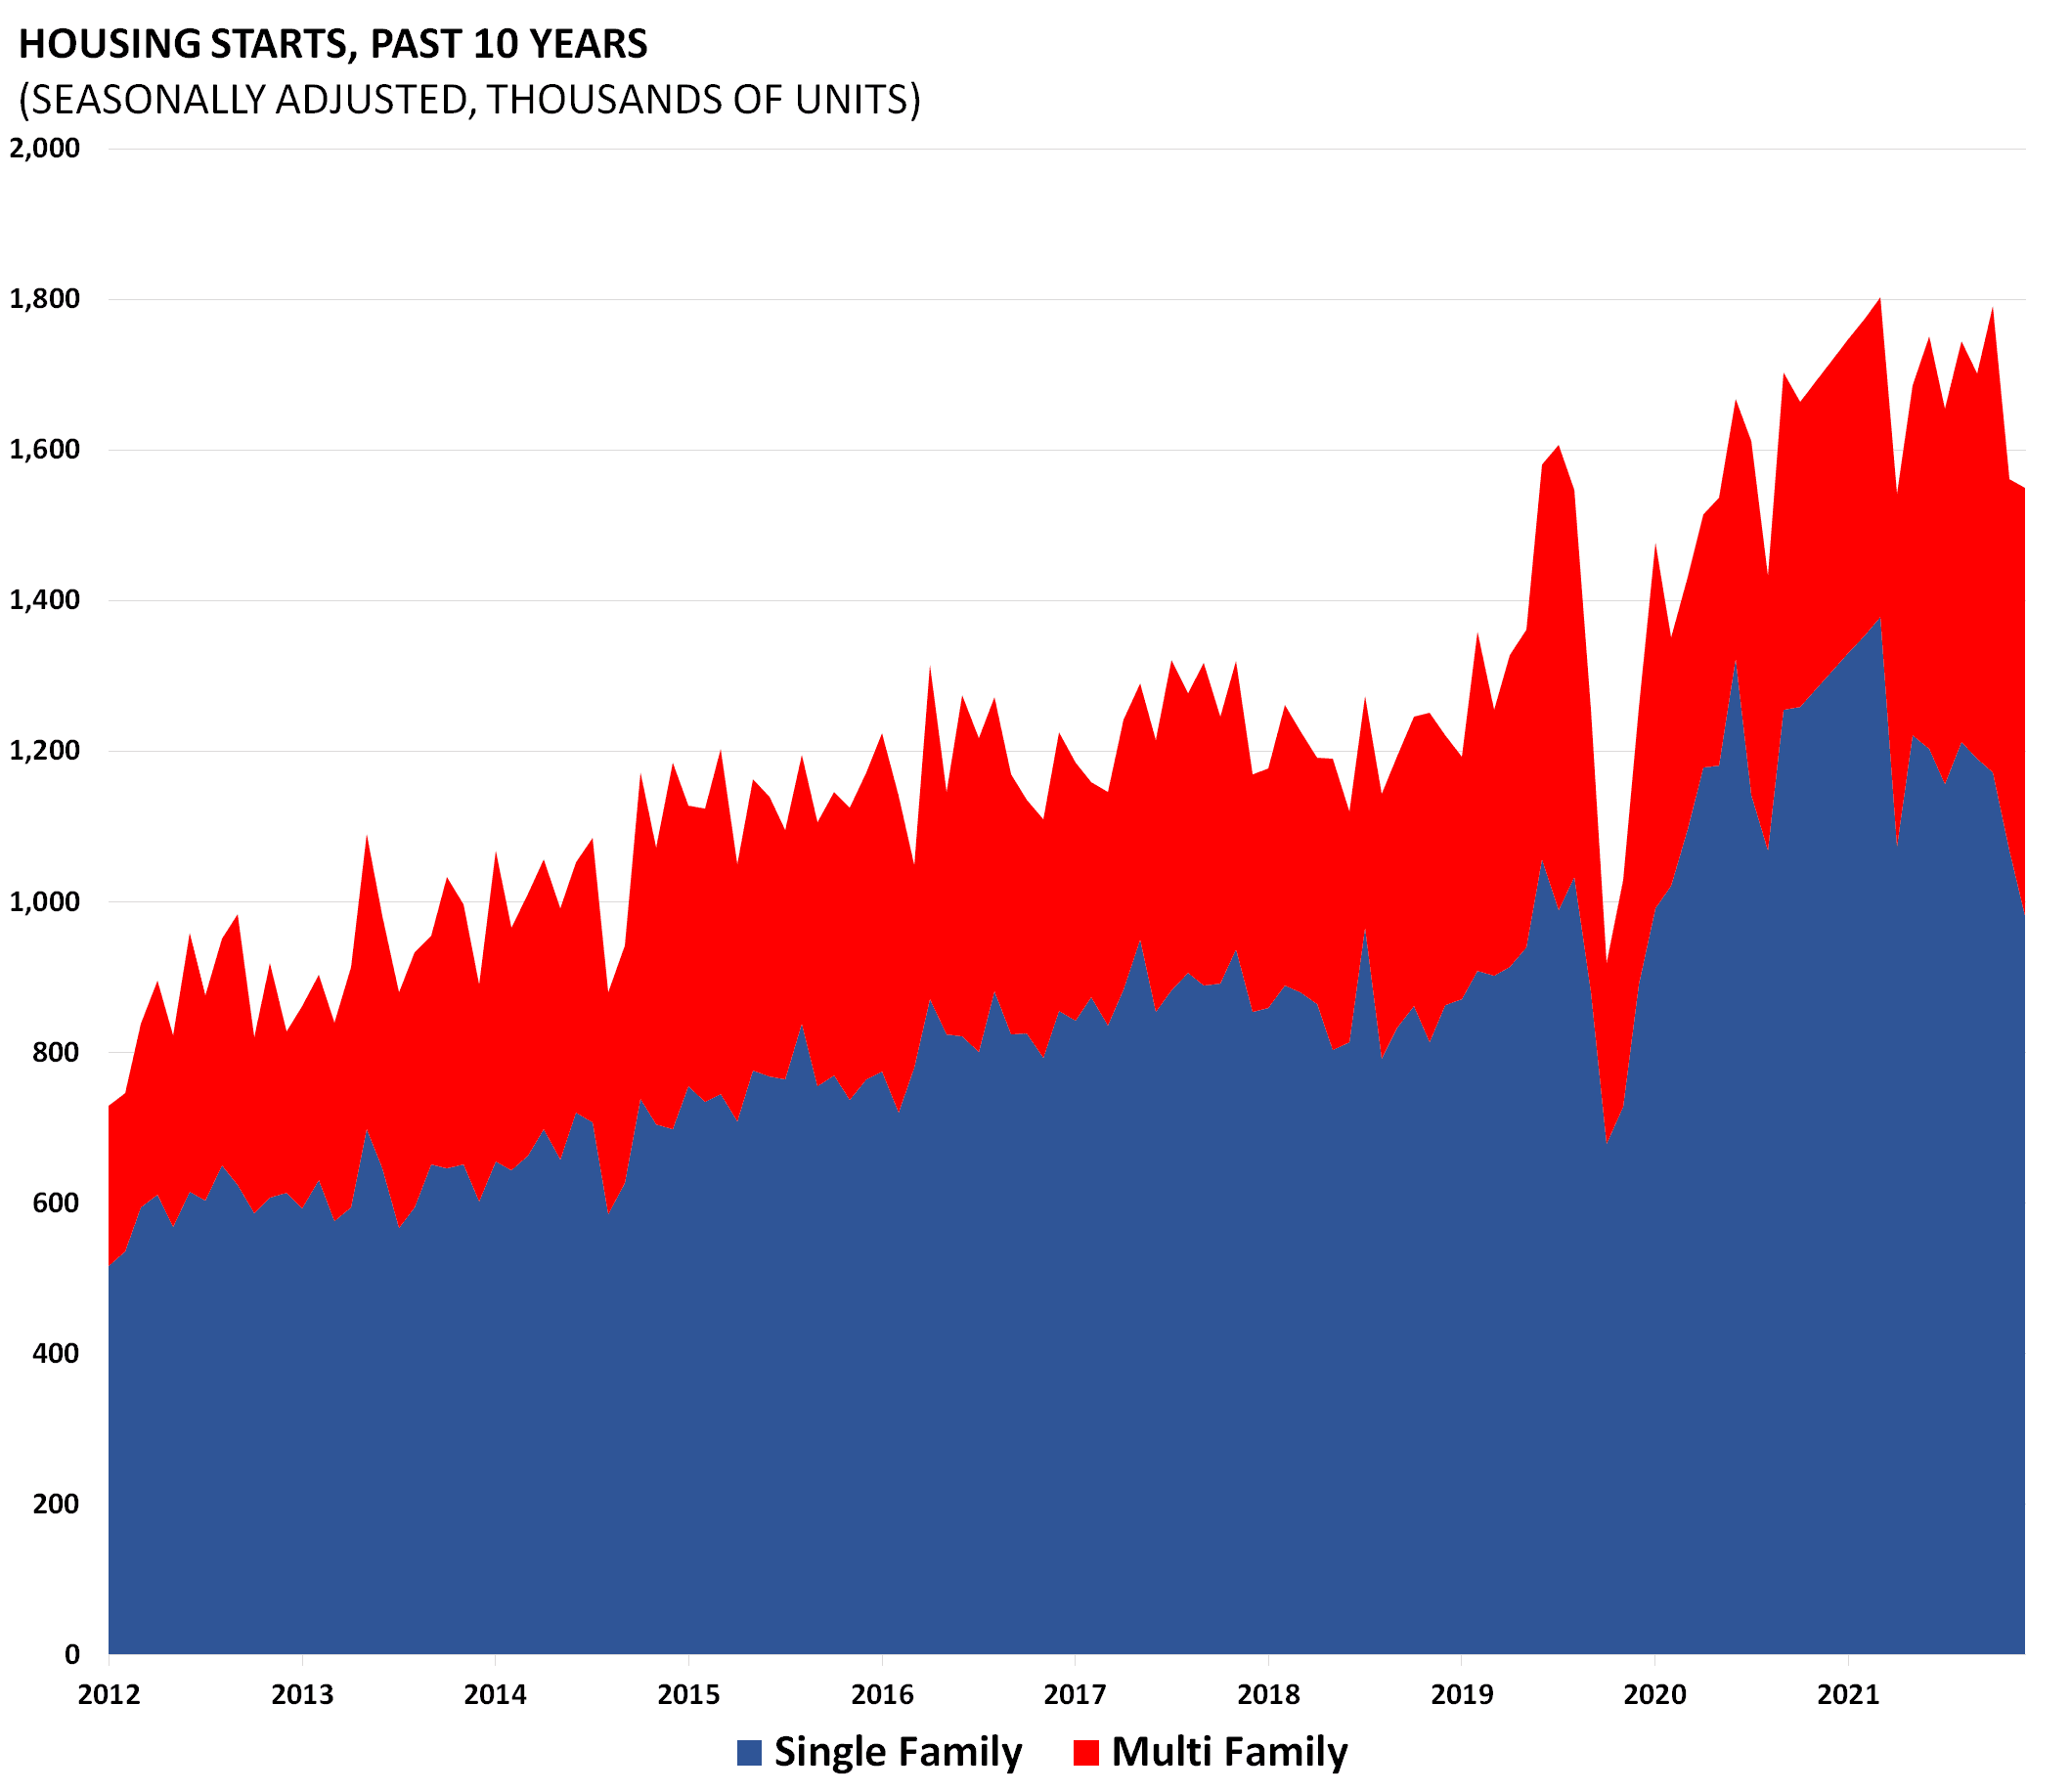
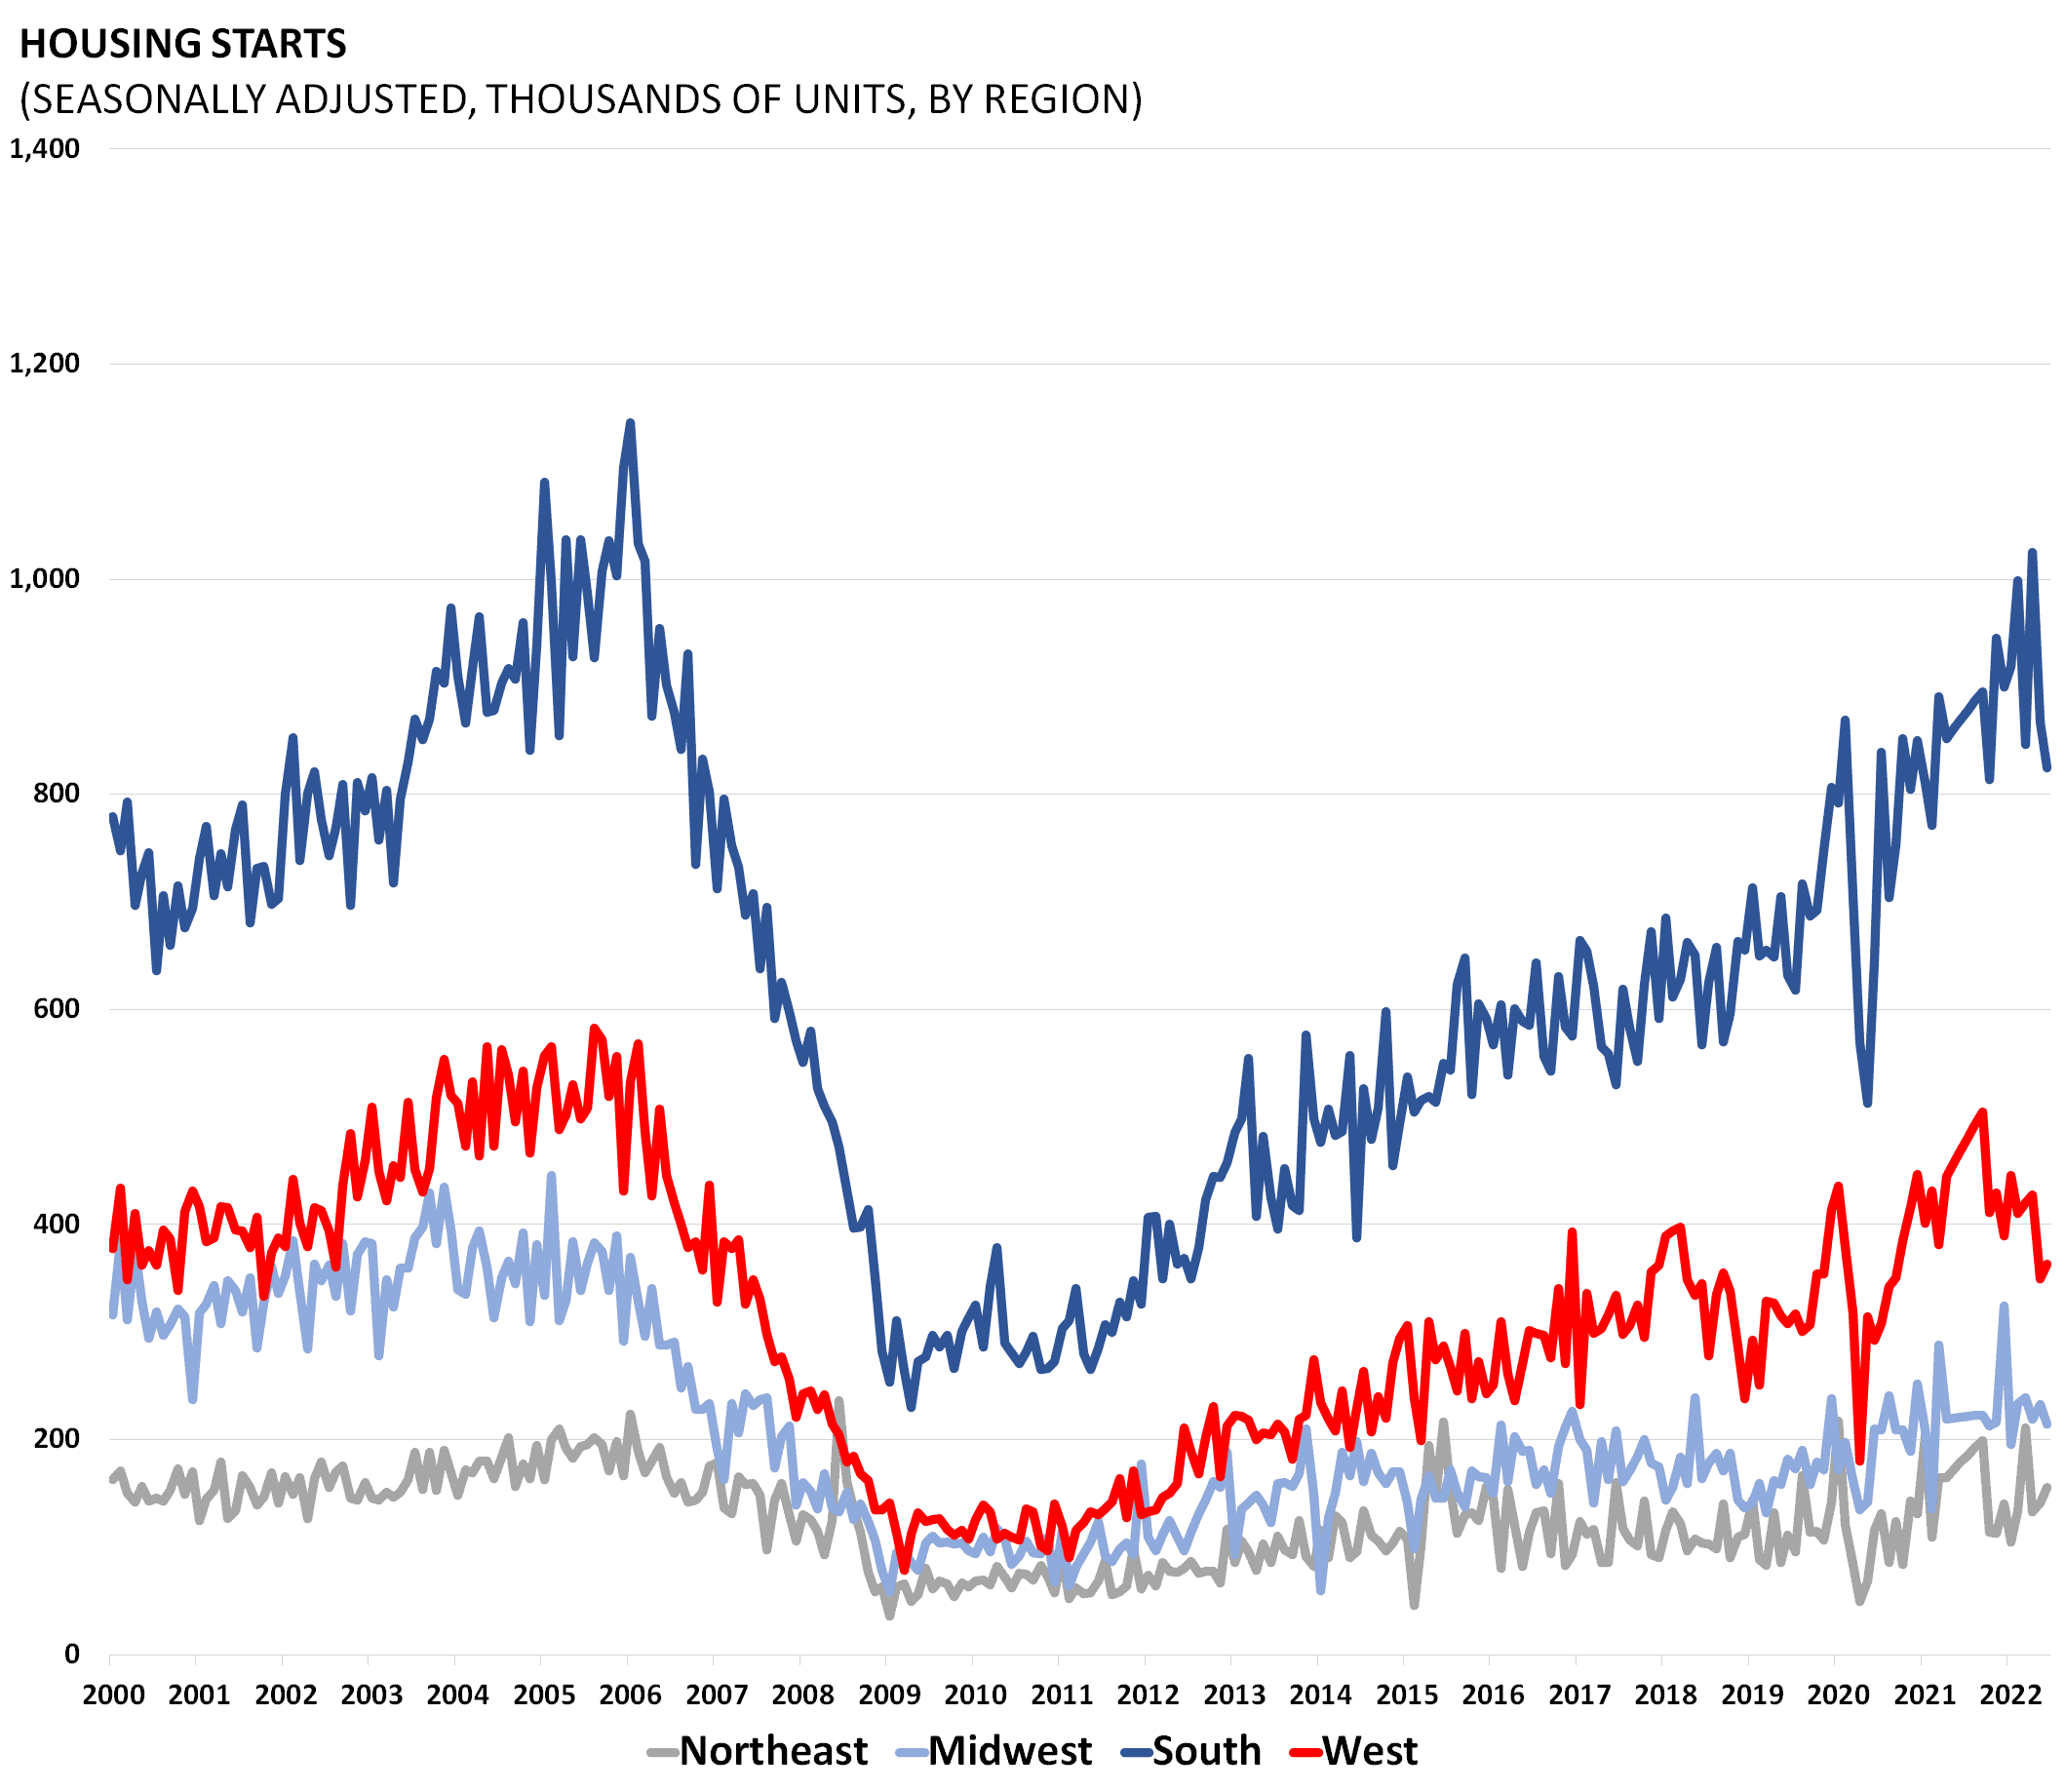
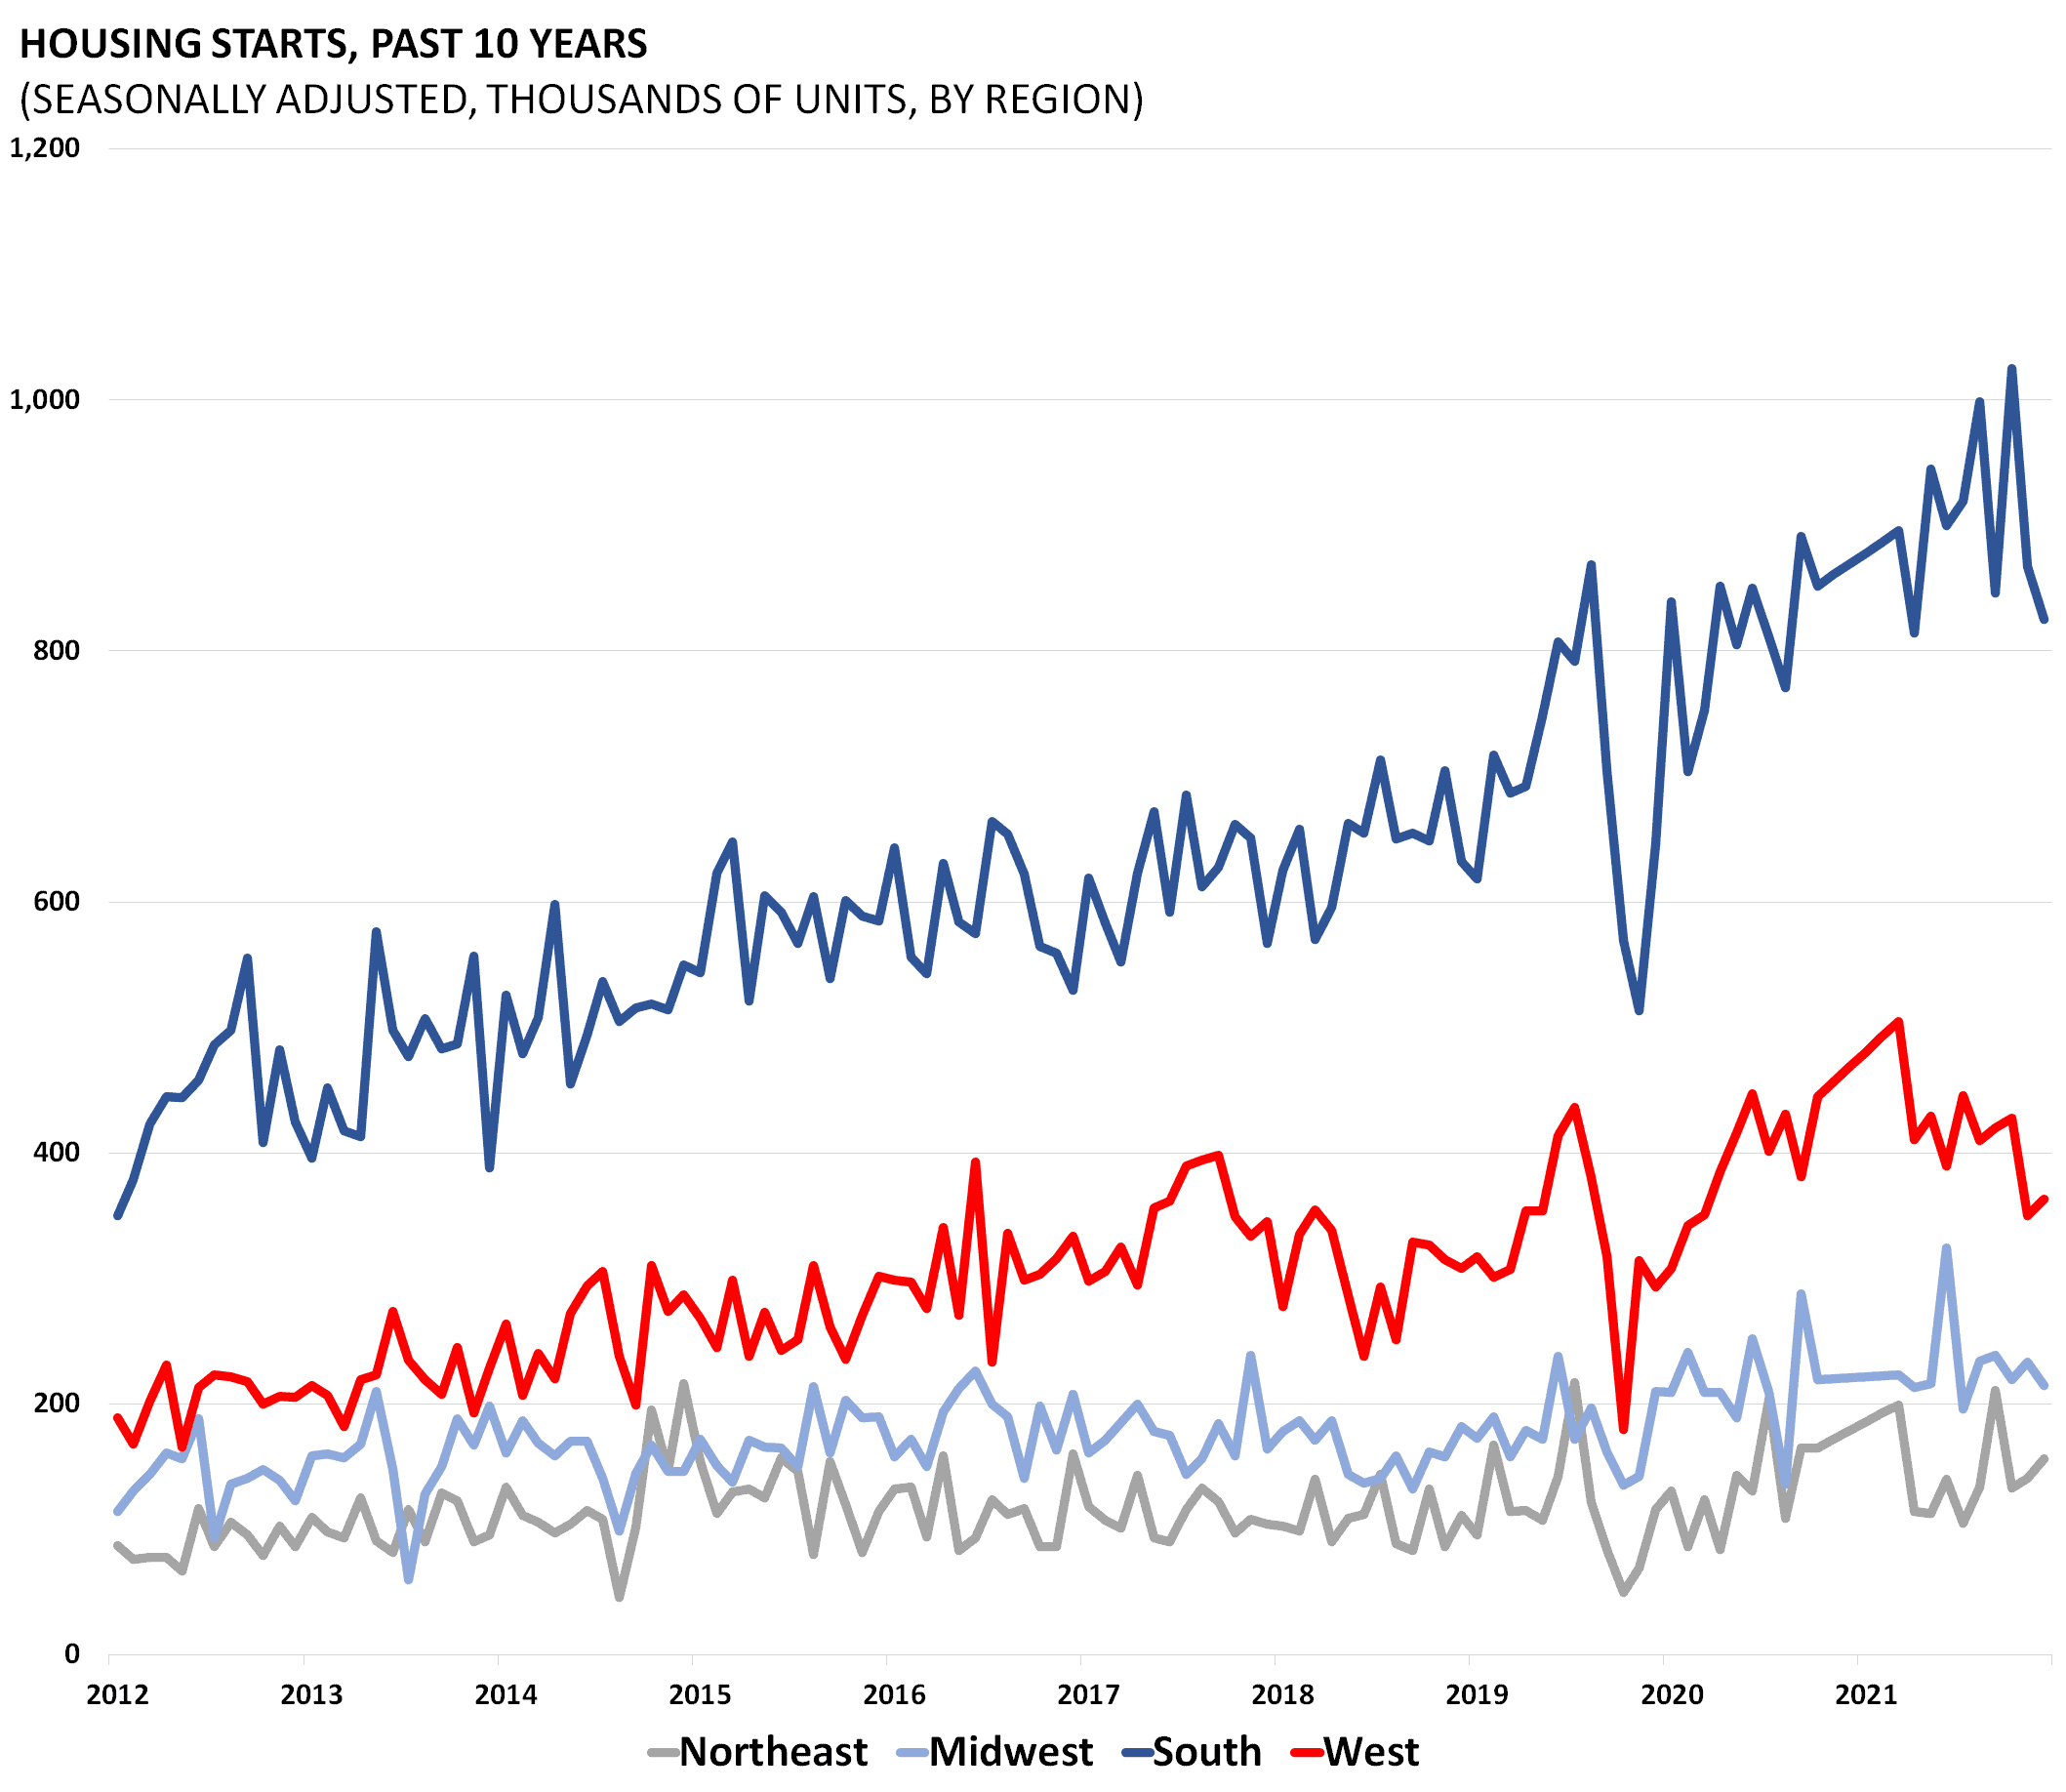
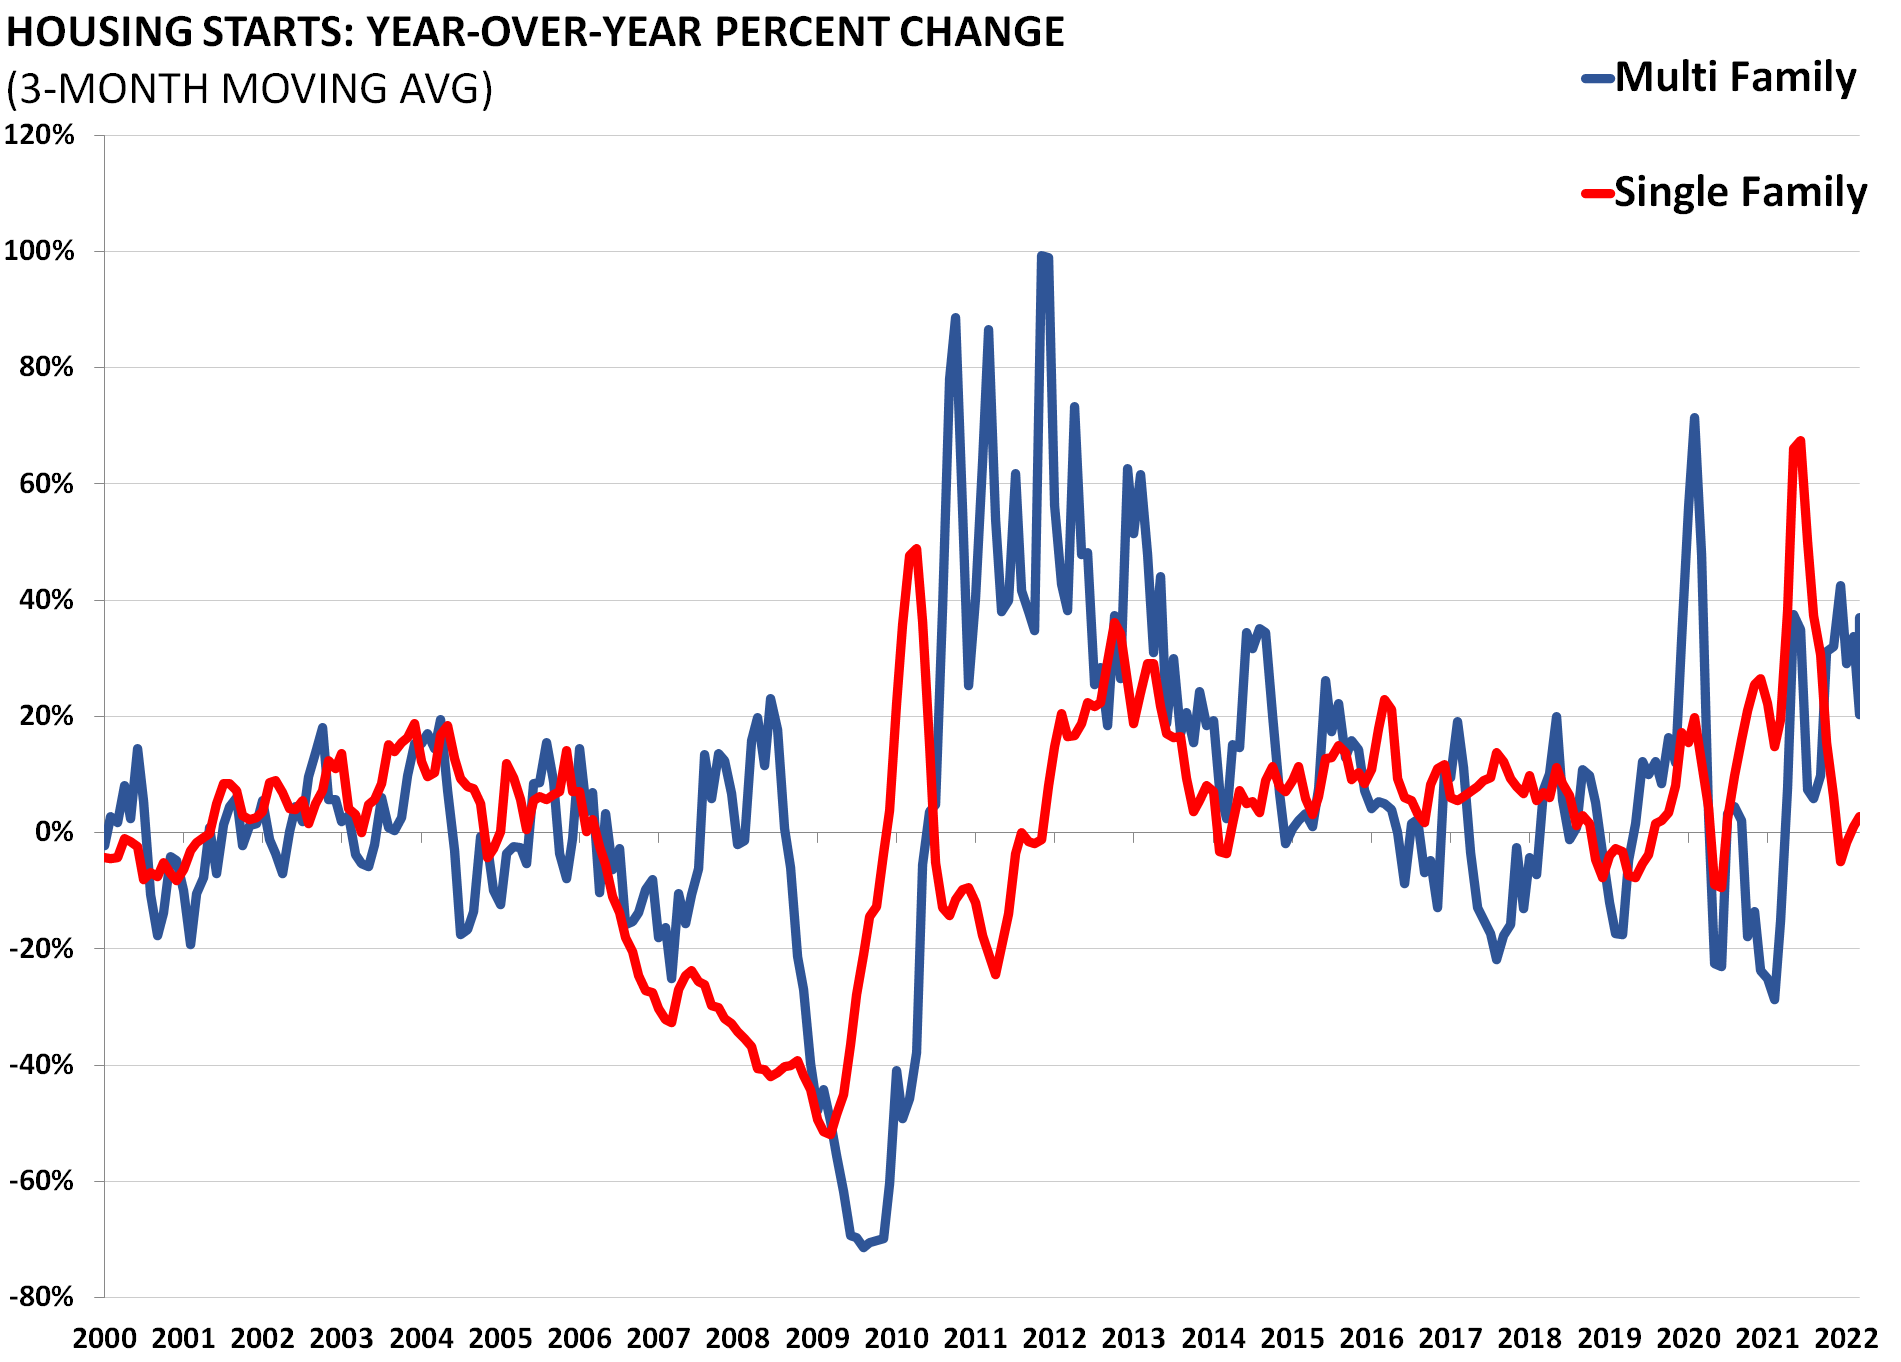
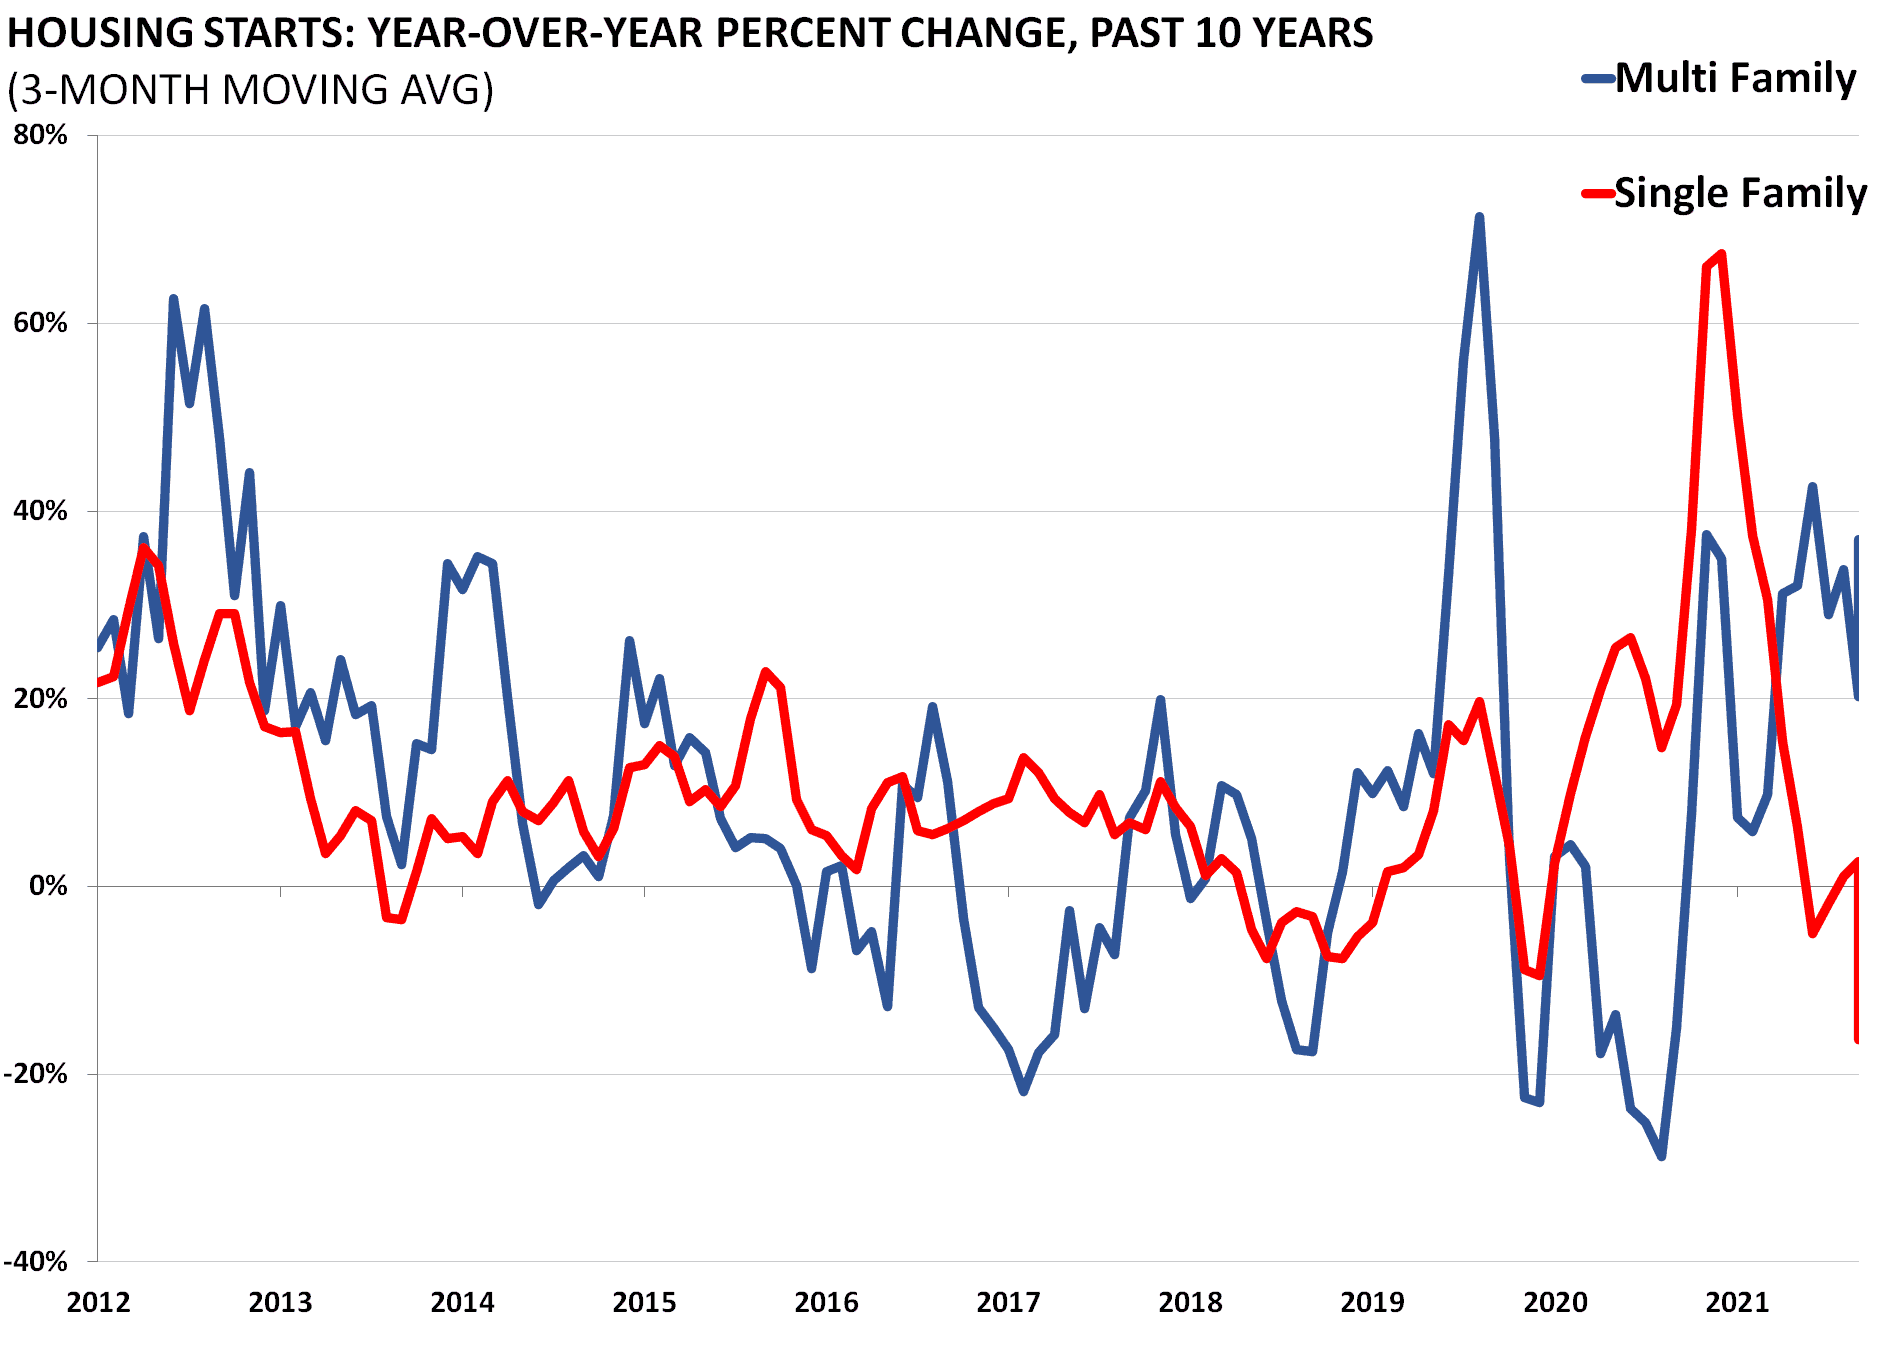
Housing starts and permits data are released by the Census Bureau as part of its “New Residential Construction” report. Starts and permits are important indicators on the supply side of the housing market. Housing starts are seasonally adjusted and count only privately-owned housing starts.
Source: www.census.gov/construction/nrc/historical_data
Data Release: www.census.gov/construction/nrc/pdf/newresconst.pdf
Demand and House Prices
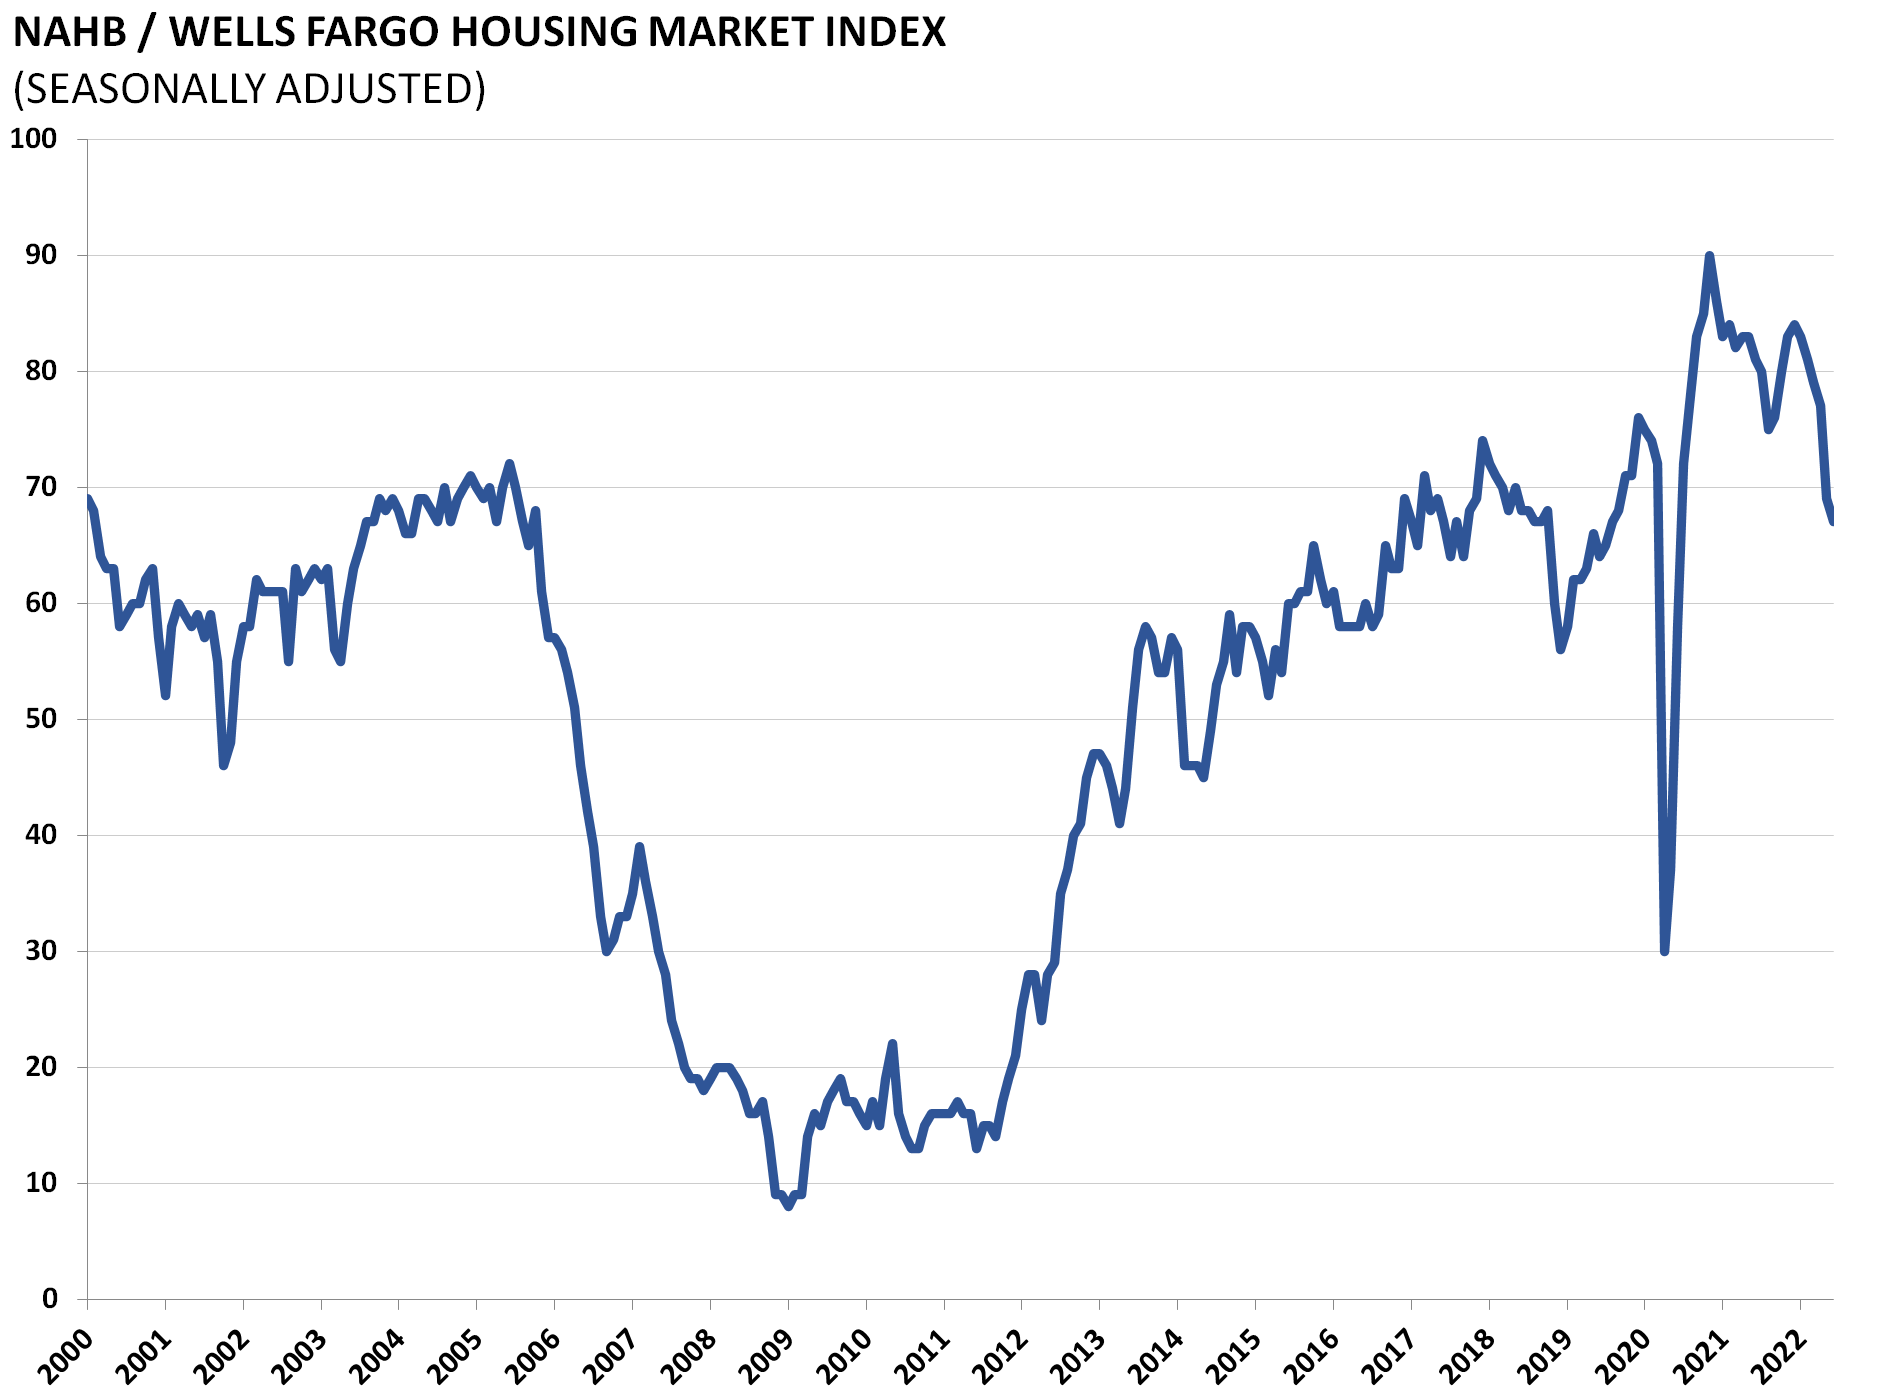
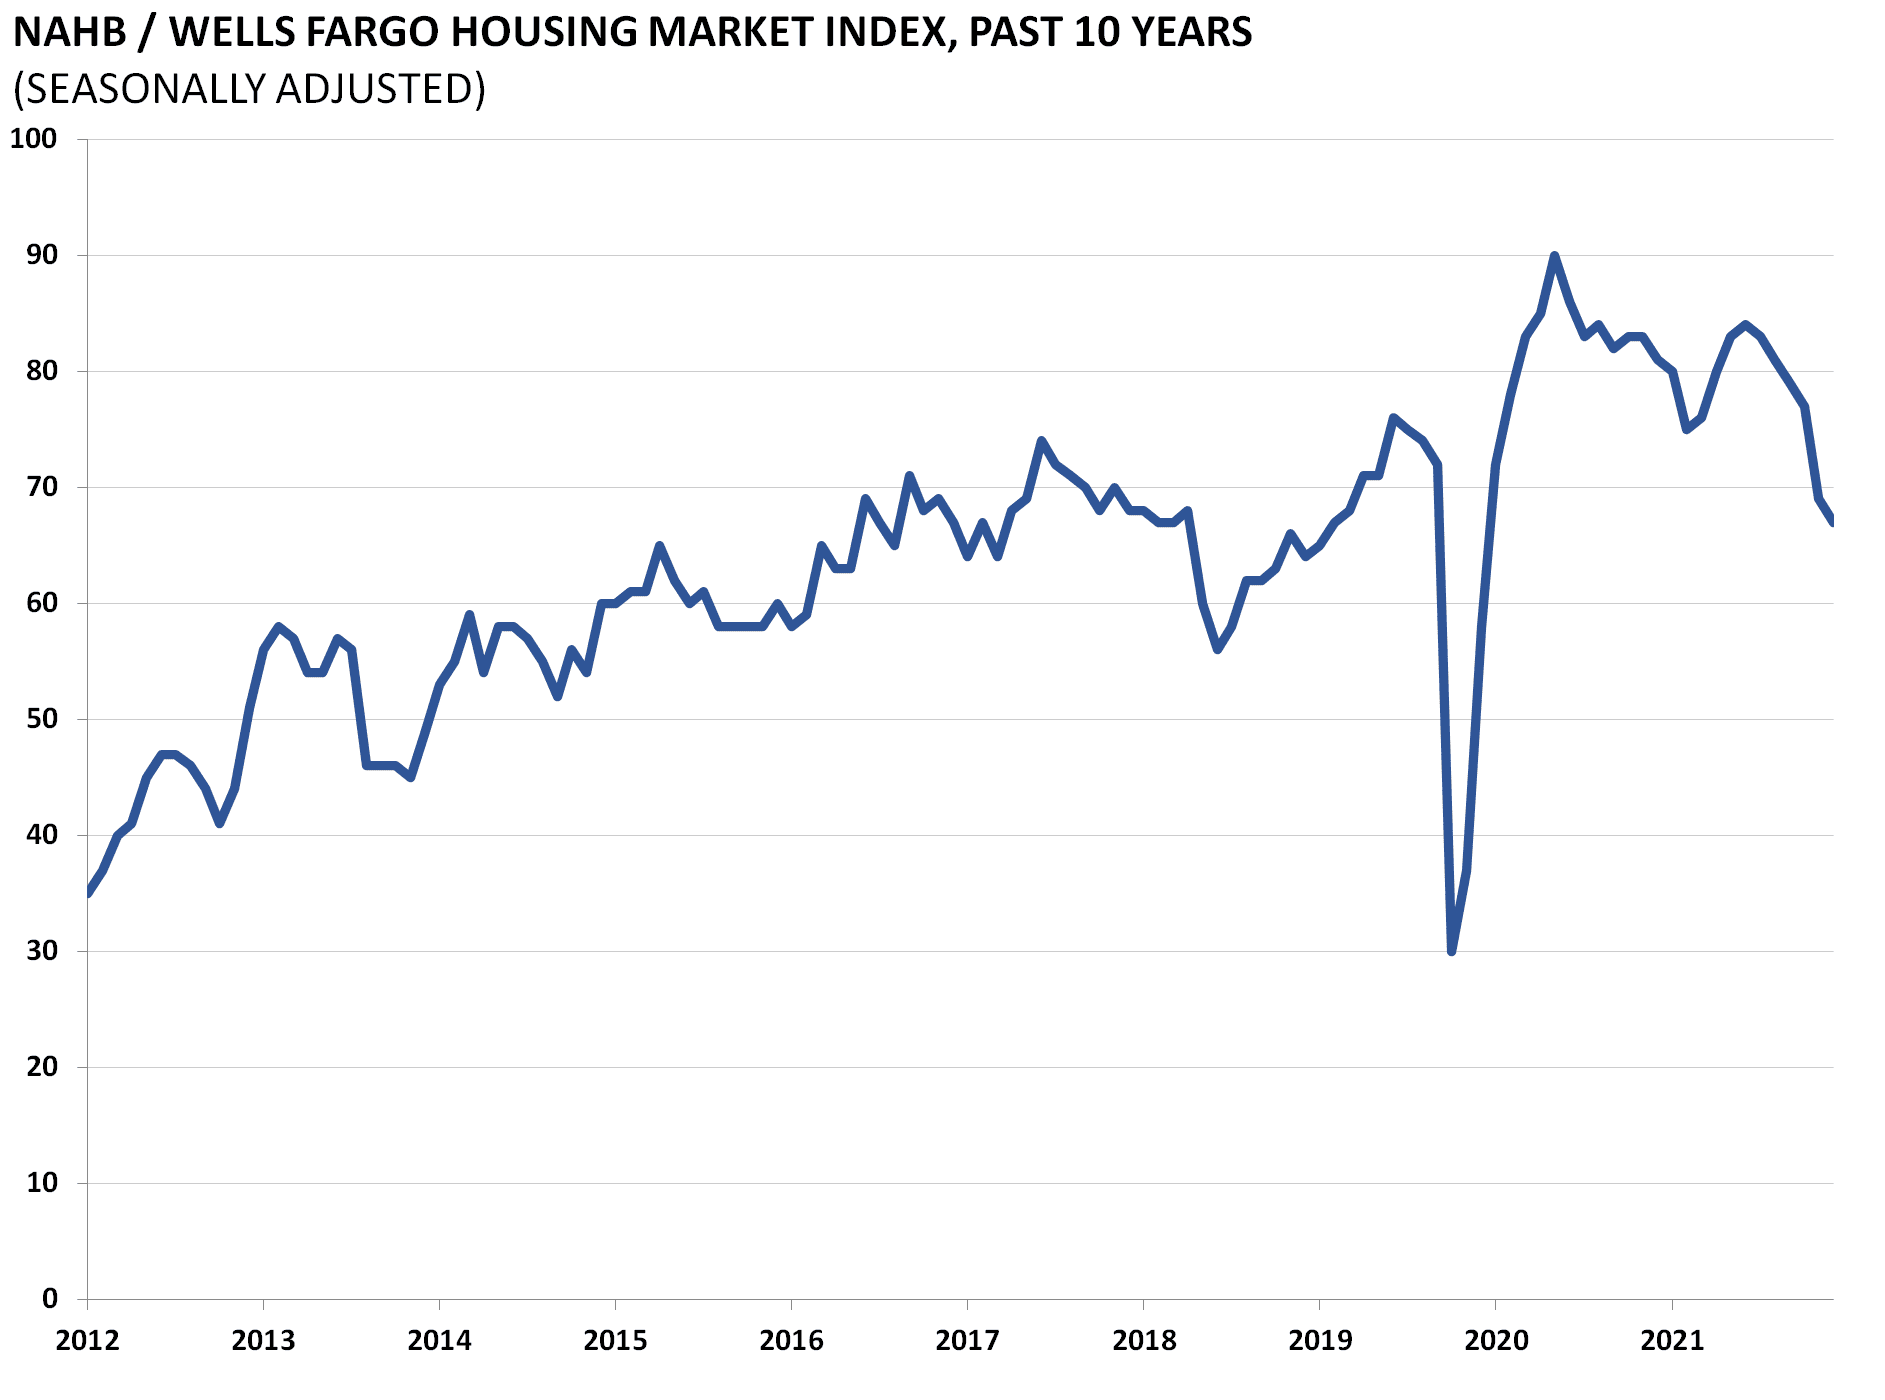
The National Association of Home Builders (NAHB) releases its Housing Market Index monthly to record builder sentiment on the demand side of the single-family housing market. The index is frequently used in assessments of housing market conditions. It is derived from a survey of builders who rate the market based on sales and expectations.
Source and Data Release: https://www.nahb.org/en/research/housing-economics/housing-indexes/housing-market-index.aspx
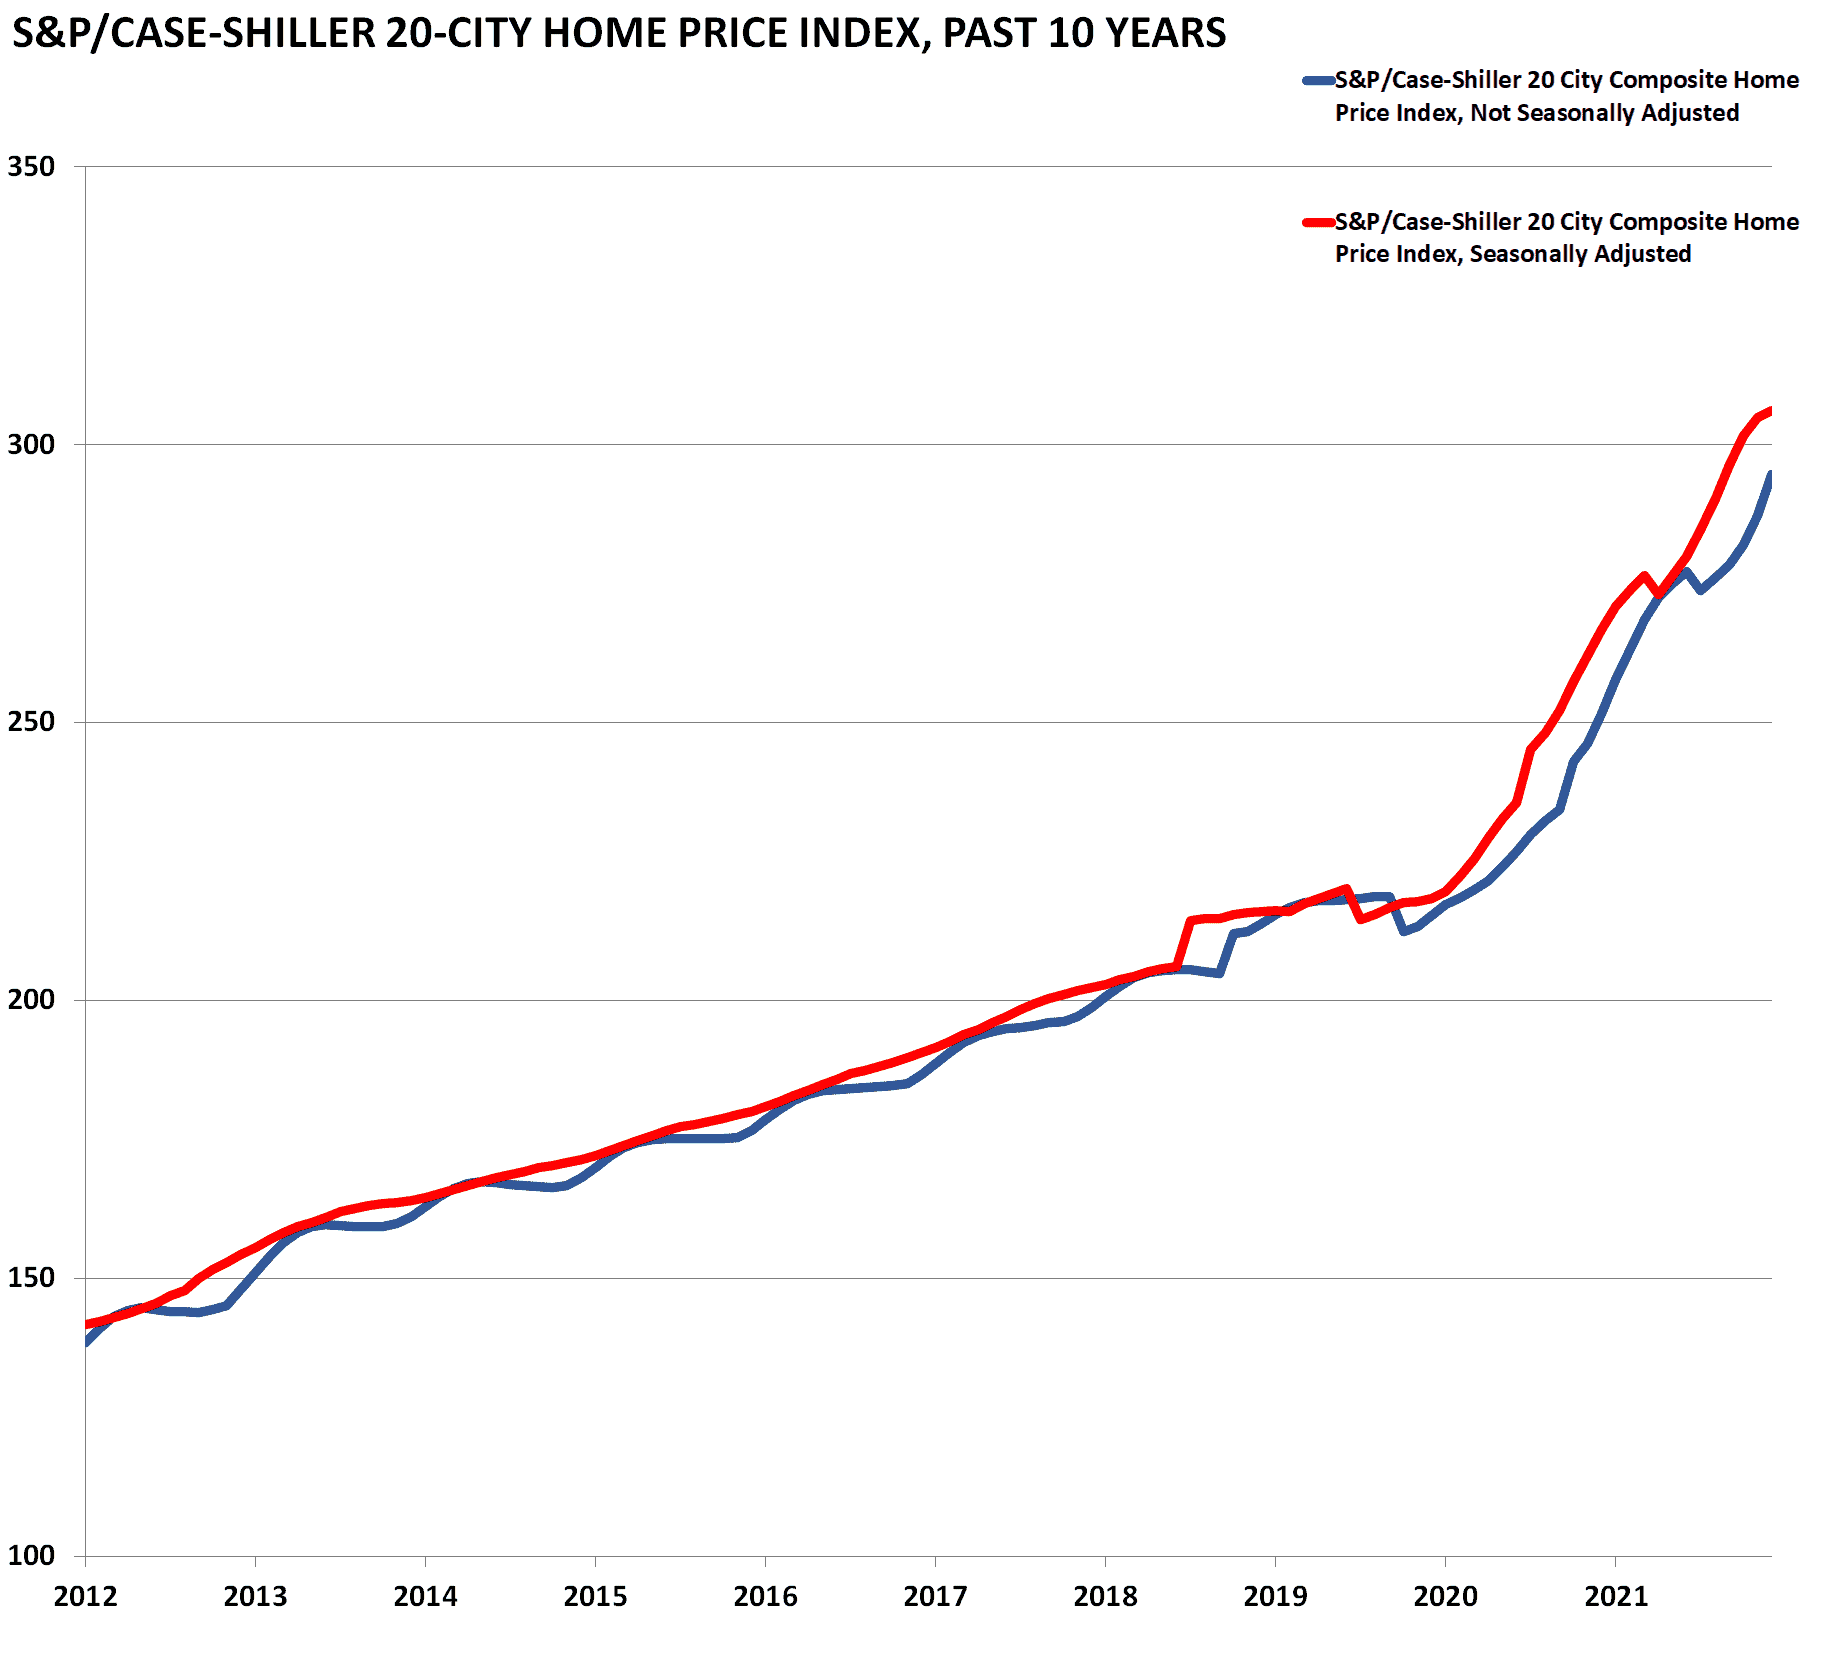
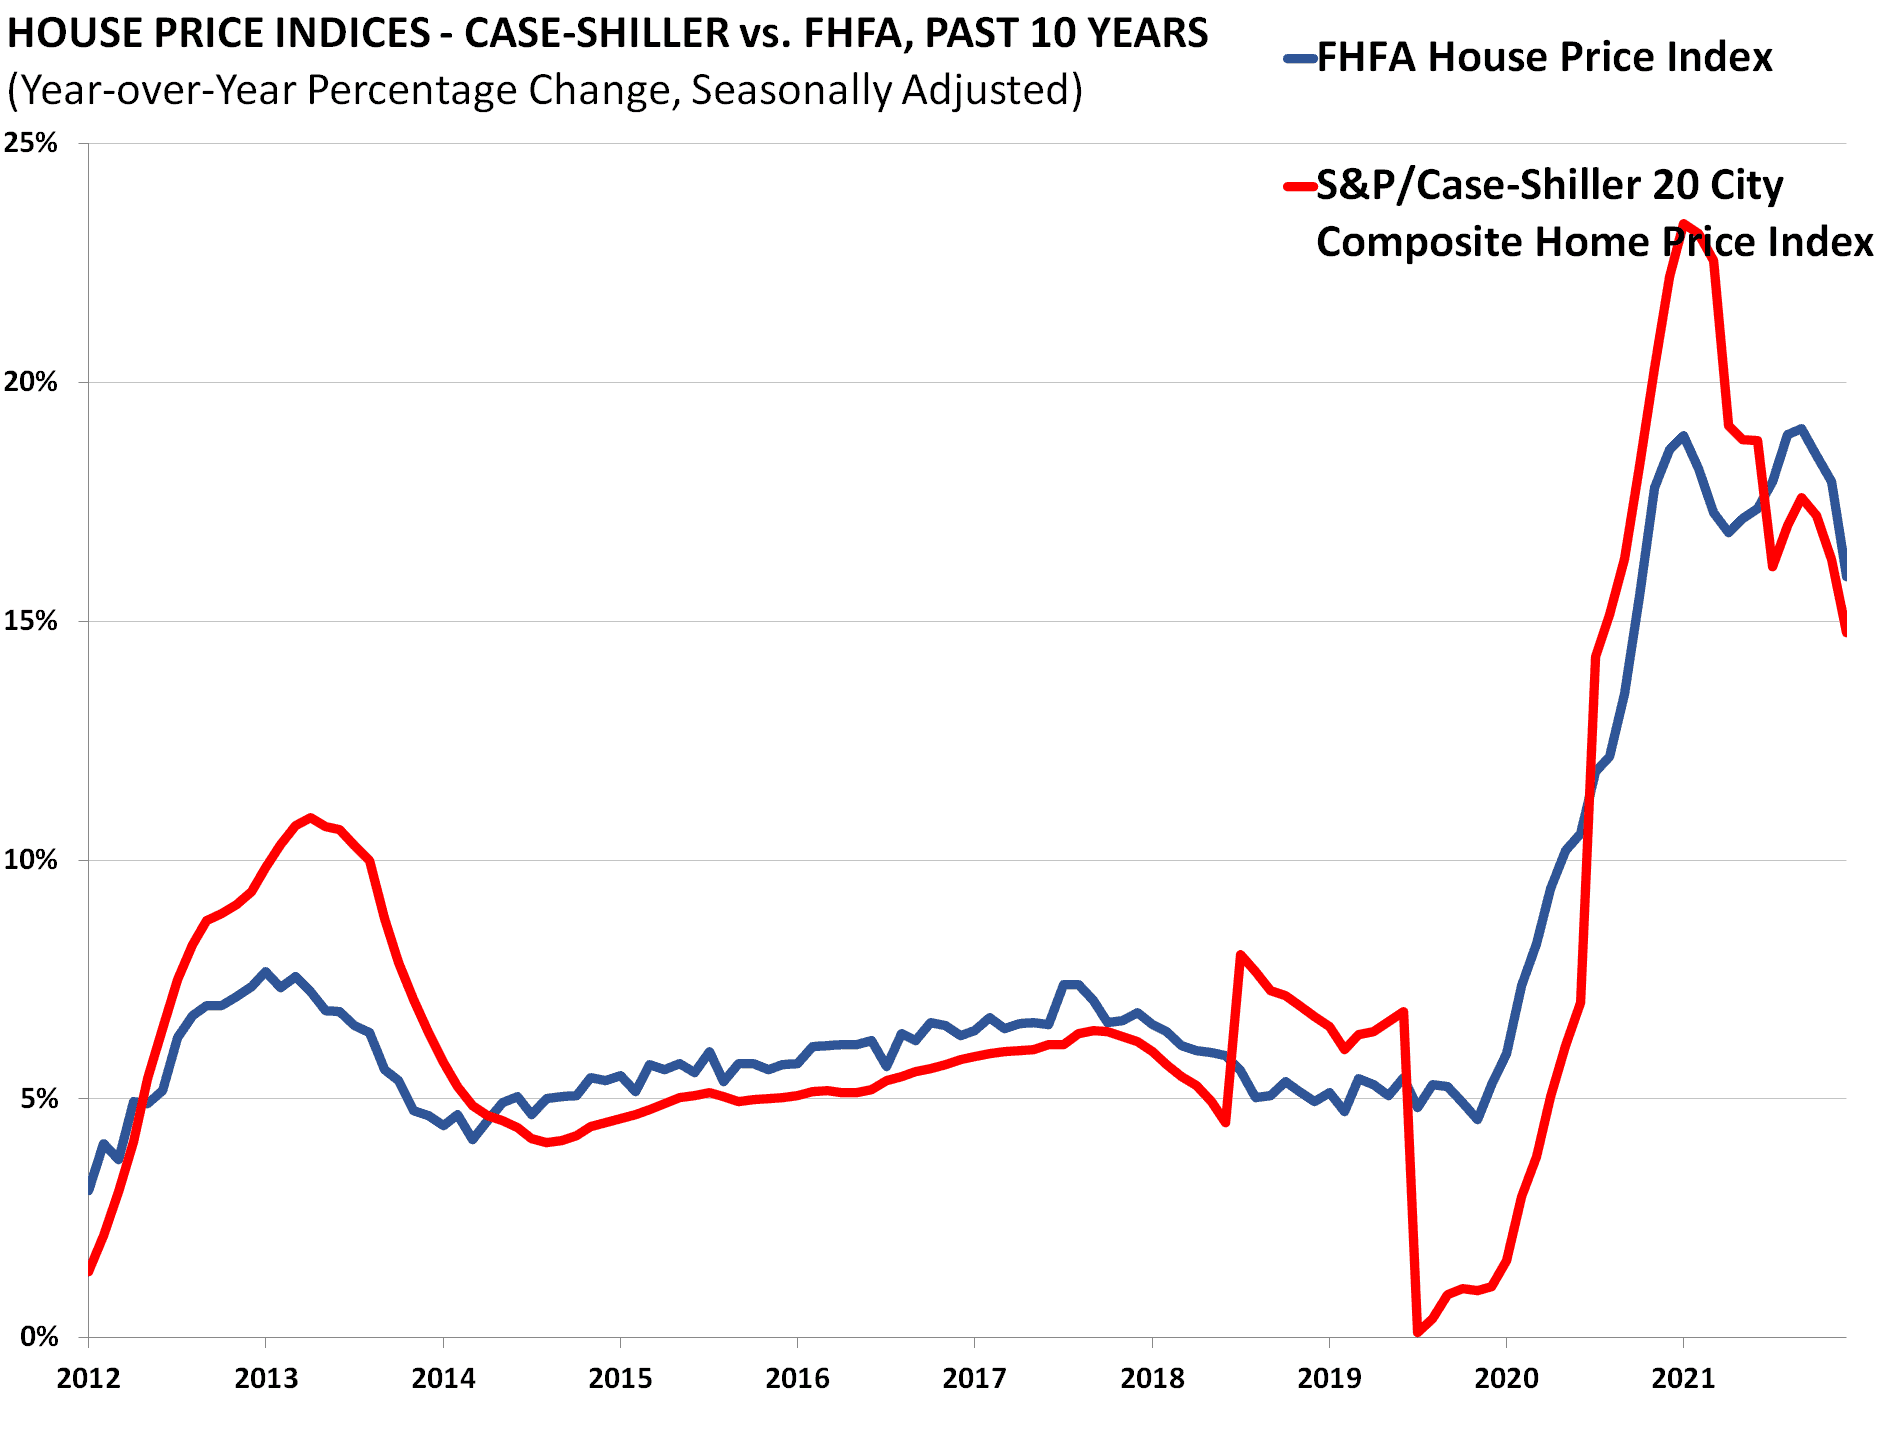
The S&P/Case-Shiller home price index is released near the end of each month for the month two months previously. The release is an index of home prices in 20 of the largest metropolitan areas across the country. It is a reputable and widely reported indicator of home prices.
Source: https://www.fhfa.gov/DataTools/Downloads/Pages/House-Price-Index-Datasets.aspx#mpo
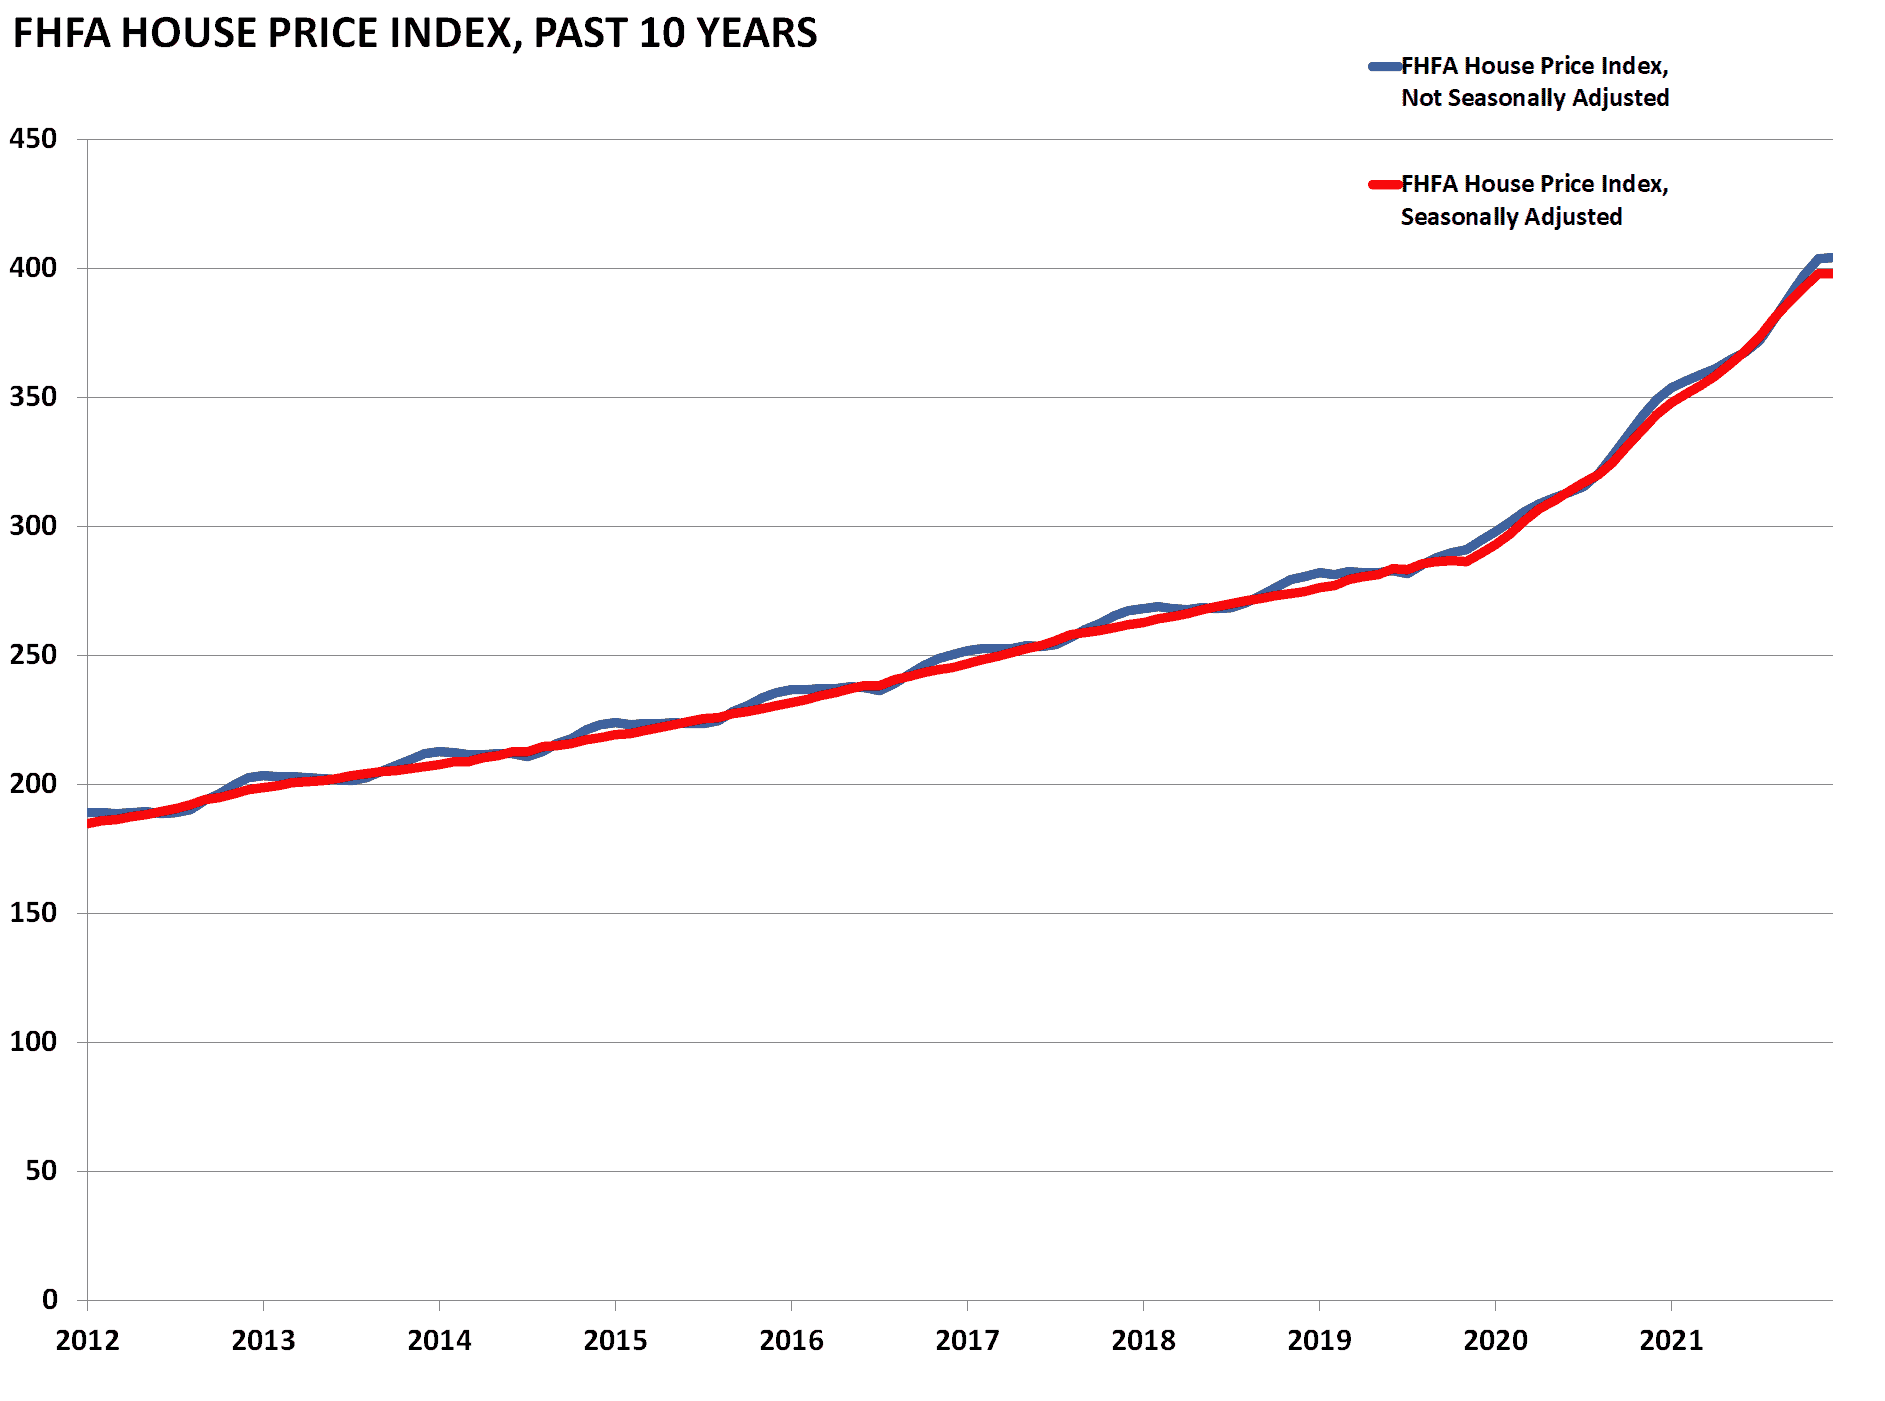
Similar to the Case-Shiller Index, the Federal Housing Finance Agency’s House Price Index (HPI) is a broad measure of single-family house prices. Information for the index is derived from properties whose mortgages have been purchased or securitized by Fannie Mae or Freddie Mac from all 50 states and the DC area.
Source: https://www.fhfa.gov/DataTools/Downloads/Pages/House-Price-Index-Datasets.aspx#mpo
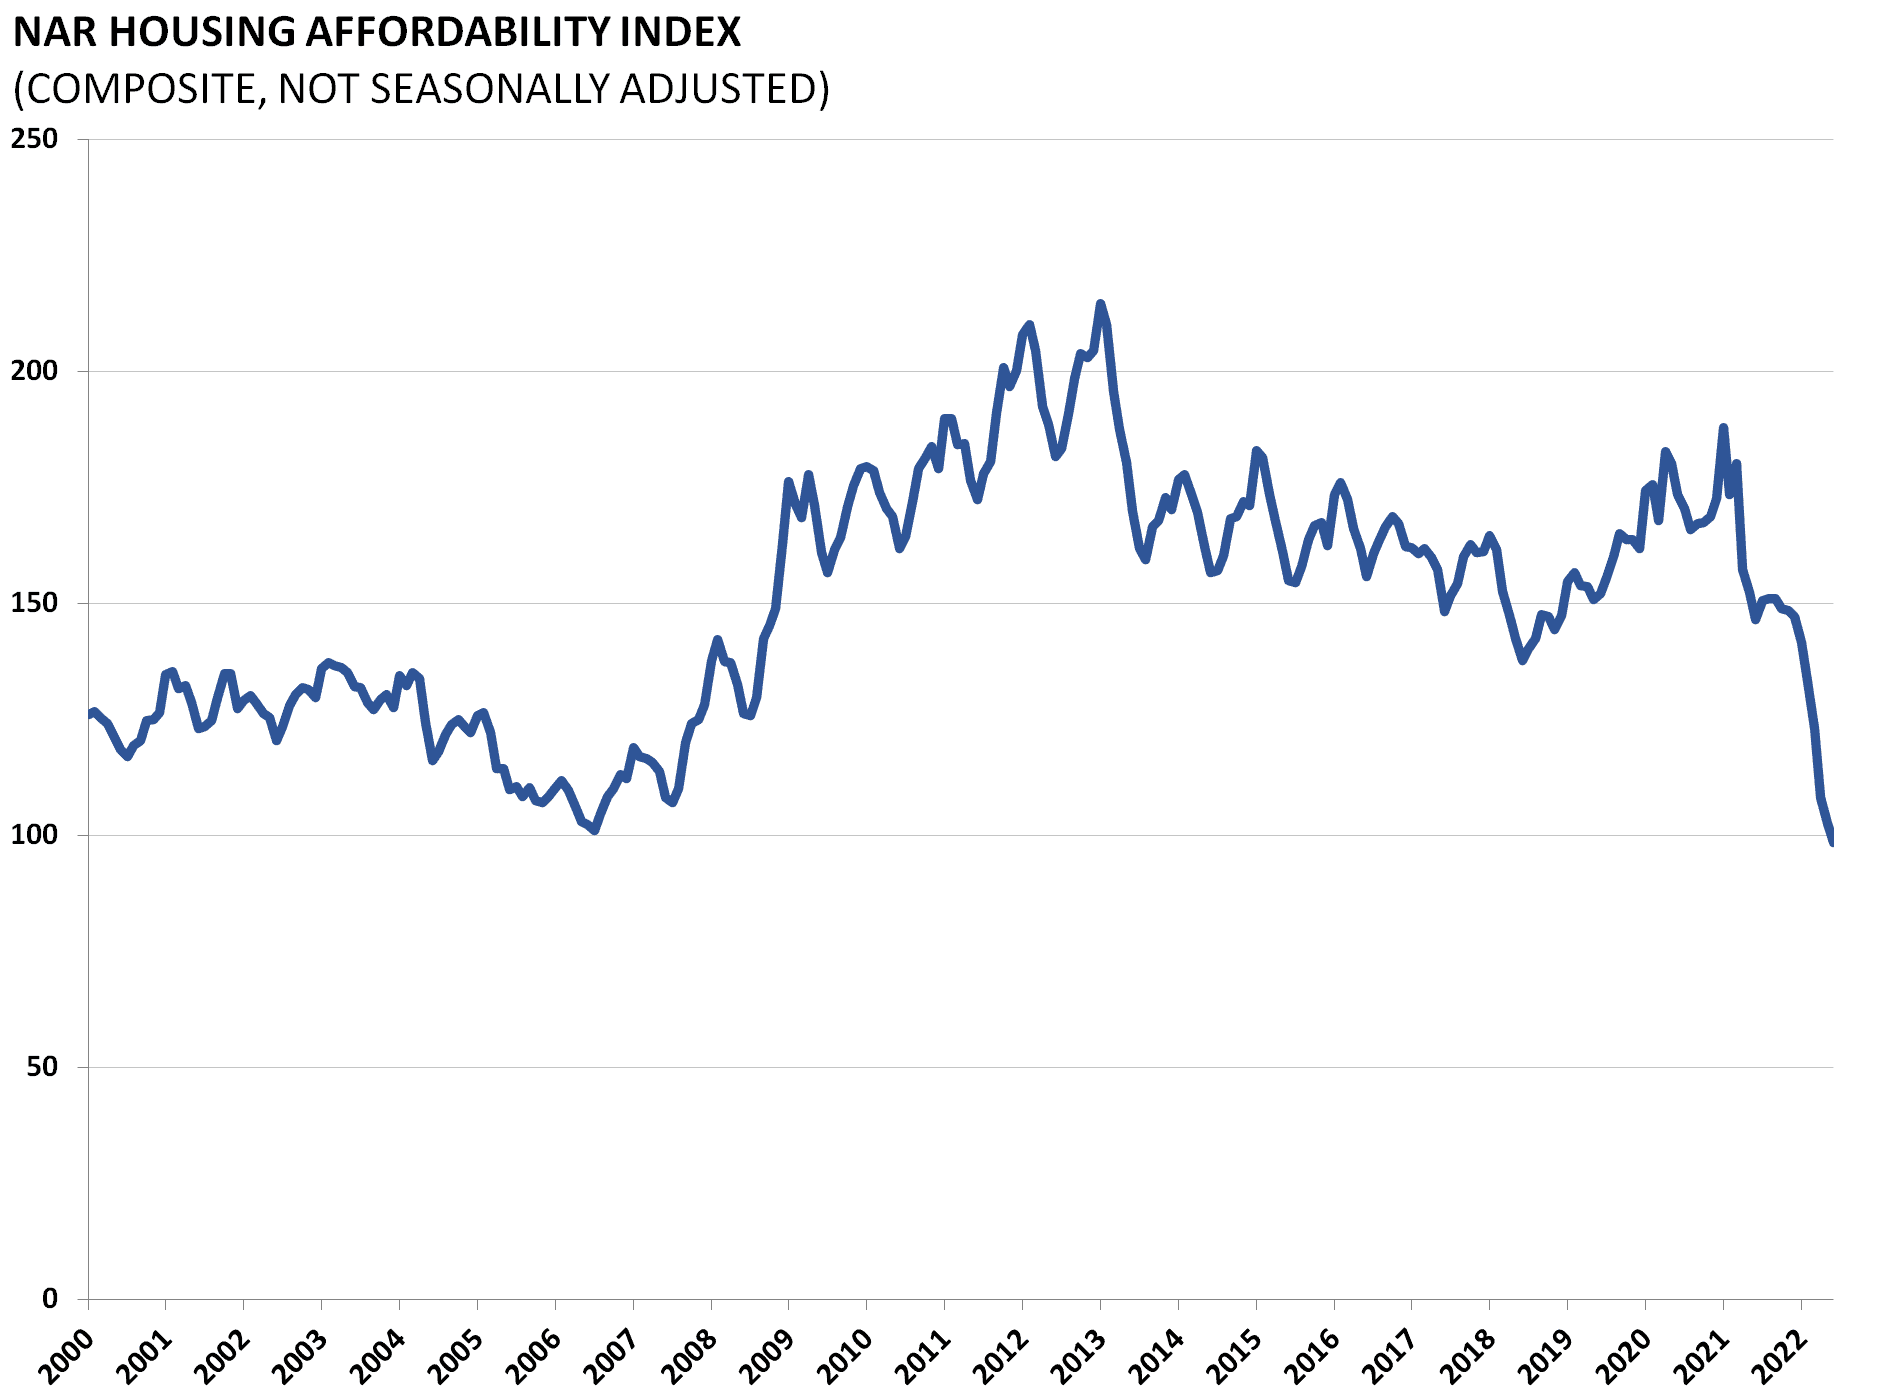
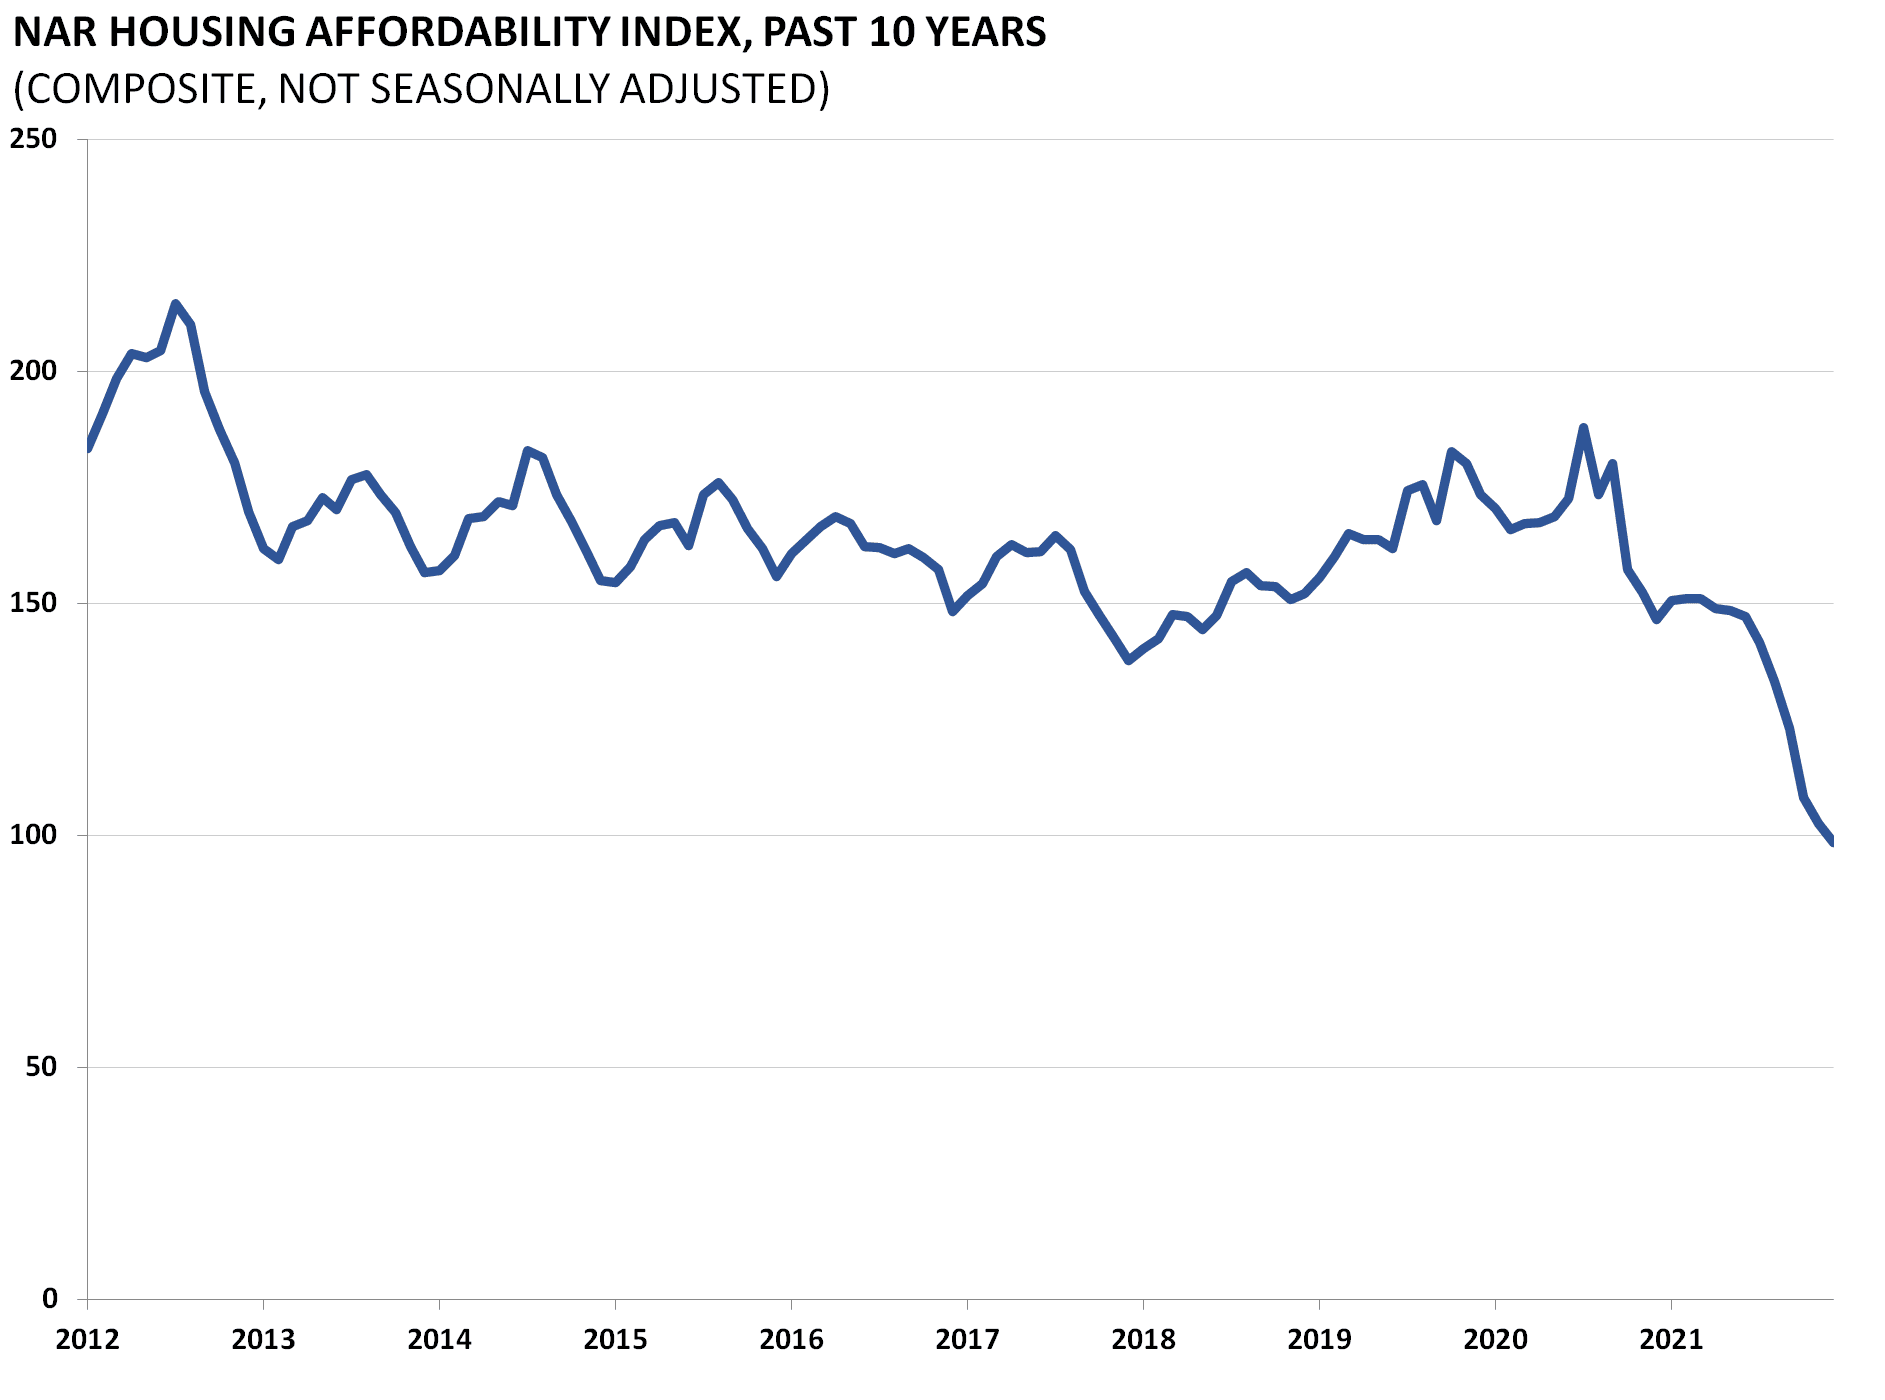
The National Association of Realtors releases updated numbers on housing affordability monthly. The measure is an index in which the value of 100 means a family has exactly enough income to quality for a mortgage on a median-priced home. Measures above 100 mean that a family has more than enough income to qualify. Since the housing bubble, home affordability has been high, a positive sign for a recovery in demand.
Source: http://research.stlouisfed.org/fred2/series/COMPHAI
Data Release: http://www.realtor.org/topics/housing-affordability-index
Homeownership
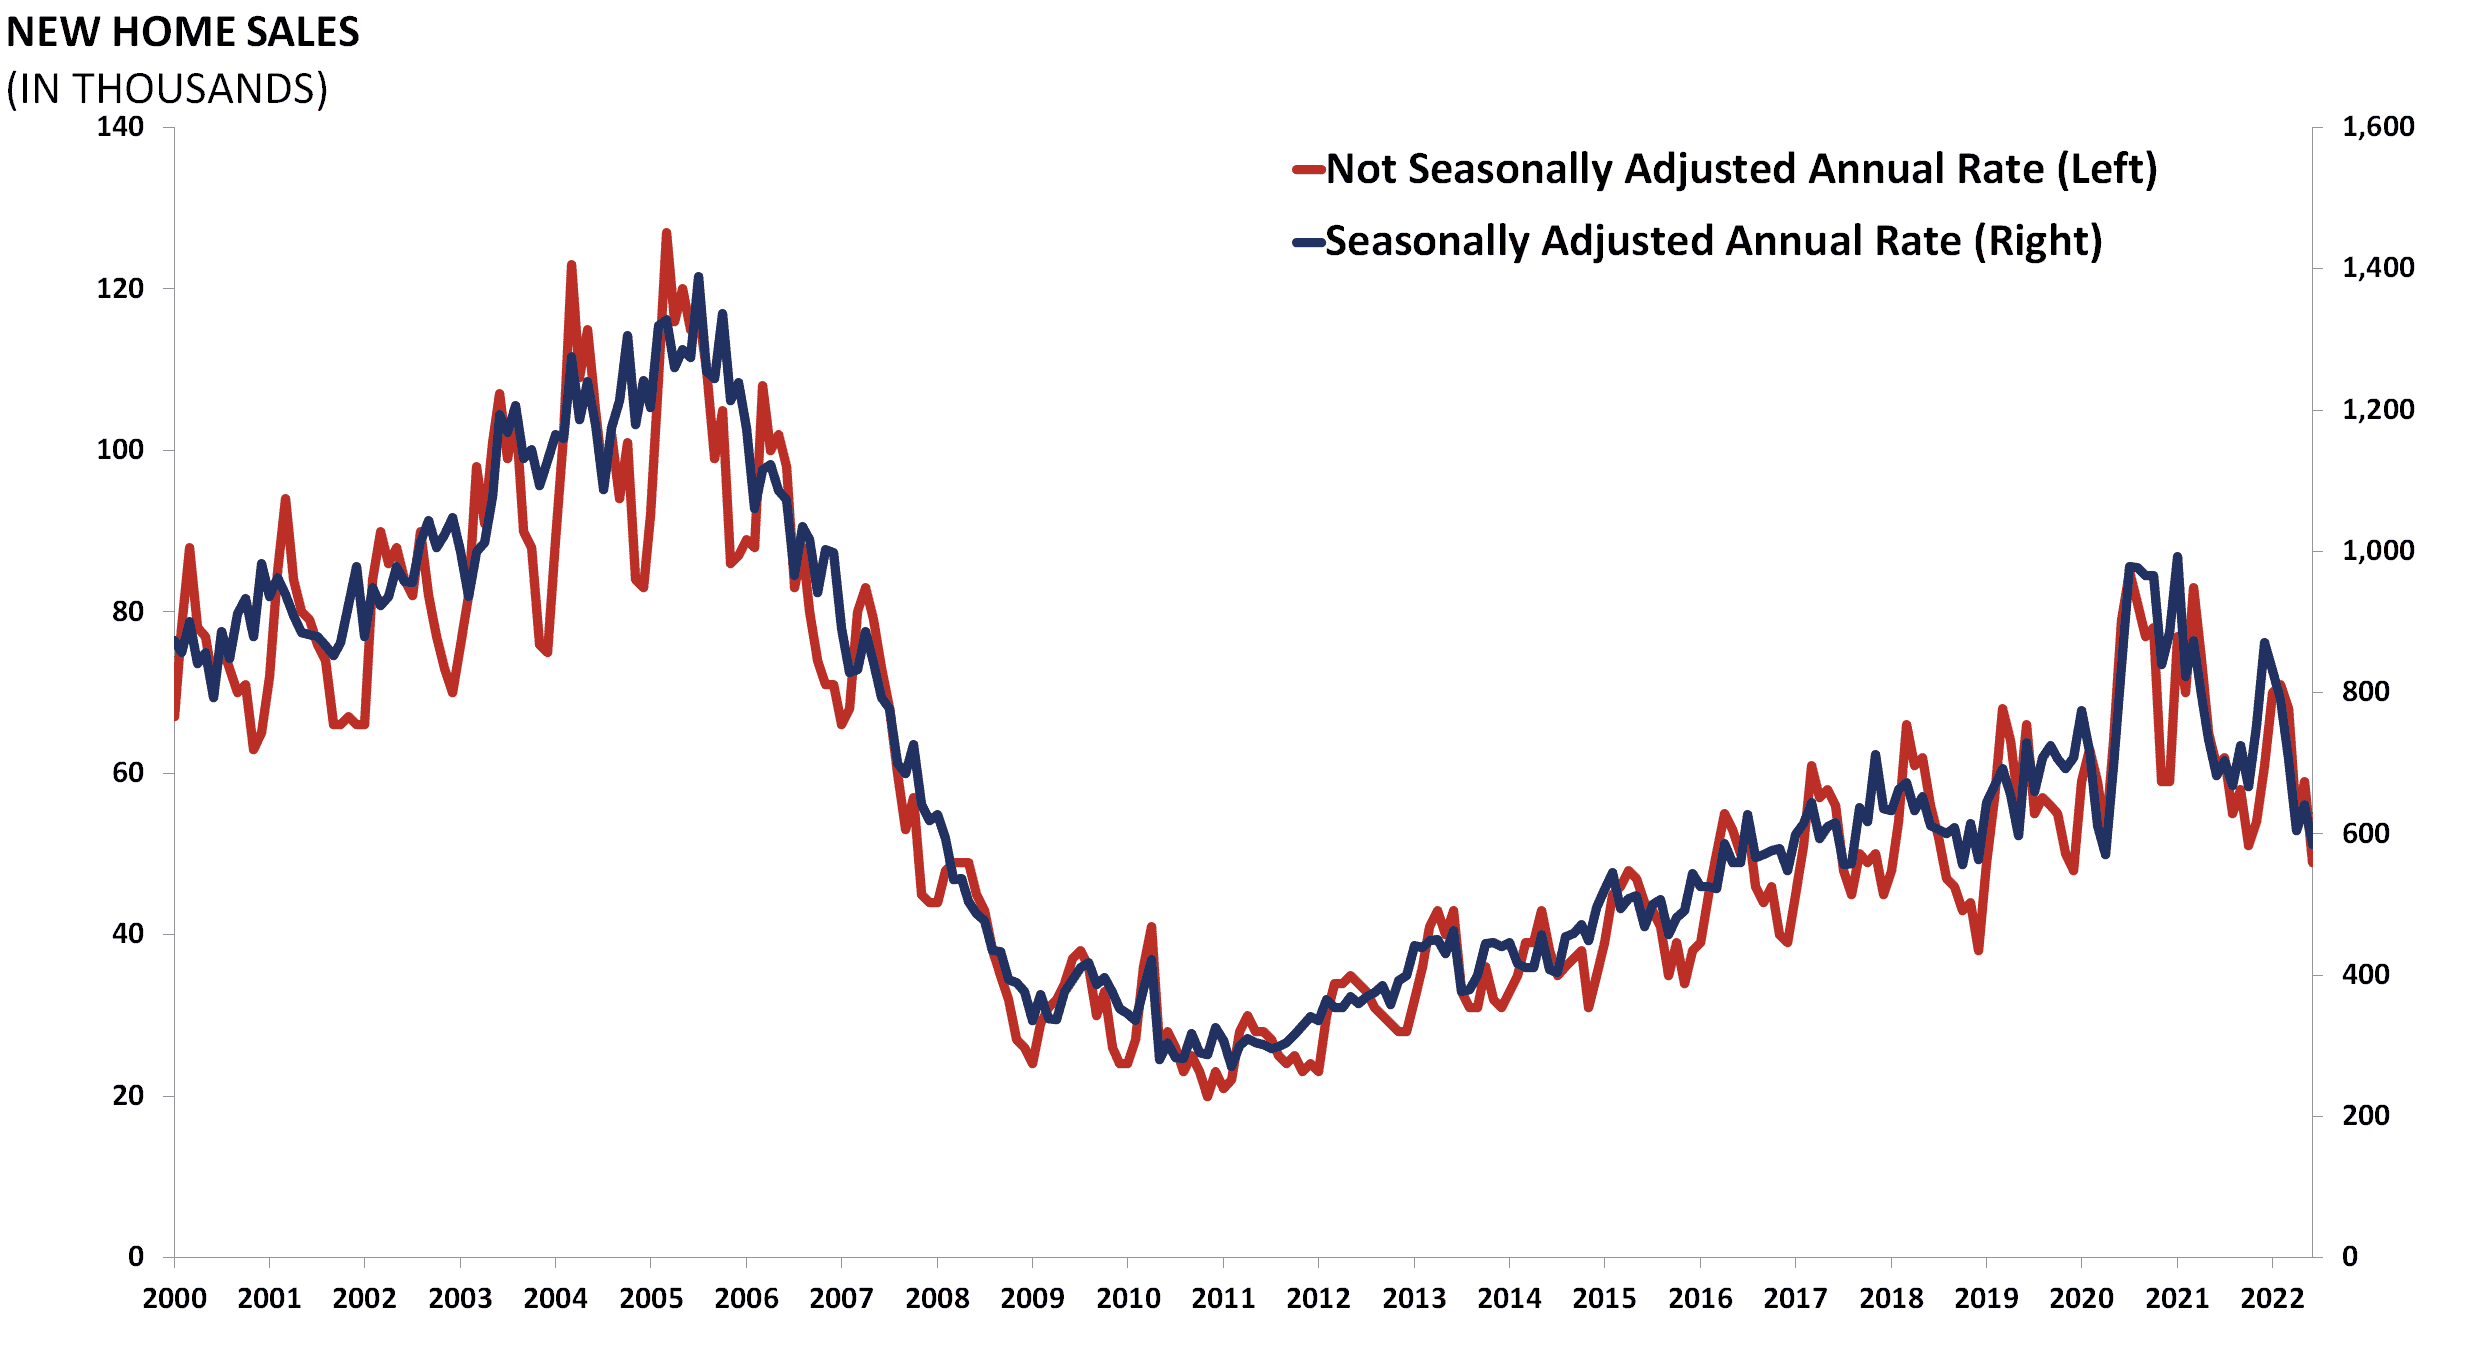
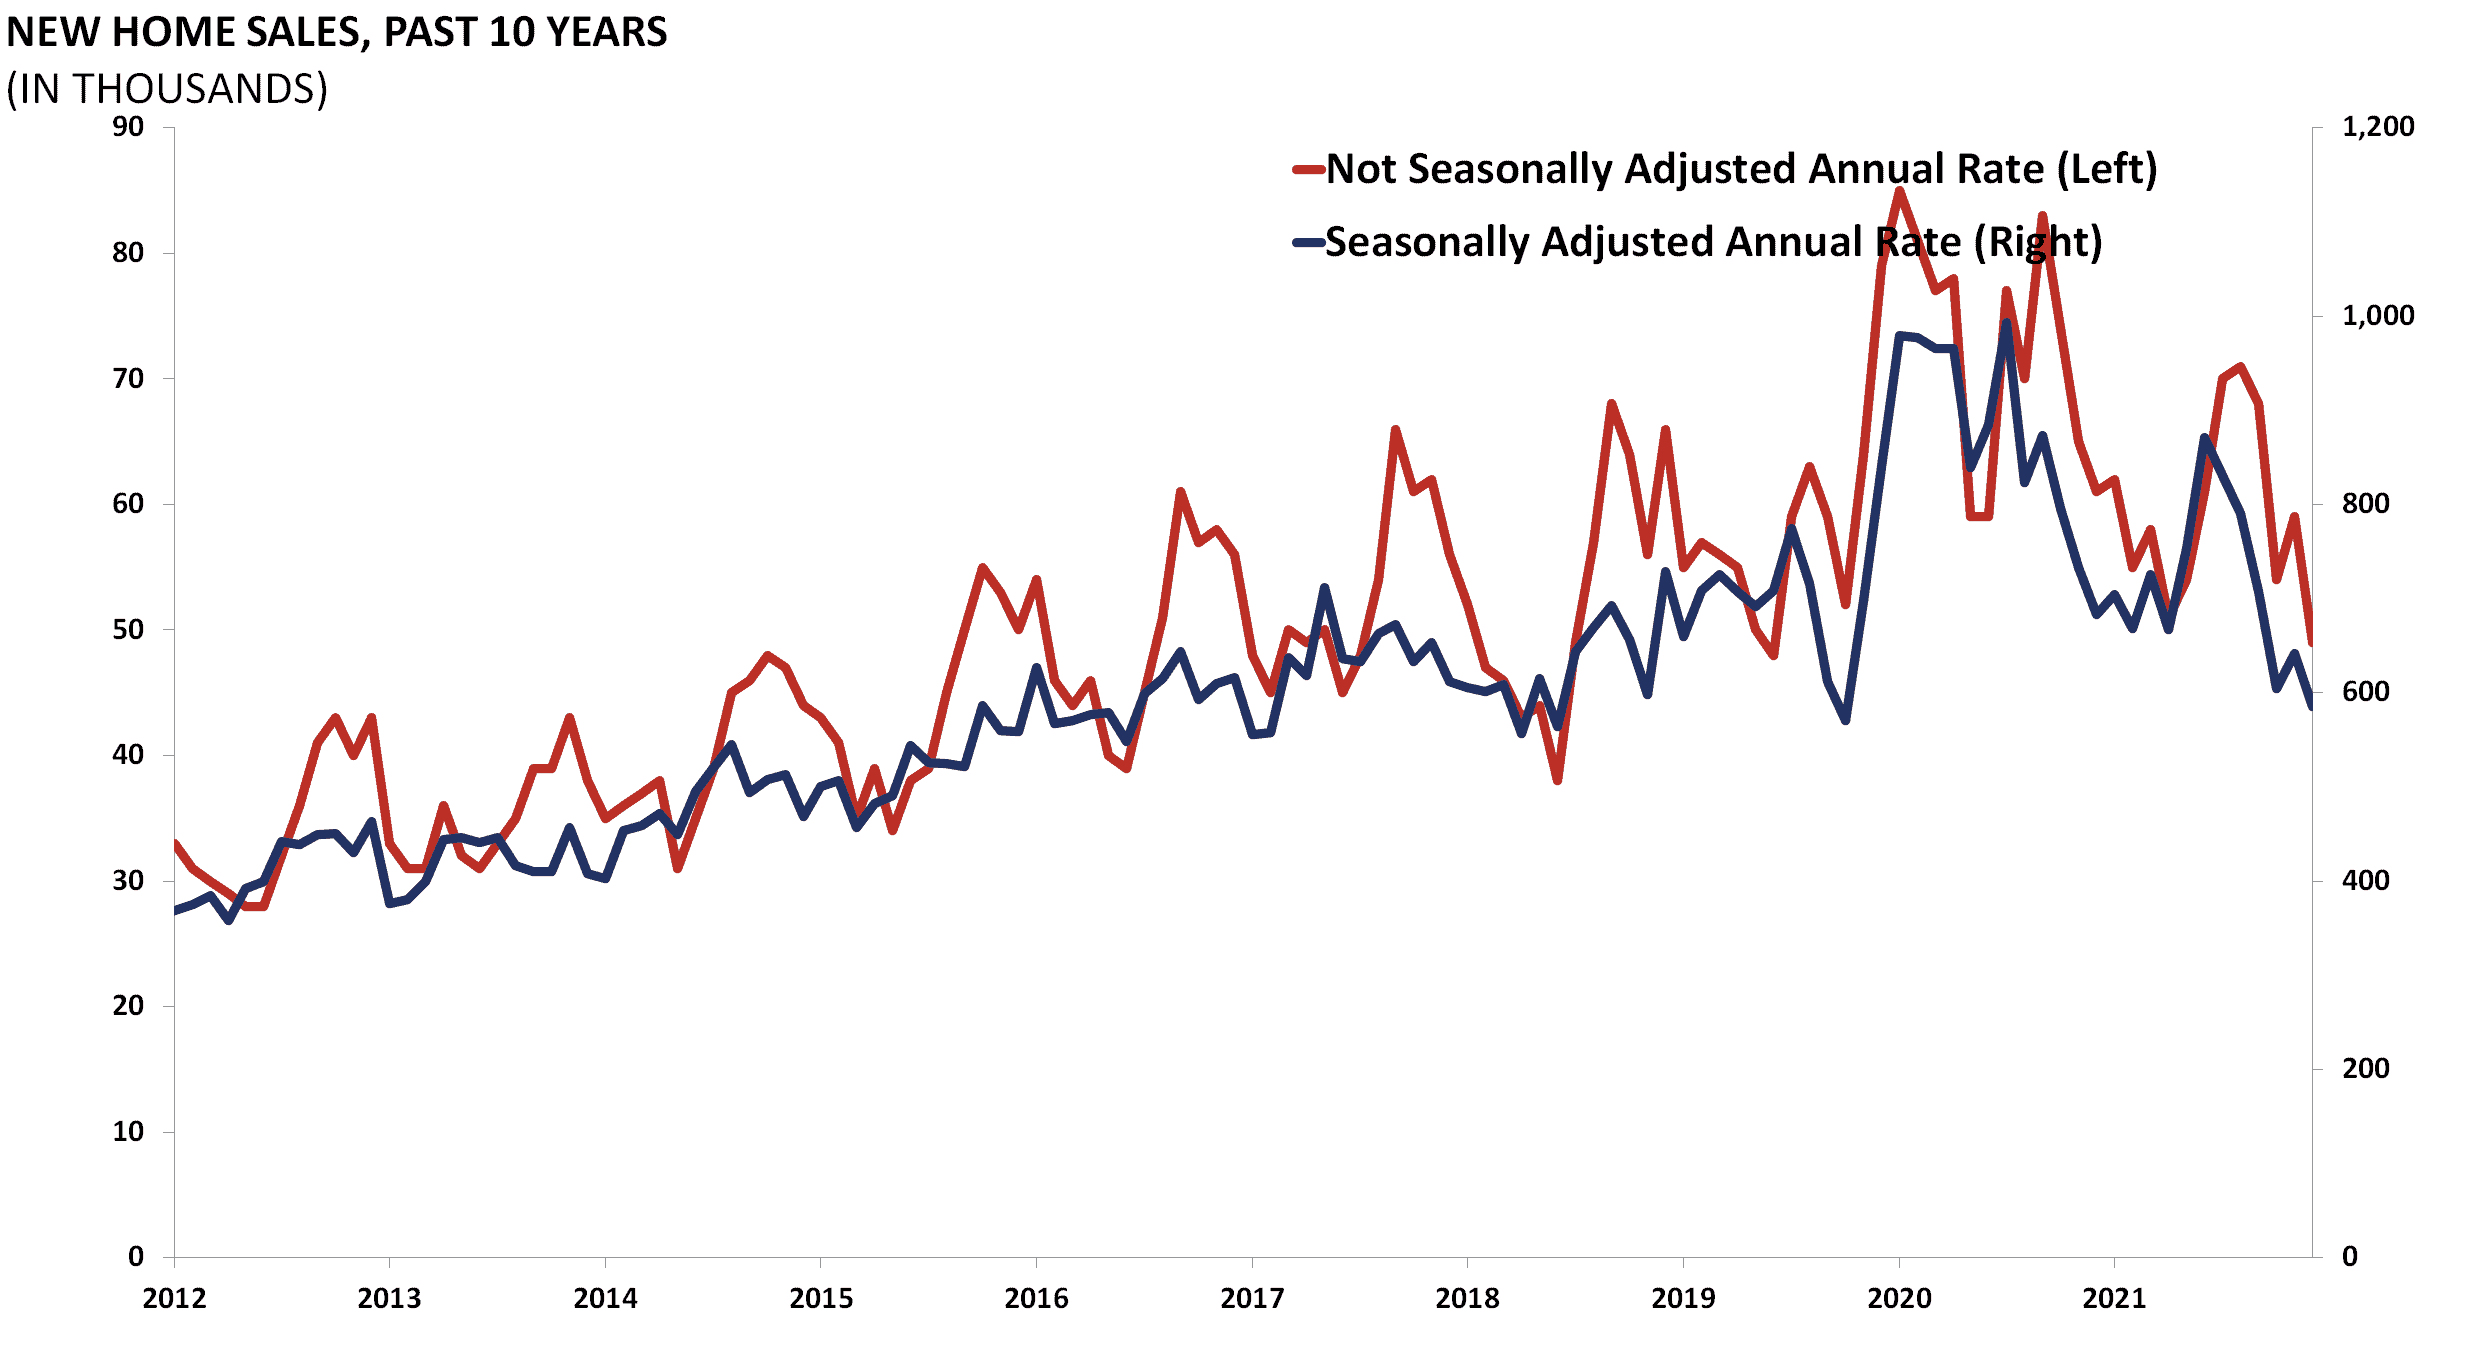
Data on new residential sales is released monthly by the Census Bureau, detailing the number of new single-family houses sold in a given month in the United States.
Source: http://www.census.gov/construction/nrs/
Data Release: http://www.census.gov/construction/nrs/pdf/newressales.pdf
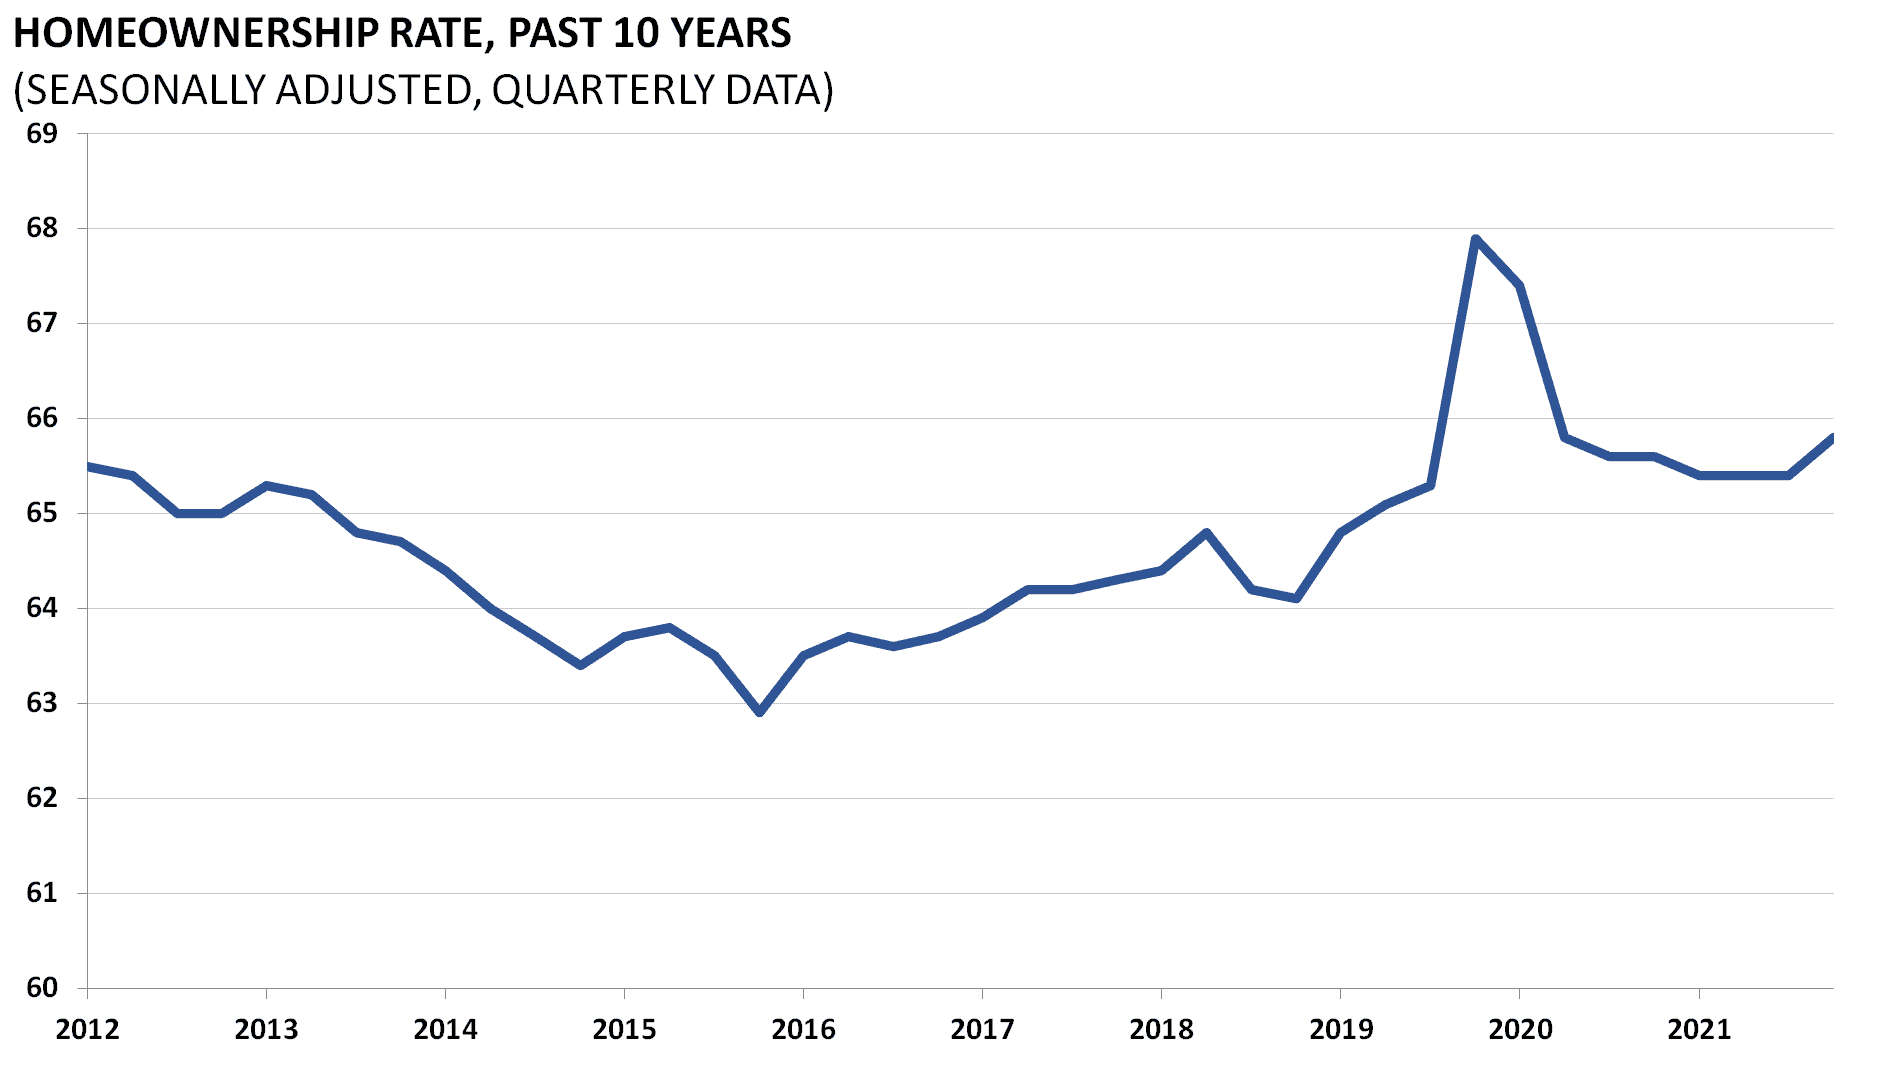
Federal policy has long played a role in homeownership. The homeownership rate, released by the Census Bureau quarterly, is an important indicator for the larger economy because of the outlying effects of homeownership. With the rising trend towards rental housing, the homeownership rate has been watched even more closely. It is calculated by dividing all owner-occupied units by the total number of occupied housing units in the United States.
Source: http://www.census.gov/housing/hvs/data/histtabs.html
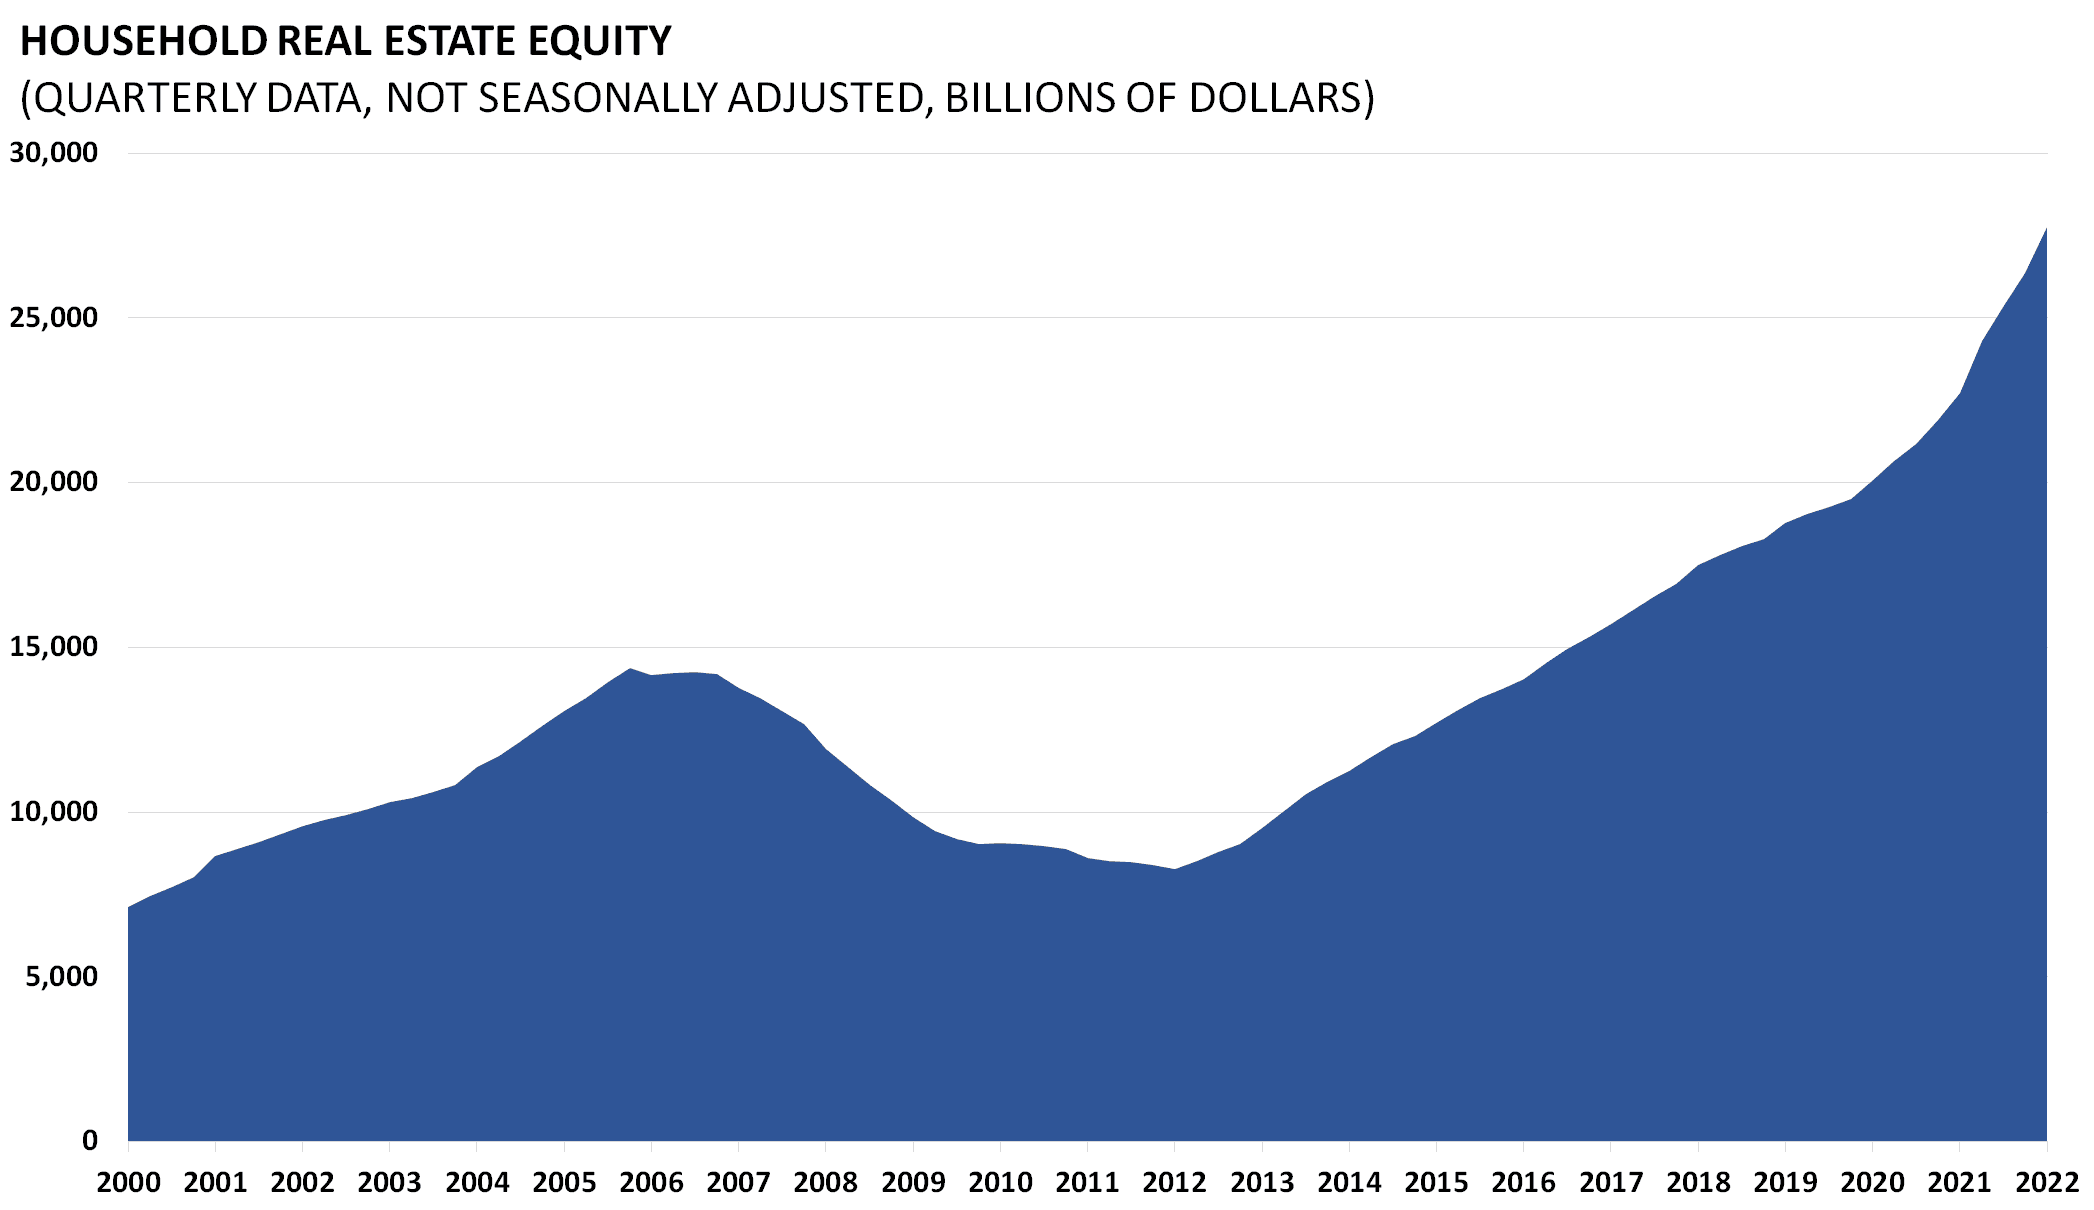
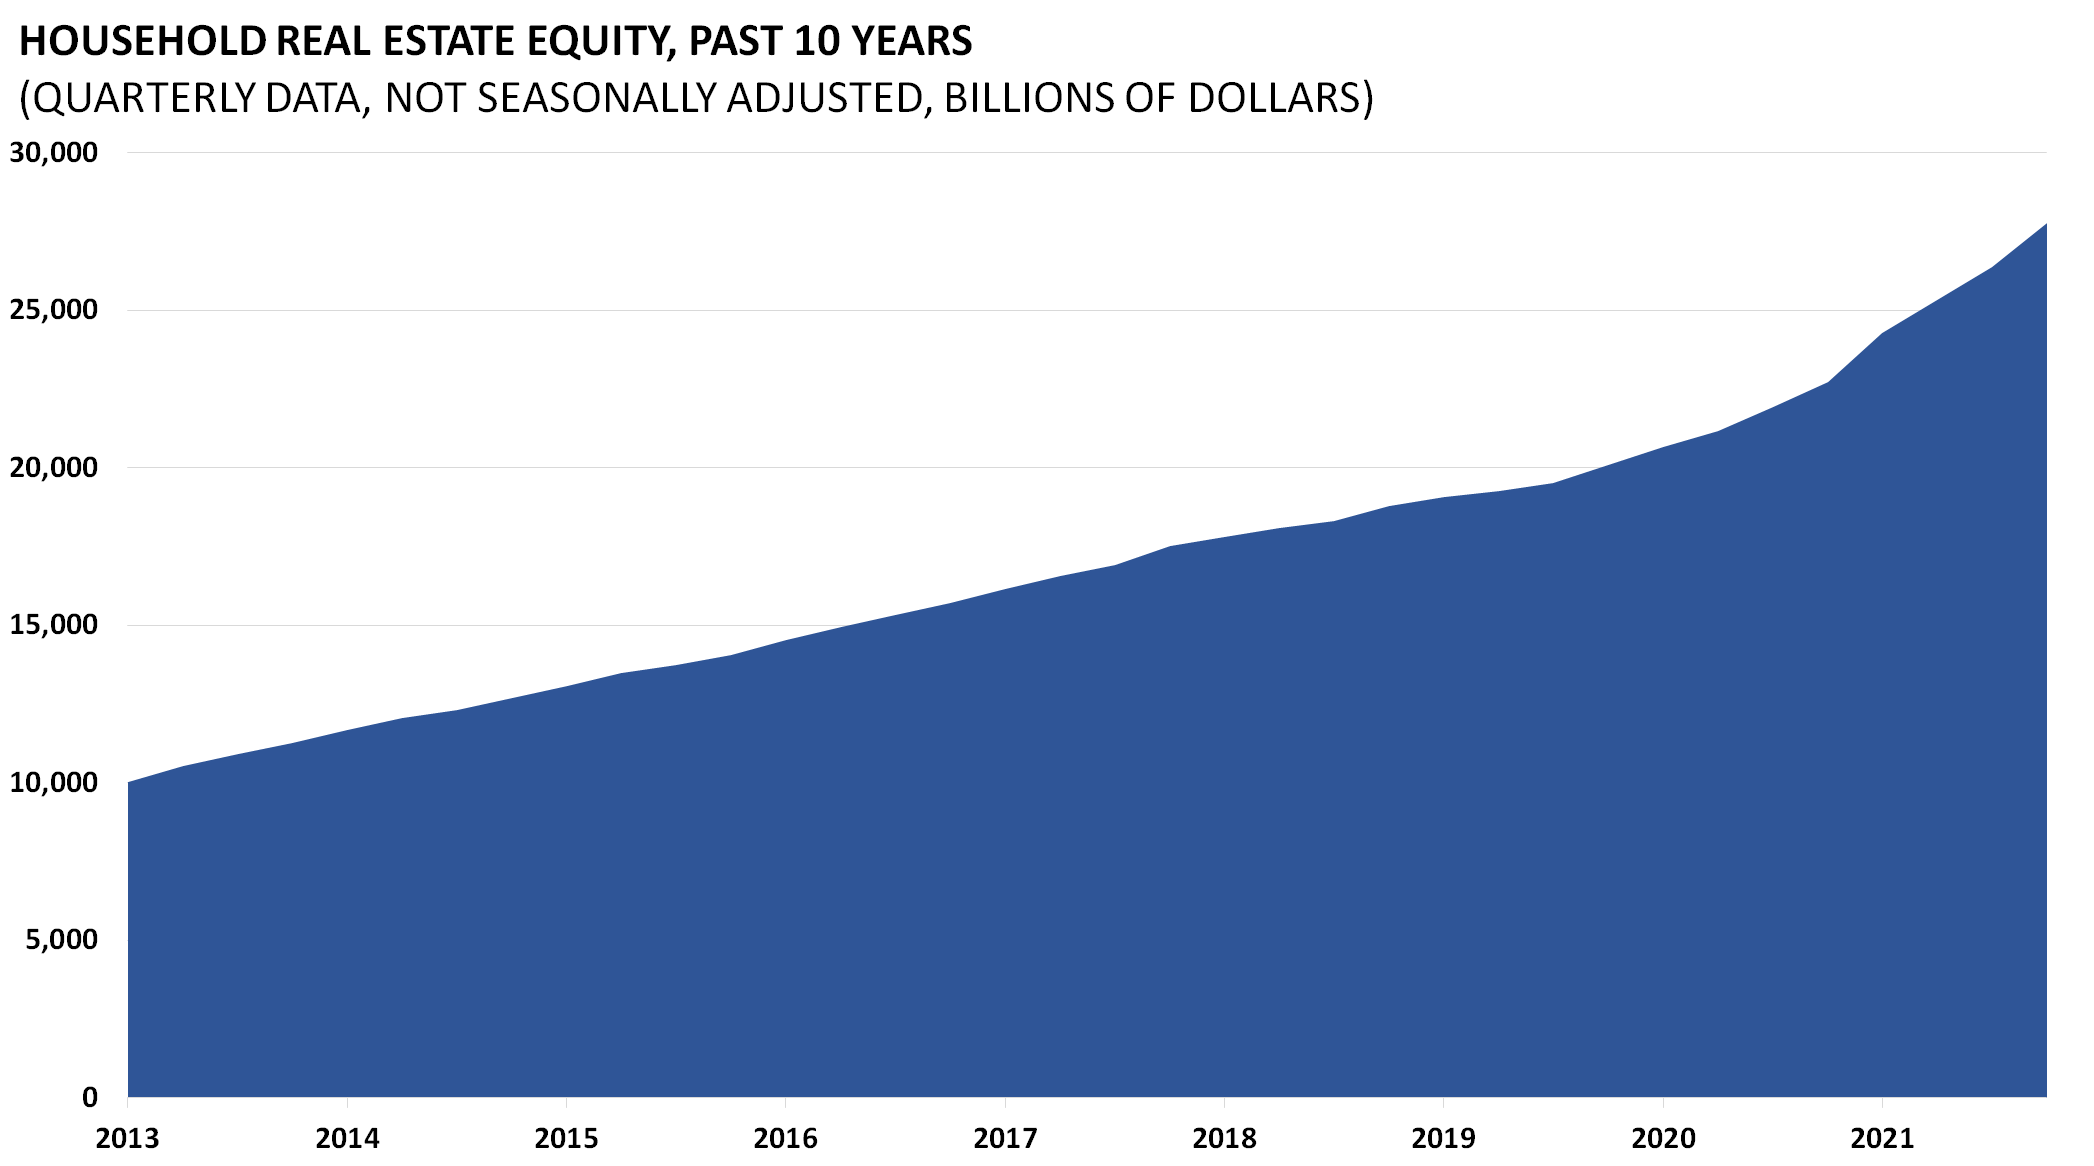
The amount of household real estate equity is the total net worth of household real estate holdings in the United States. As home prices plummeted with the bursting of the housing bubble, home equity plummeted. The loss in equity cannot be regained without economic growth and higher home prices. Household home equity data is released quarterly as part of the Z.1 Flow of Funds Accounts of the United States by the Board of Governors of the Federal Reserve System.
Source: http://research.stlouisfed.org/fred2/series/OEHRENWBSHNO
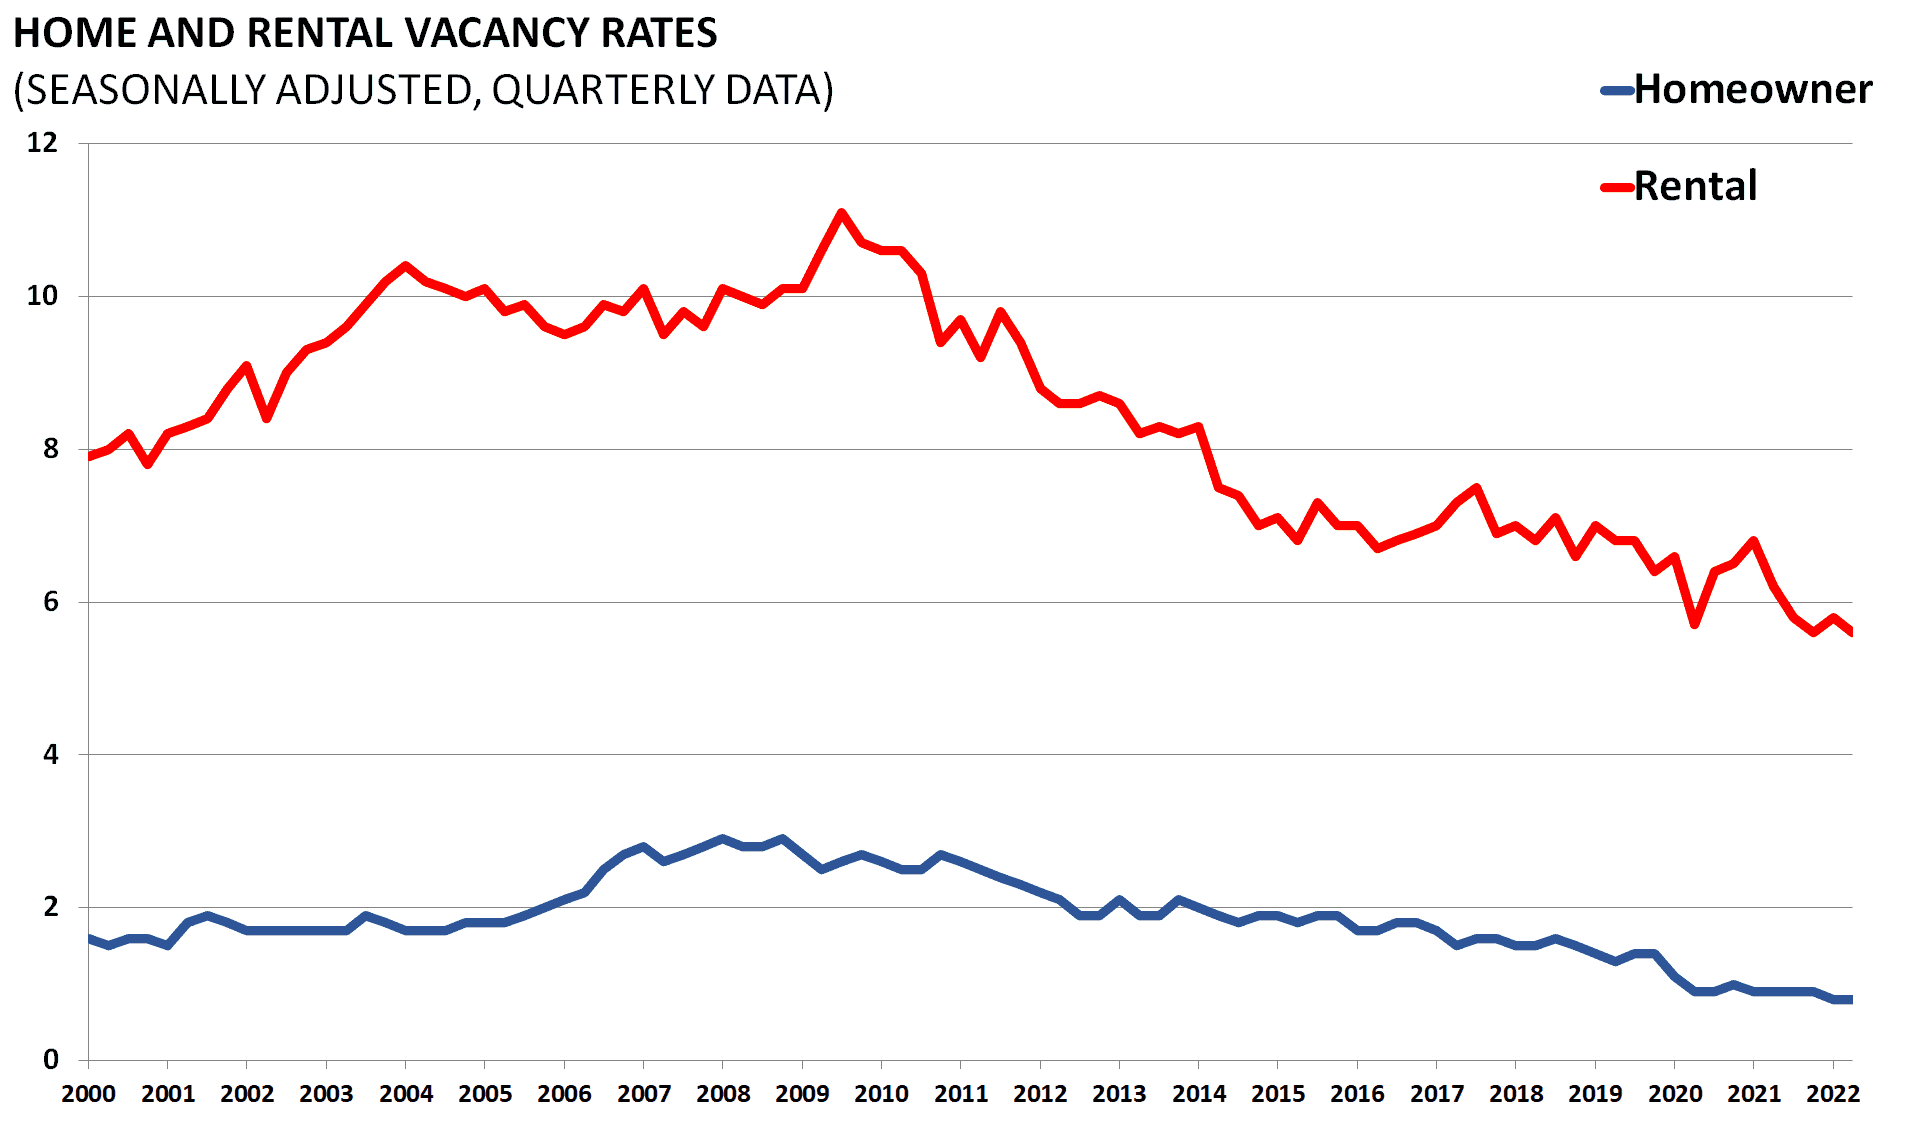
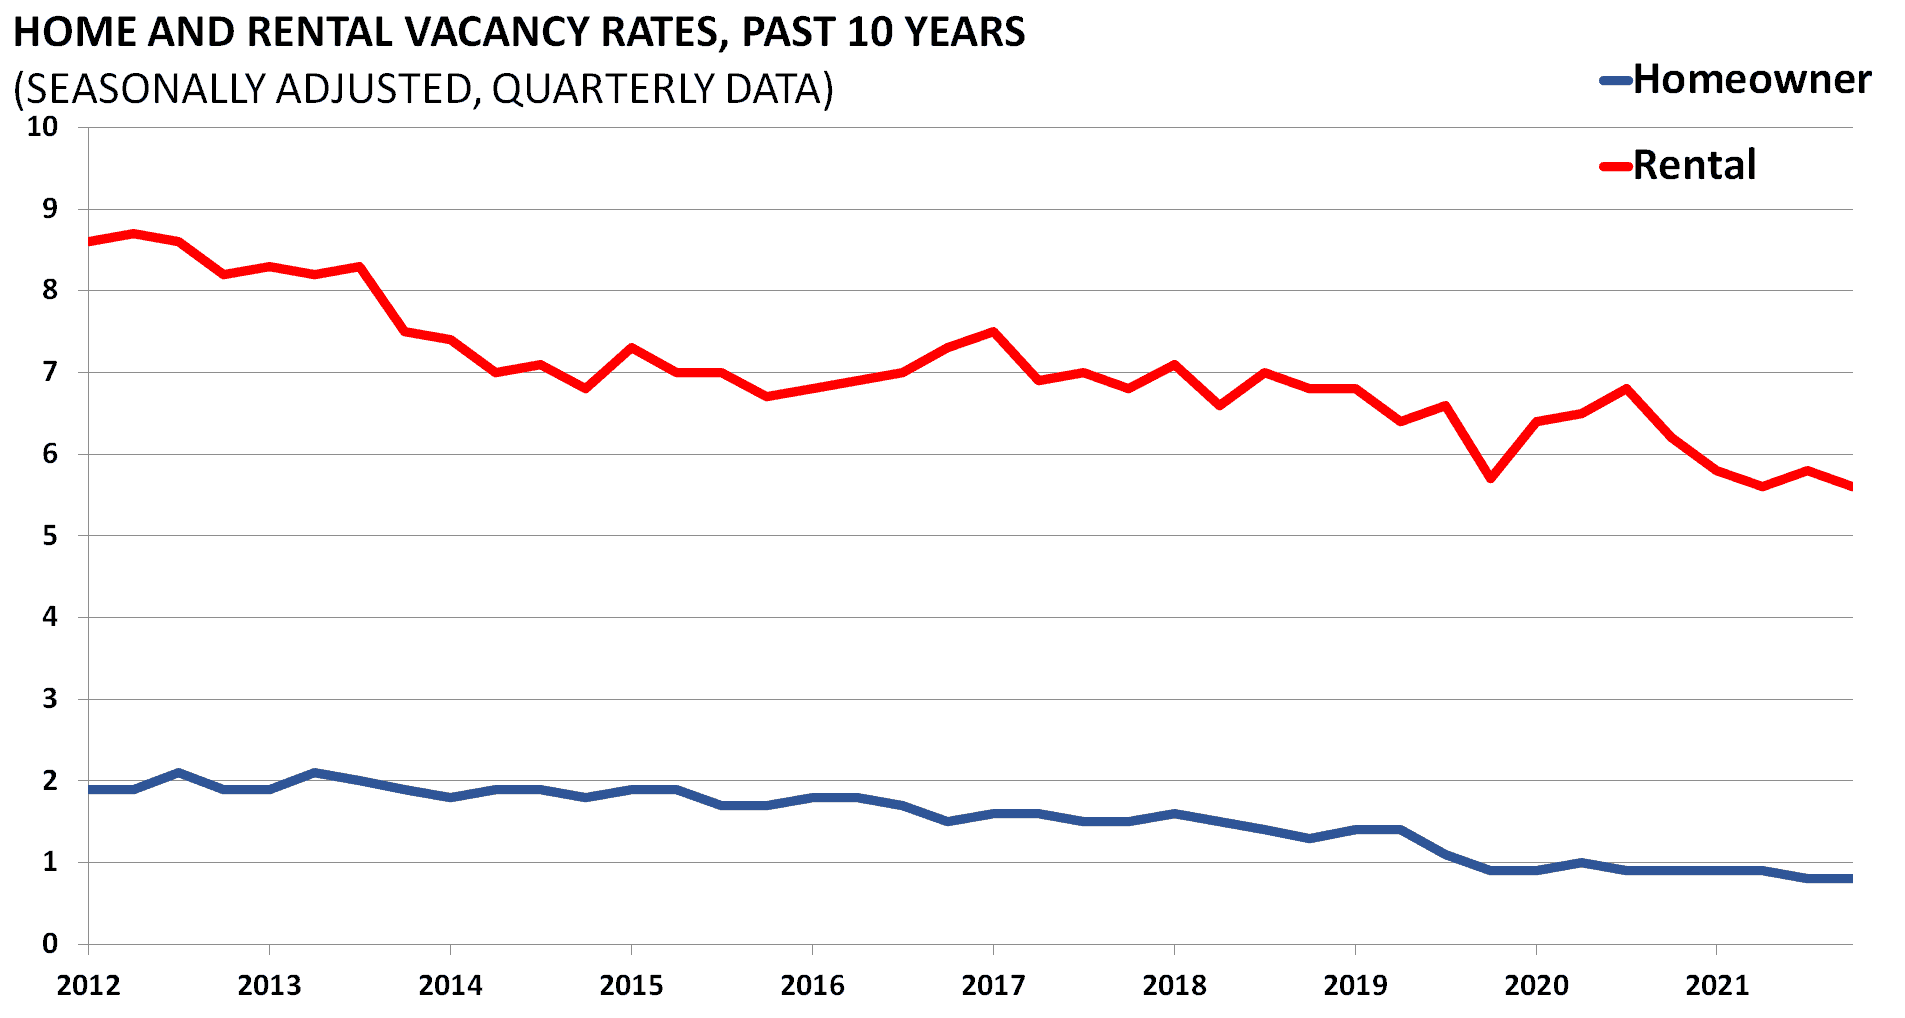
Both the Home and Rental Vacancies are important economic indicators. They gauge the economic climate by estimating the percentage of vacant units among all housing inventory.
Source: http://www.census.gov/housing/hvs/data/histtabs.html
Mortgages


Insofar as home ownership is a key contributing factor to the health of the US economy, the mortgages that back home loans are a positive indicator of the strength of the housing market.
Source: https://ycharts.com/indicators/mortgage_originations
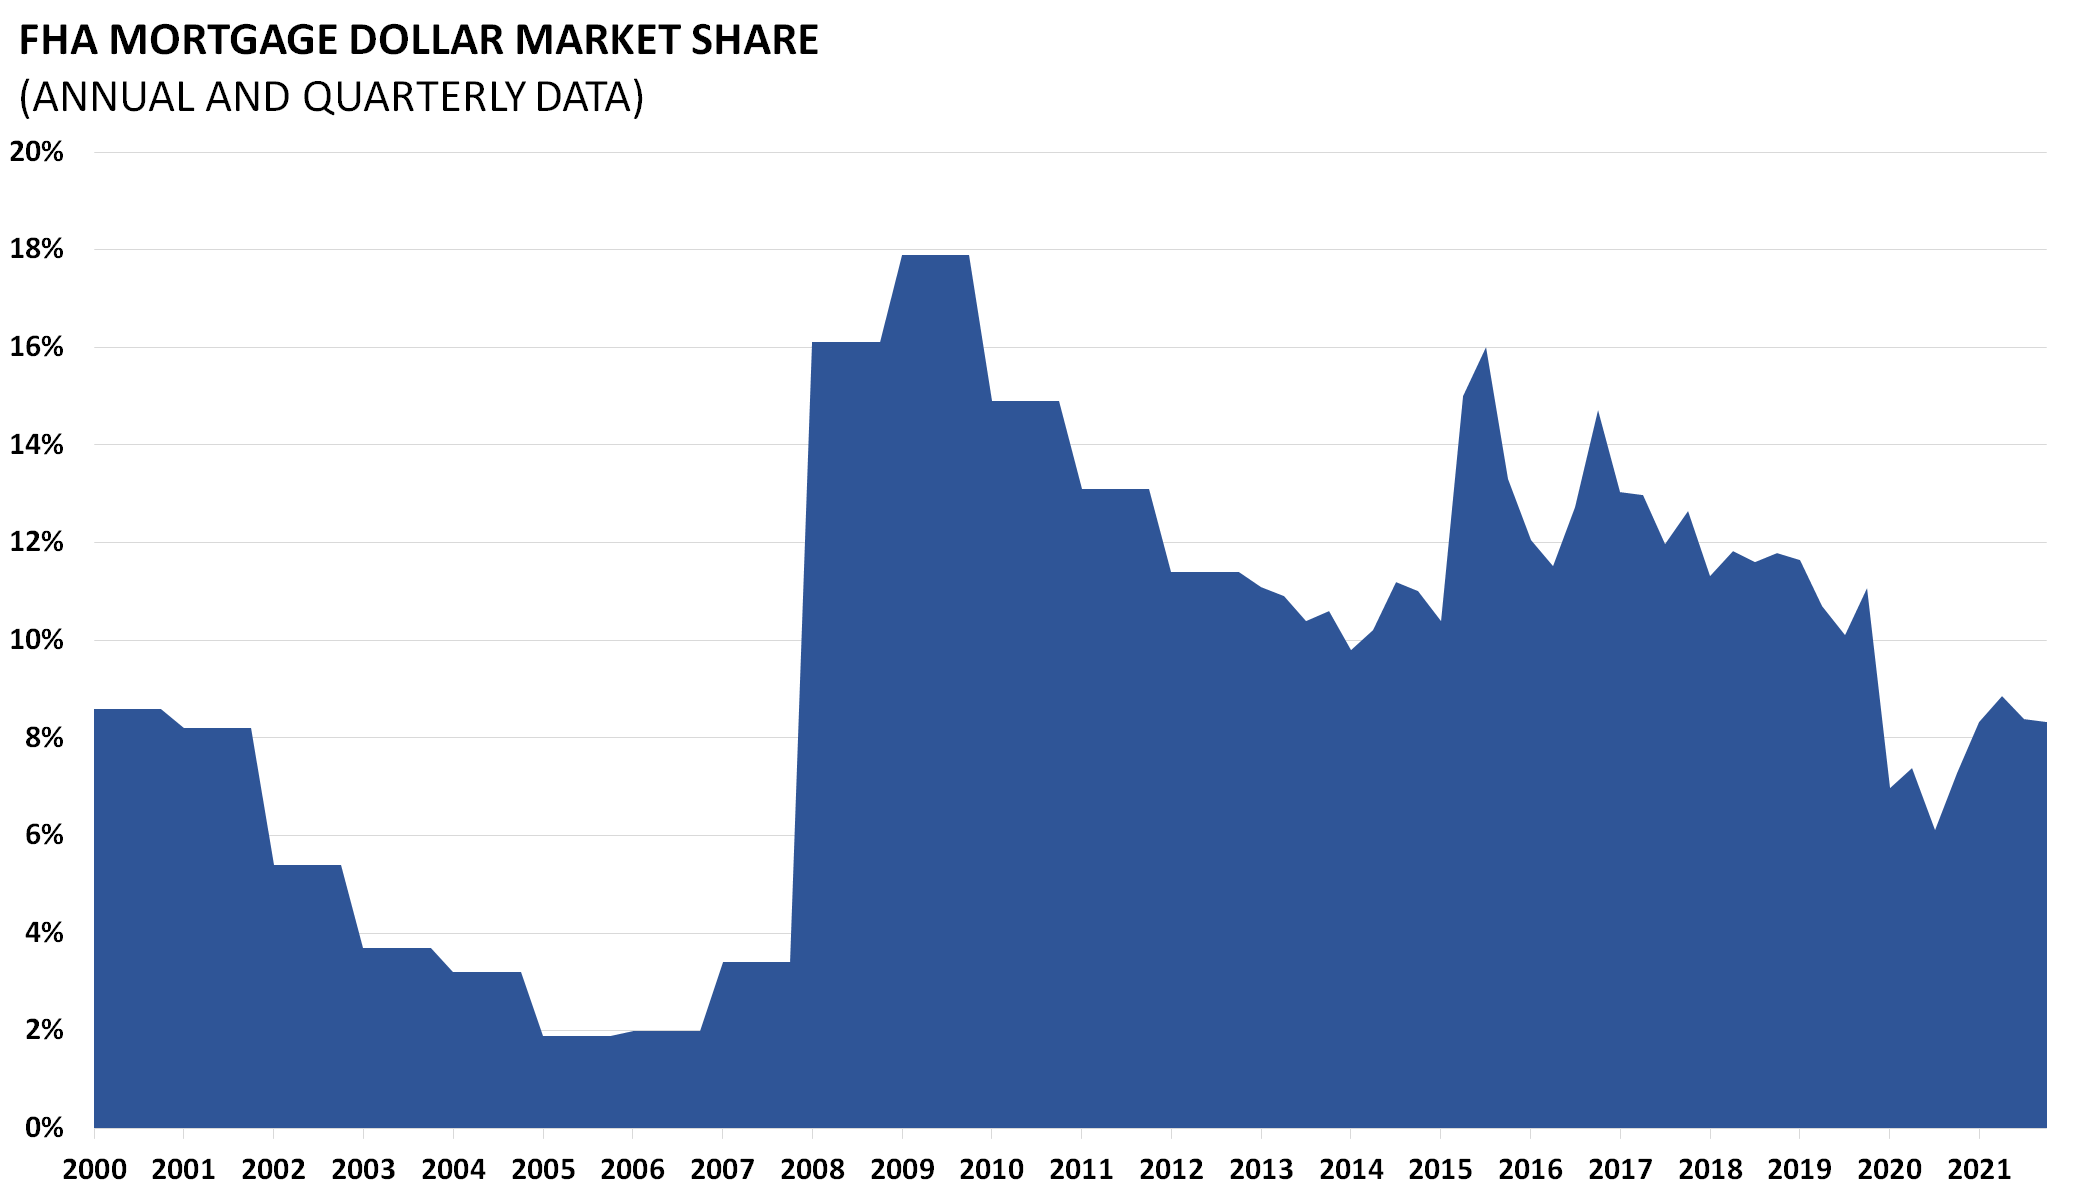
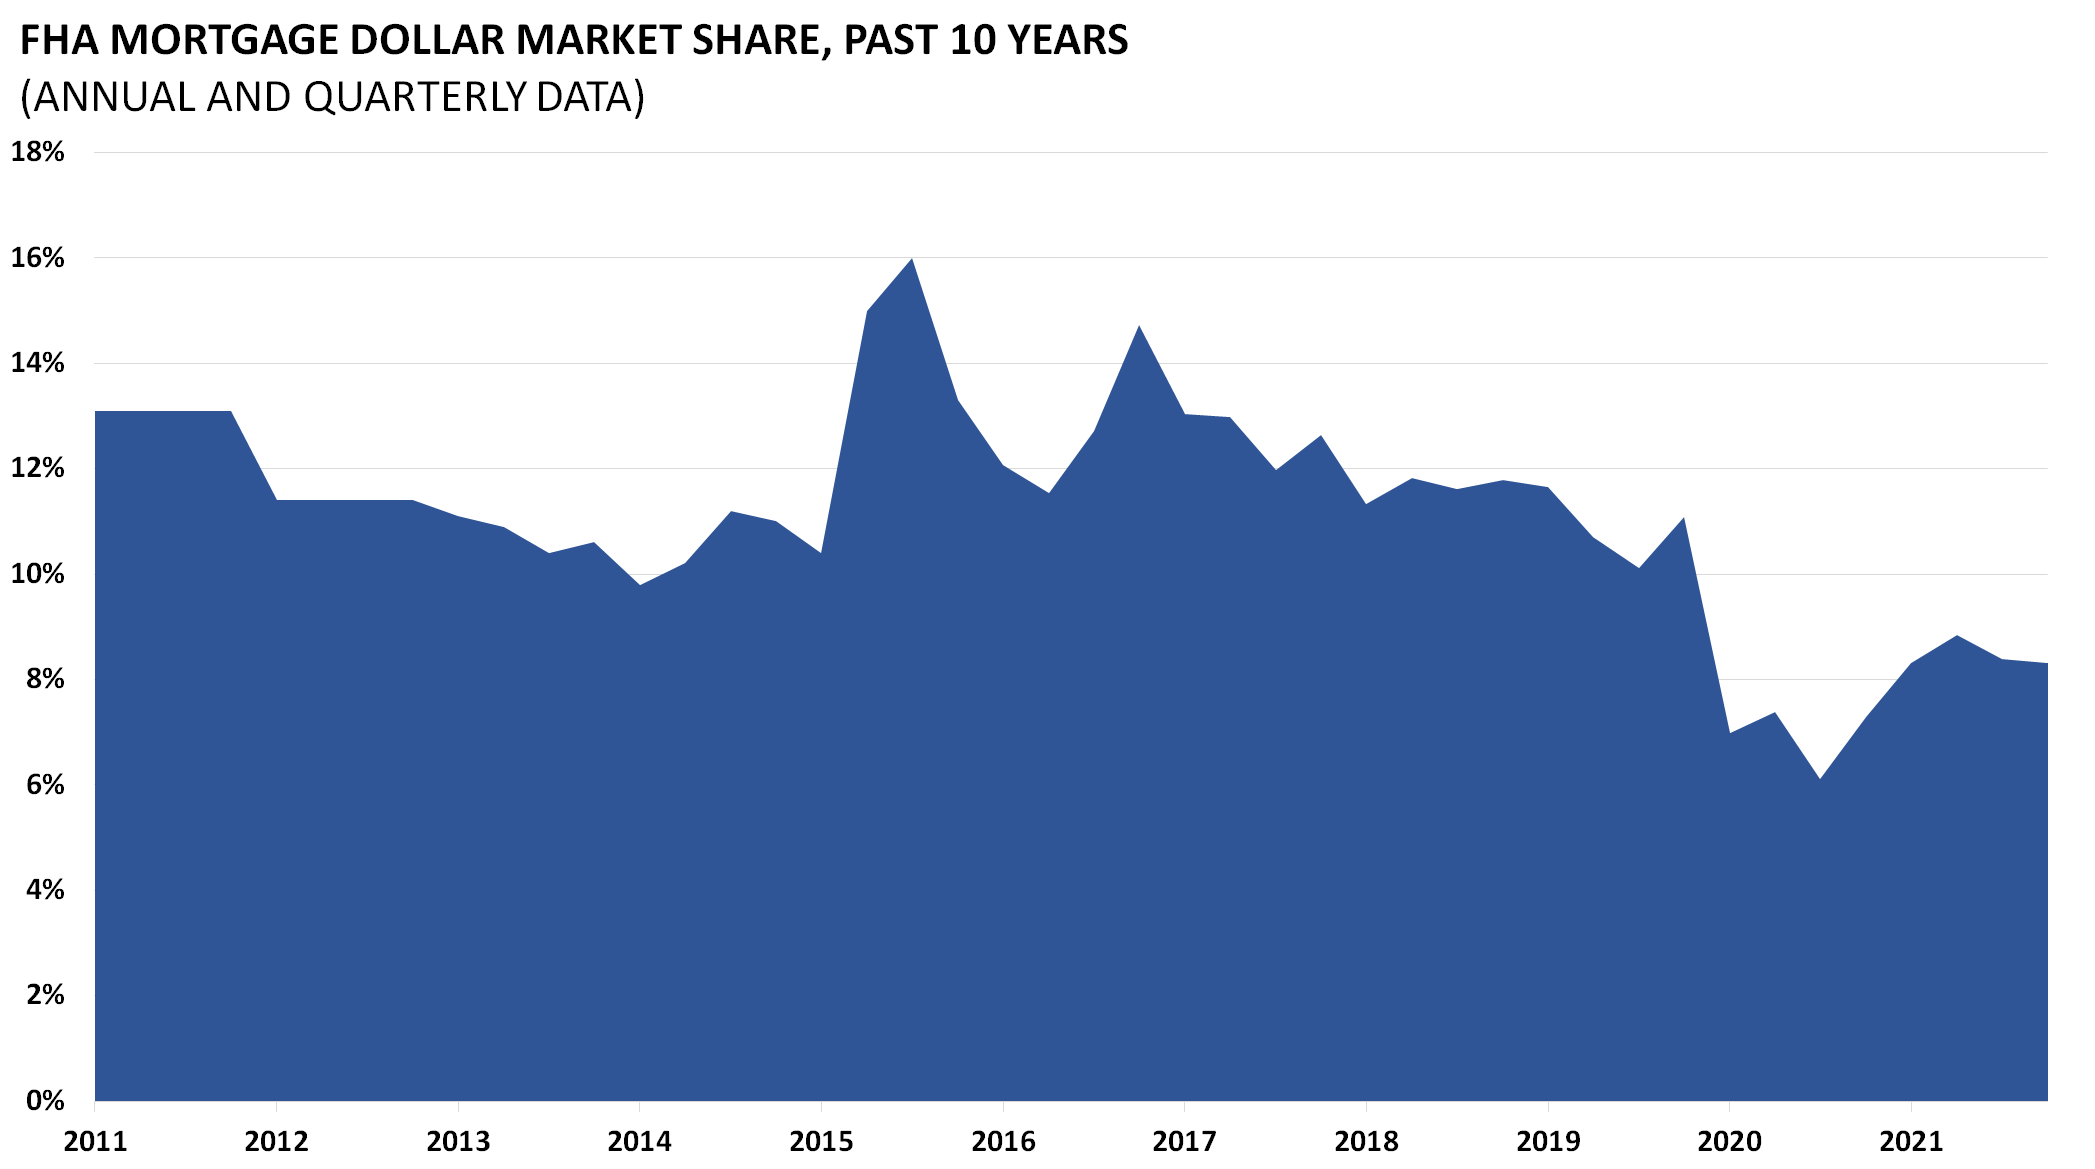
The Federal Housing Administration insures private mortgage lenders against the possibility of default. FHA insured loans are a form of federal assistance. The FHA market share therefore indicates the strength of private versus public mortgage insurance.
Source: http://portal.hud.gov/hudportal/HUD?src=/program_offices/housing/rmra/oe/rpts/fhamktsh/fhamktqtrly
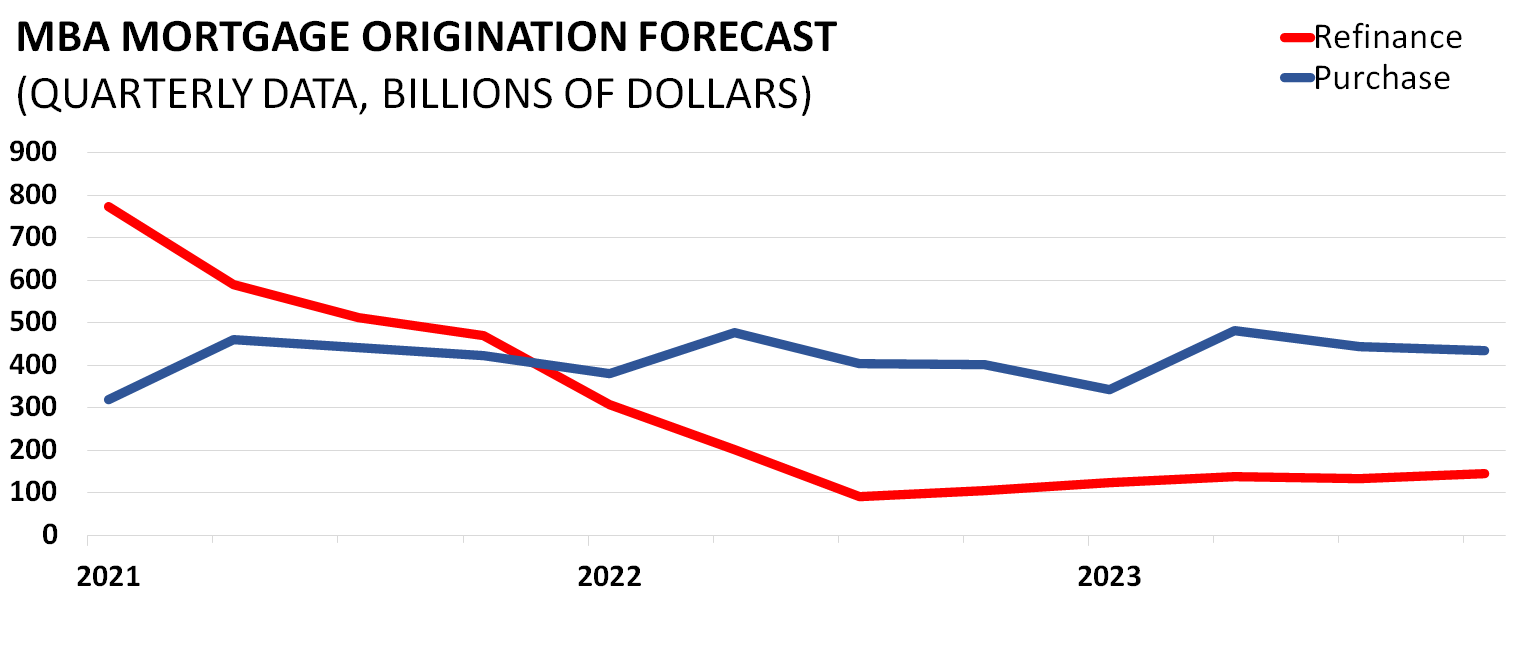
The Mortgage Bankers Association releases data on the number of mortgages that they forecast will be originated each quarter. Mortgages originations, shown in dollars, indicates the level of market activity. Divided here between original purchases and refinances provides even greater insight into the types of originations and the condition of the market recovery.
Data Release: http://www.mbaa.org/ResearchandForecasts/ForecastsandCommentary
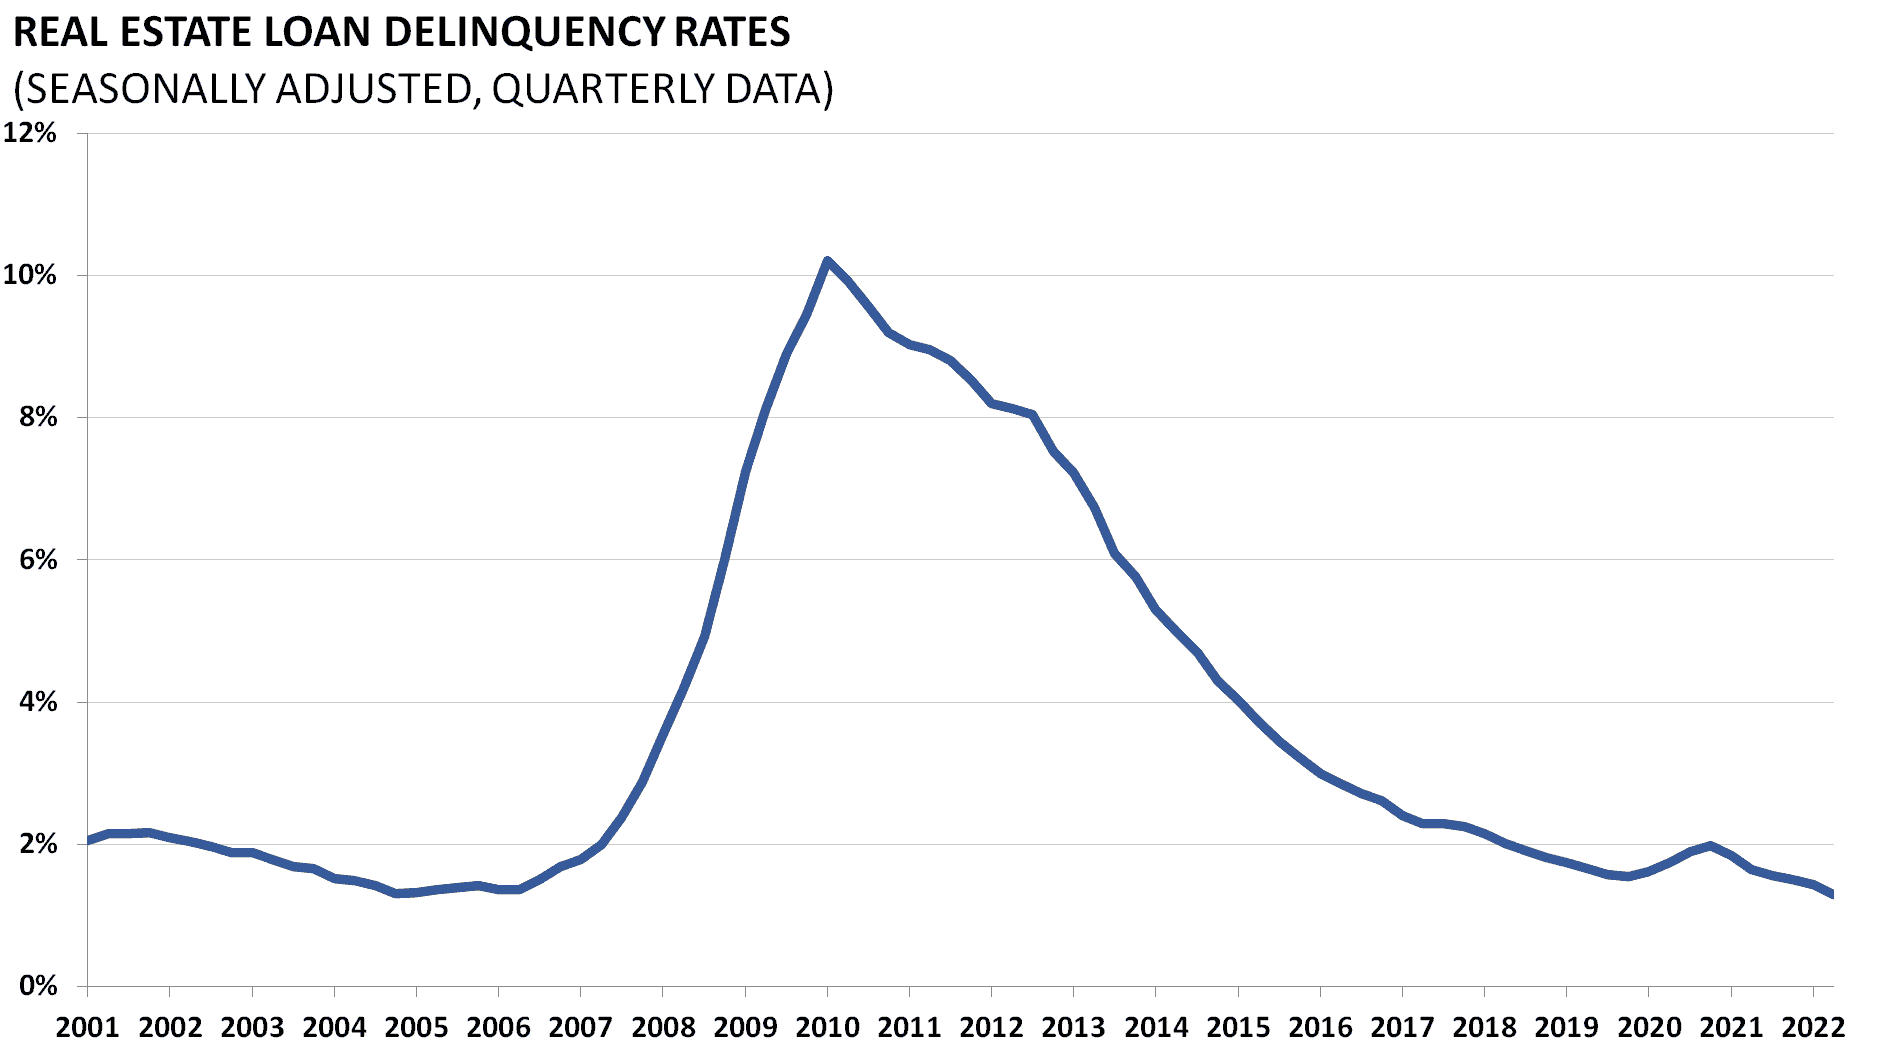
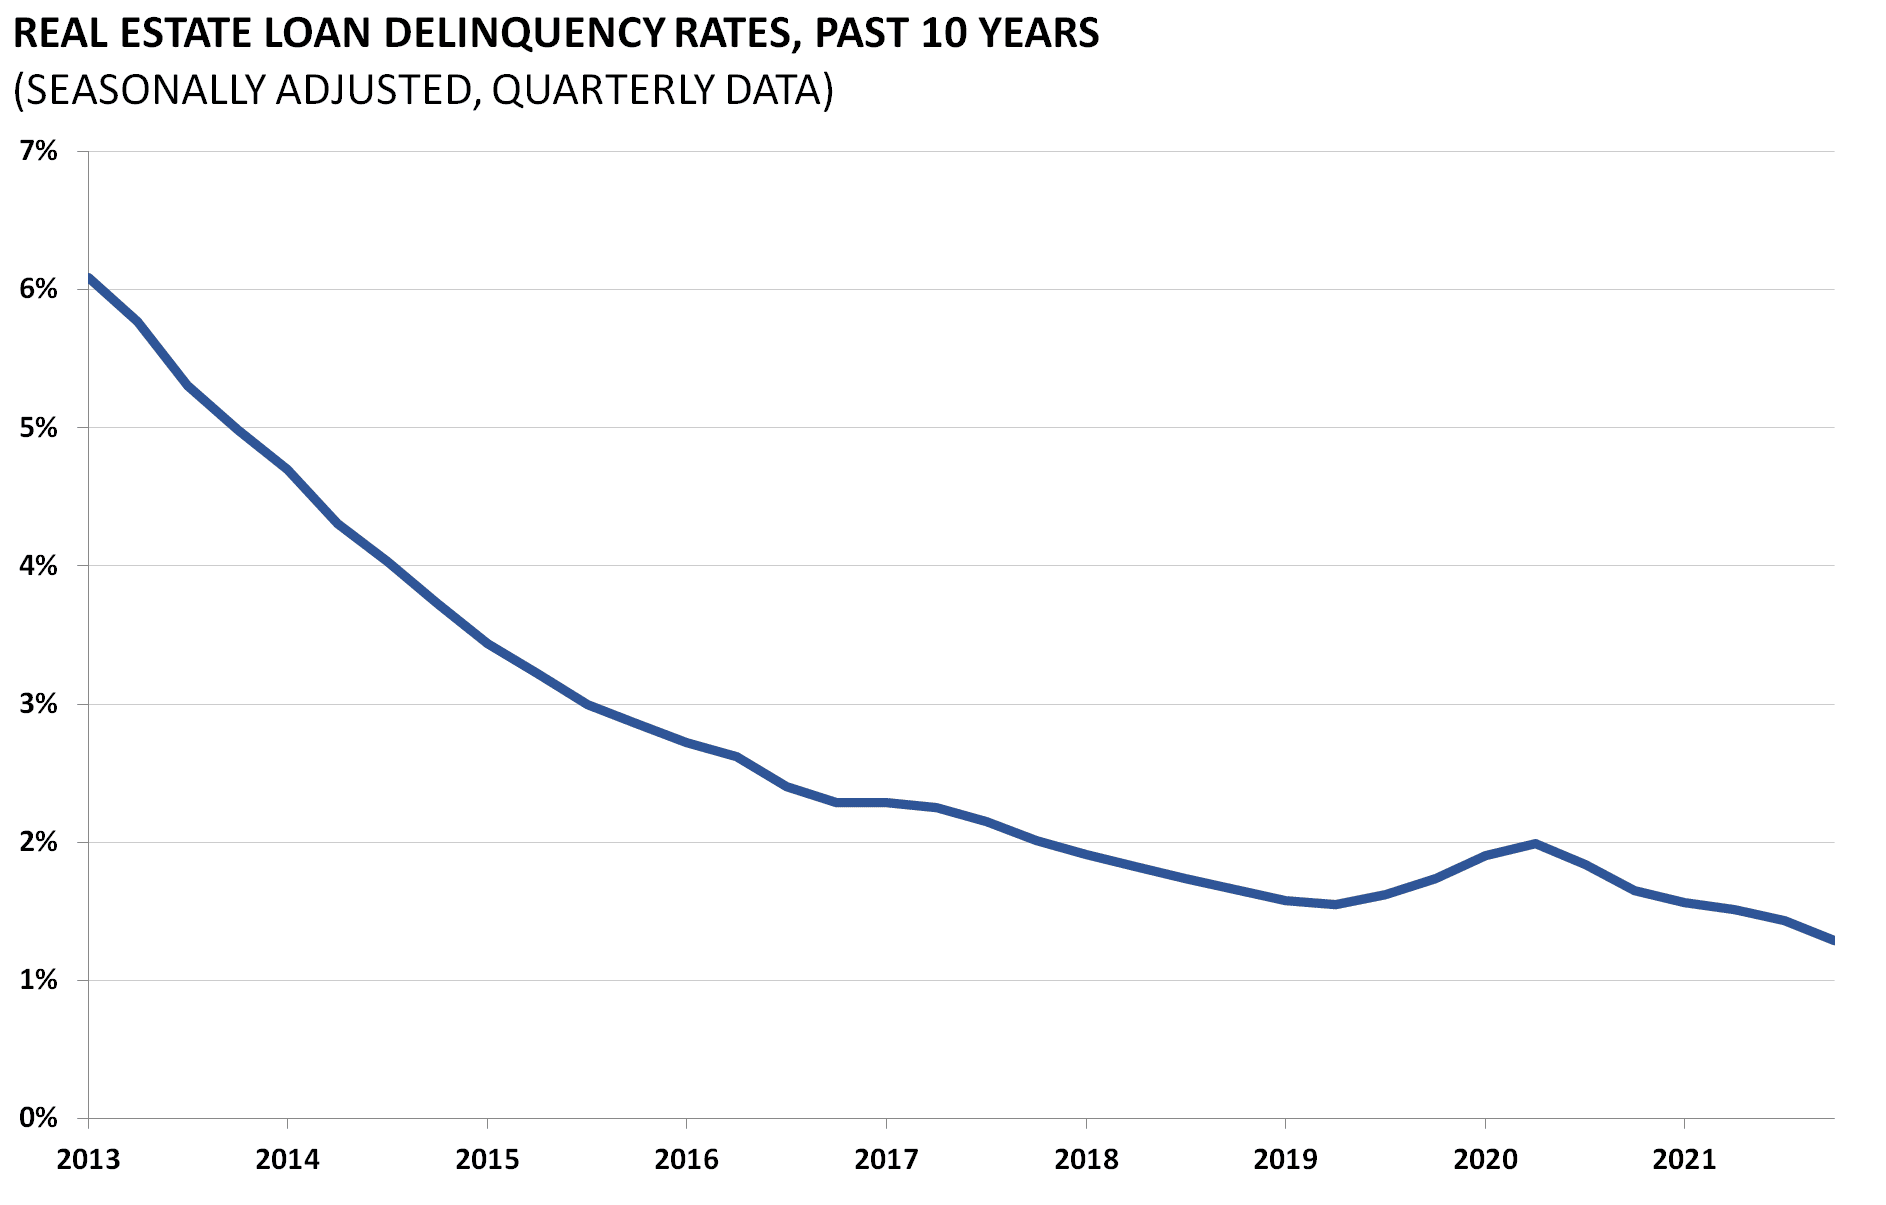
Delinquency rates on all loans secured by real estate and commercial banks are released by the Board of Governors of the Federal Reserve. Seasonally adjusted, the measure indicates the percentage of borrowers who have been unable to make timely payments on their loans. This measure is reflective of the overall economy and macroeconomic factors like unemployment. This data is released quarterly with the Fed report on “Charge-Off and Delinquency Rates on Loans and Leases at Commercial Banks.”
Source: http://research.stlouisfed.org/fred2/series/DRSREACBS
Data Release: http://www.federalreserve.gov/releases/chargeoff/default.htm
Construction
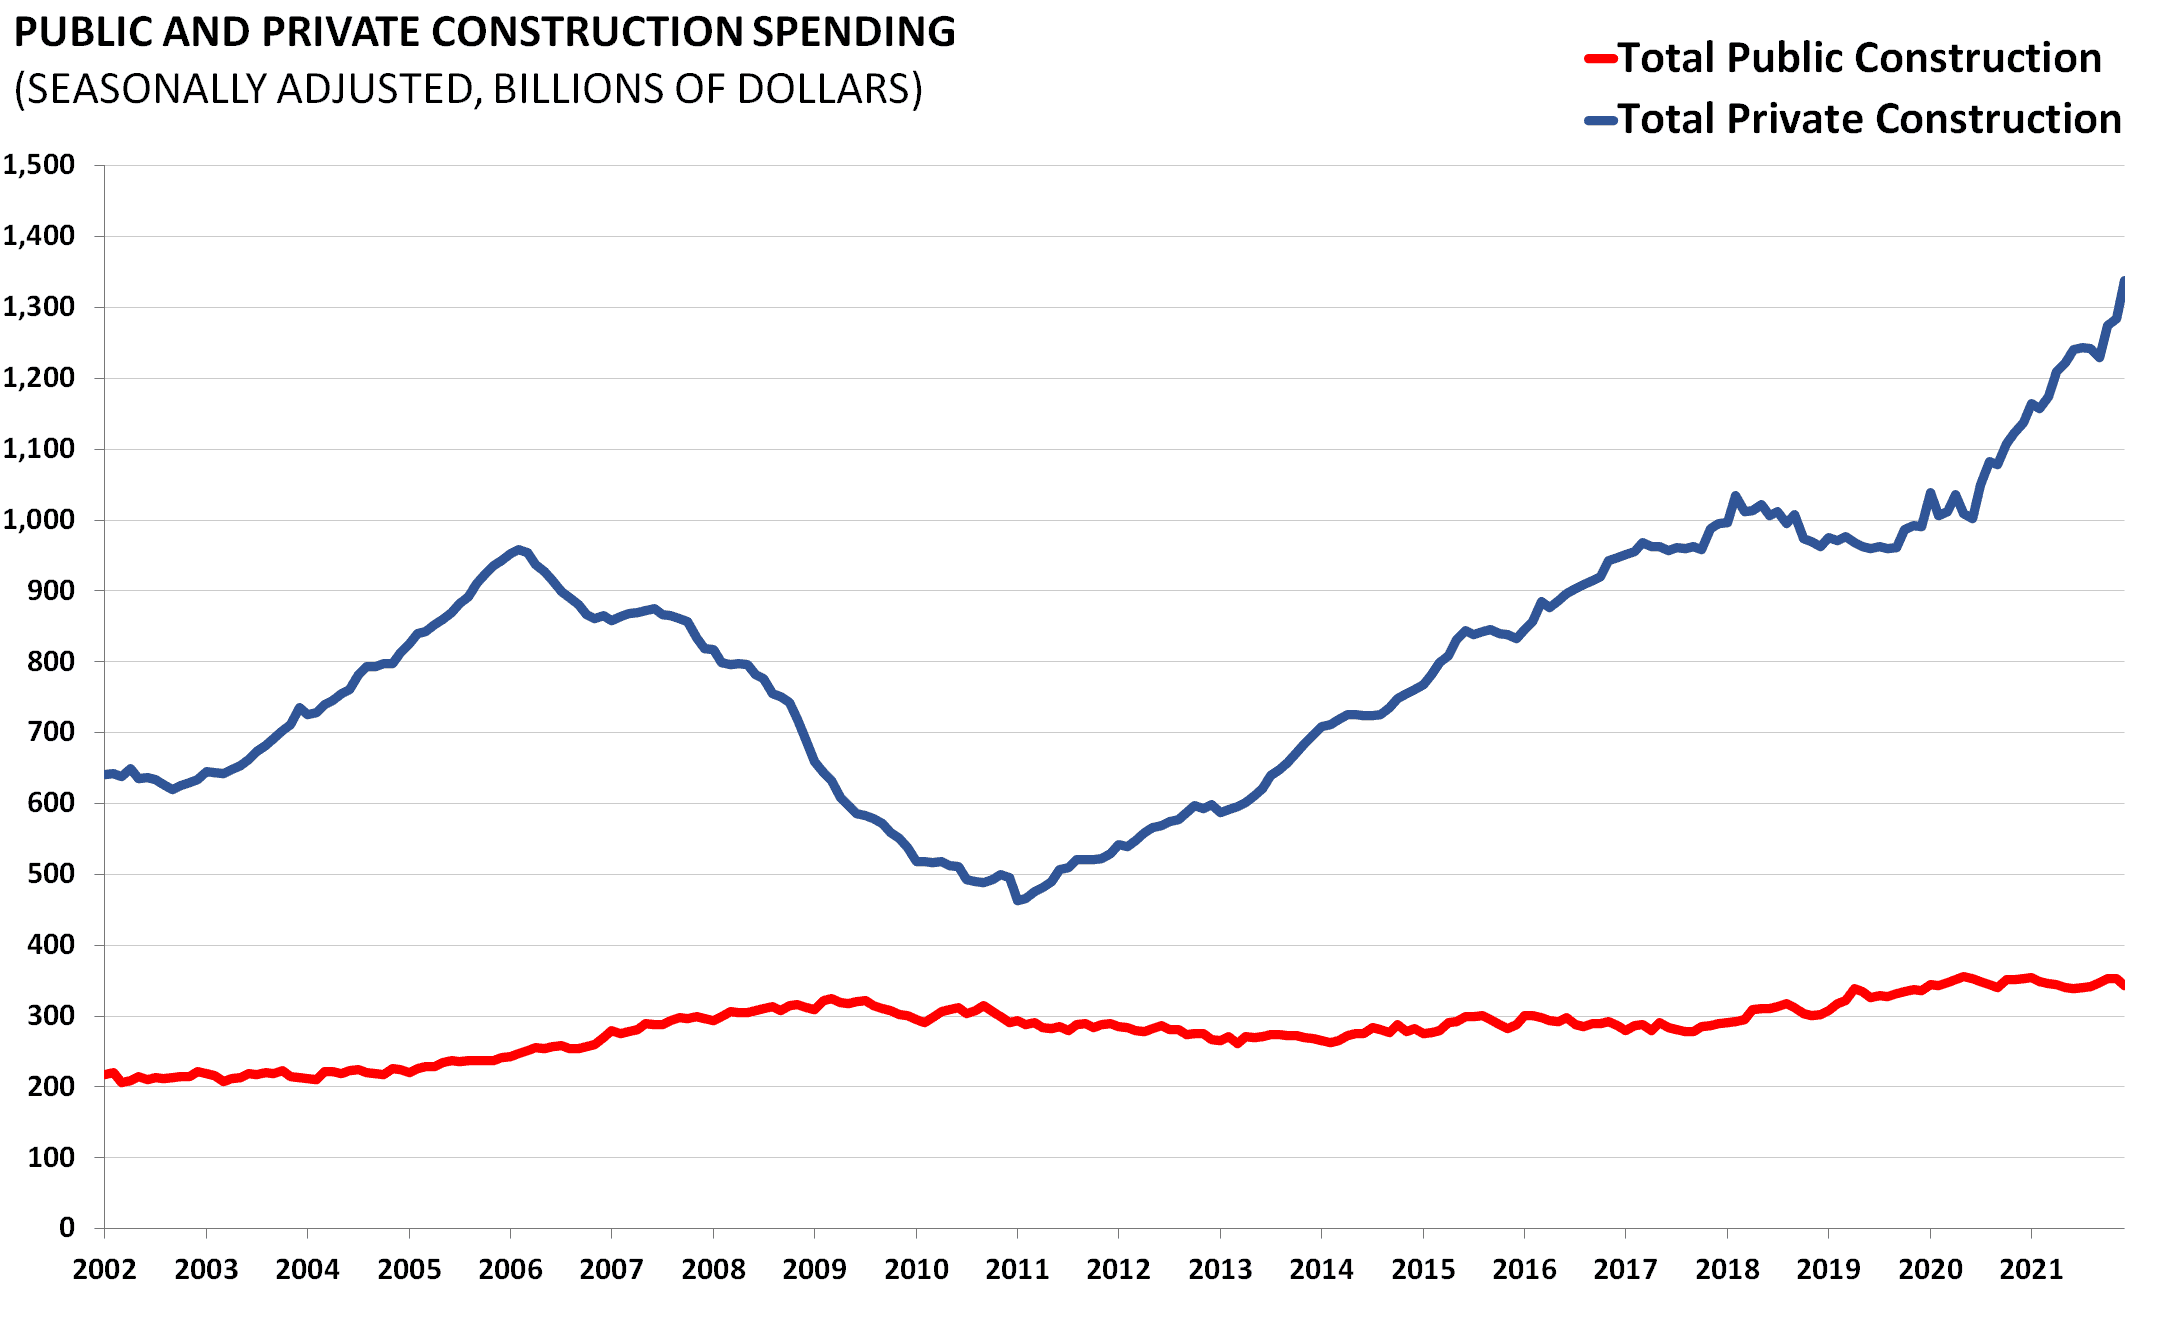
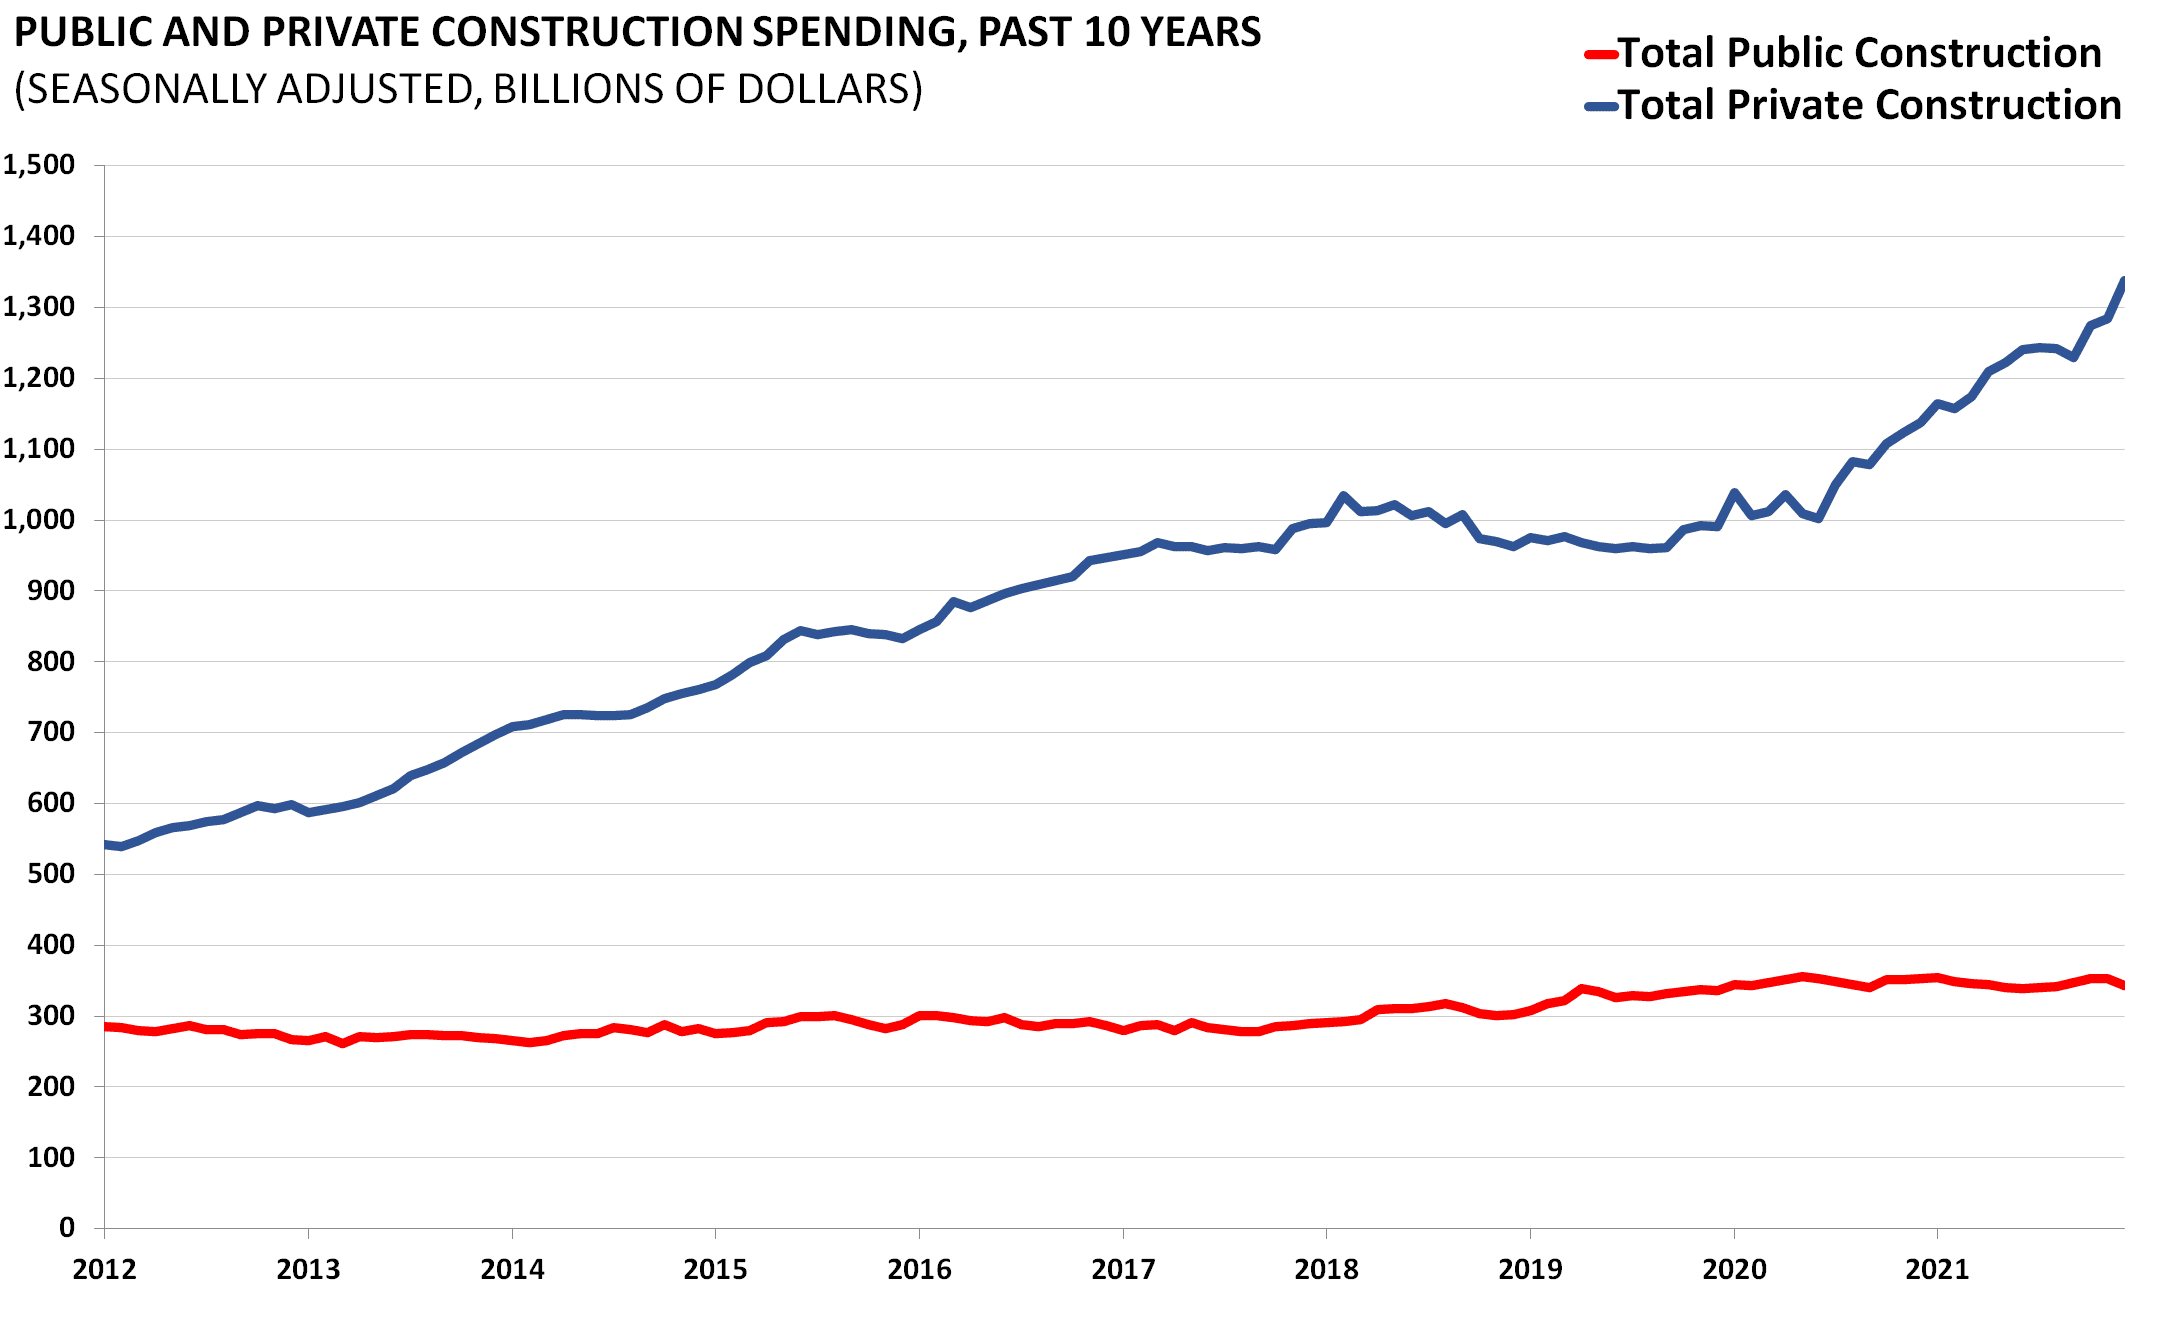
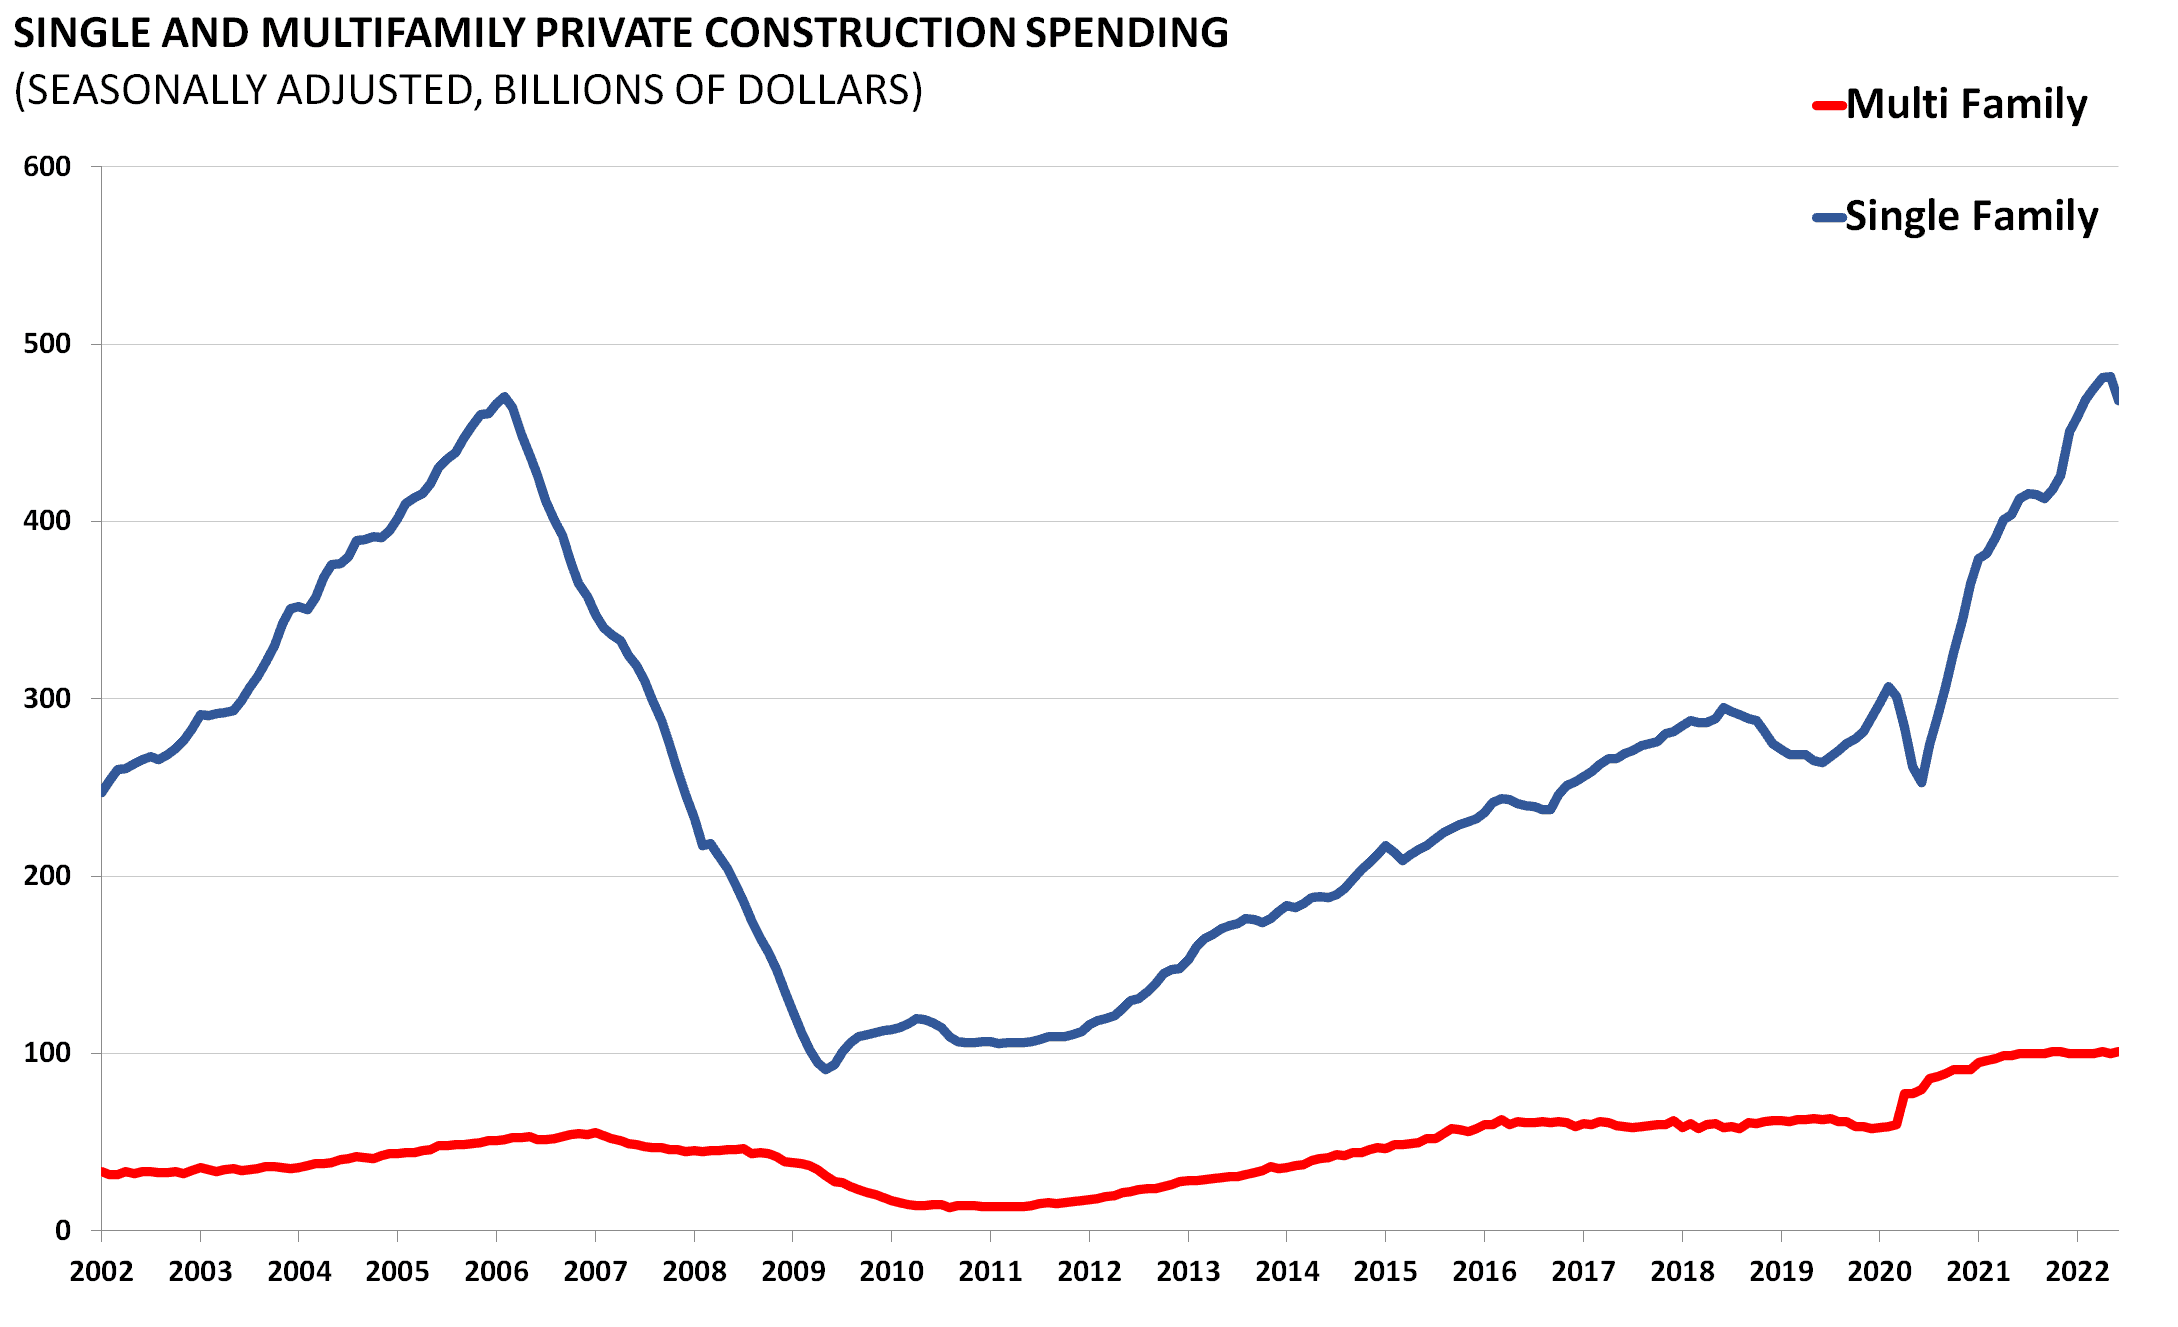
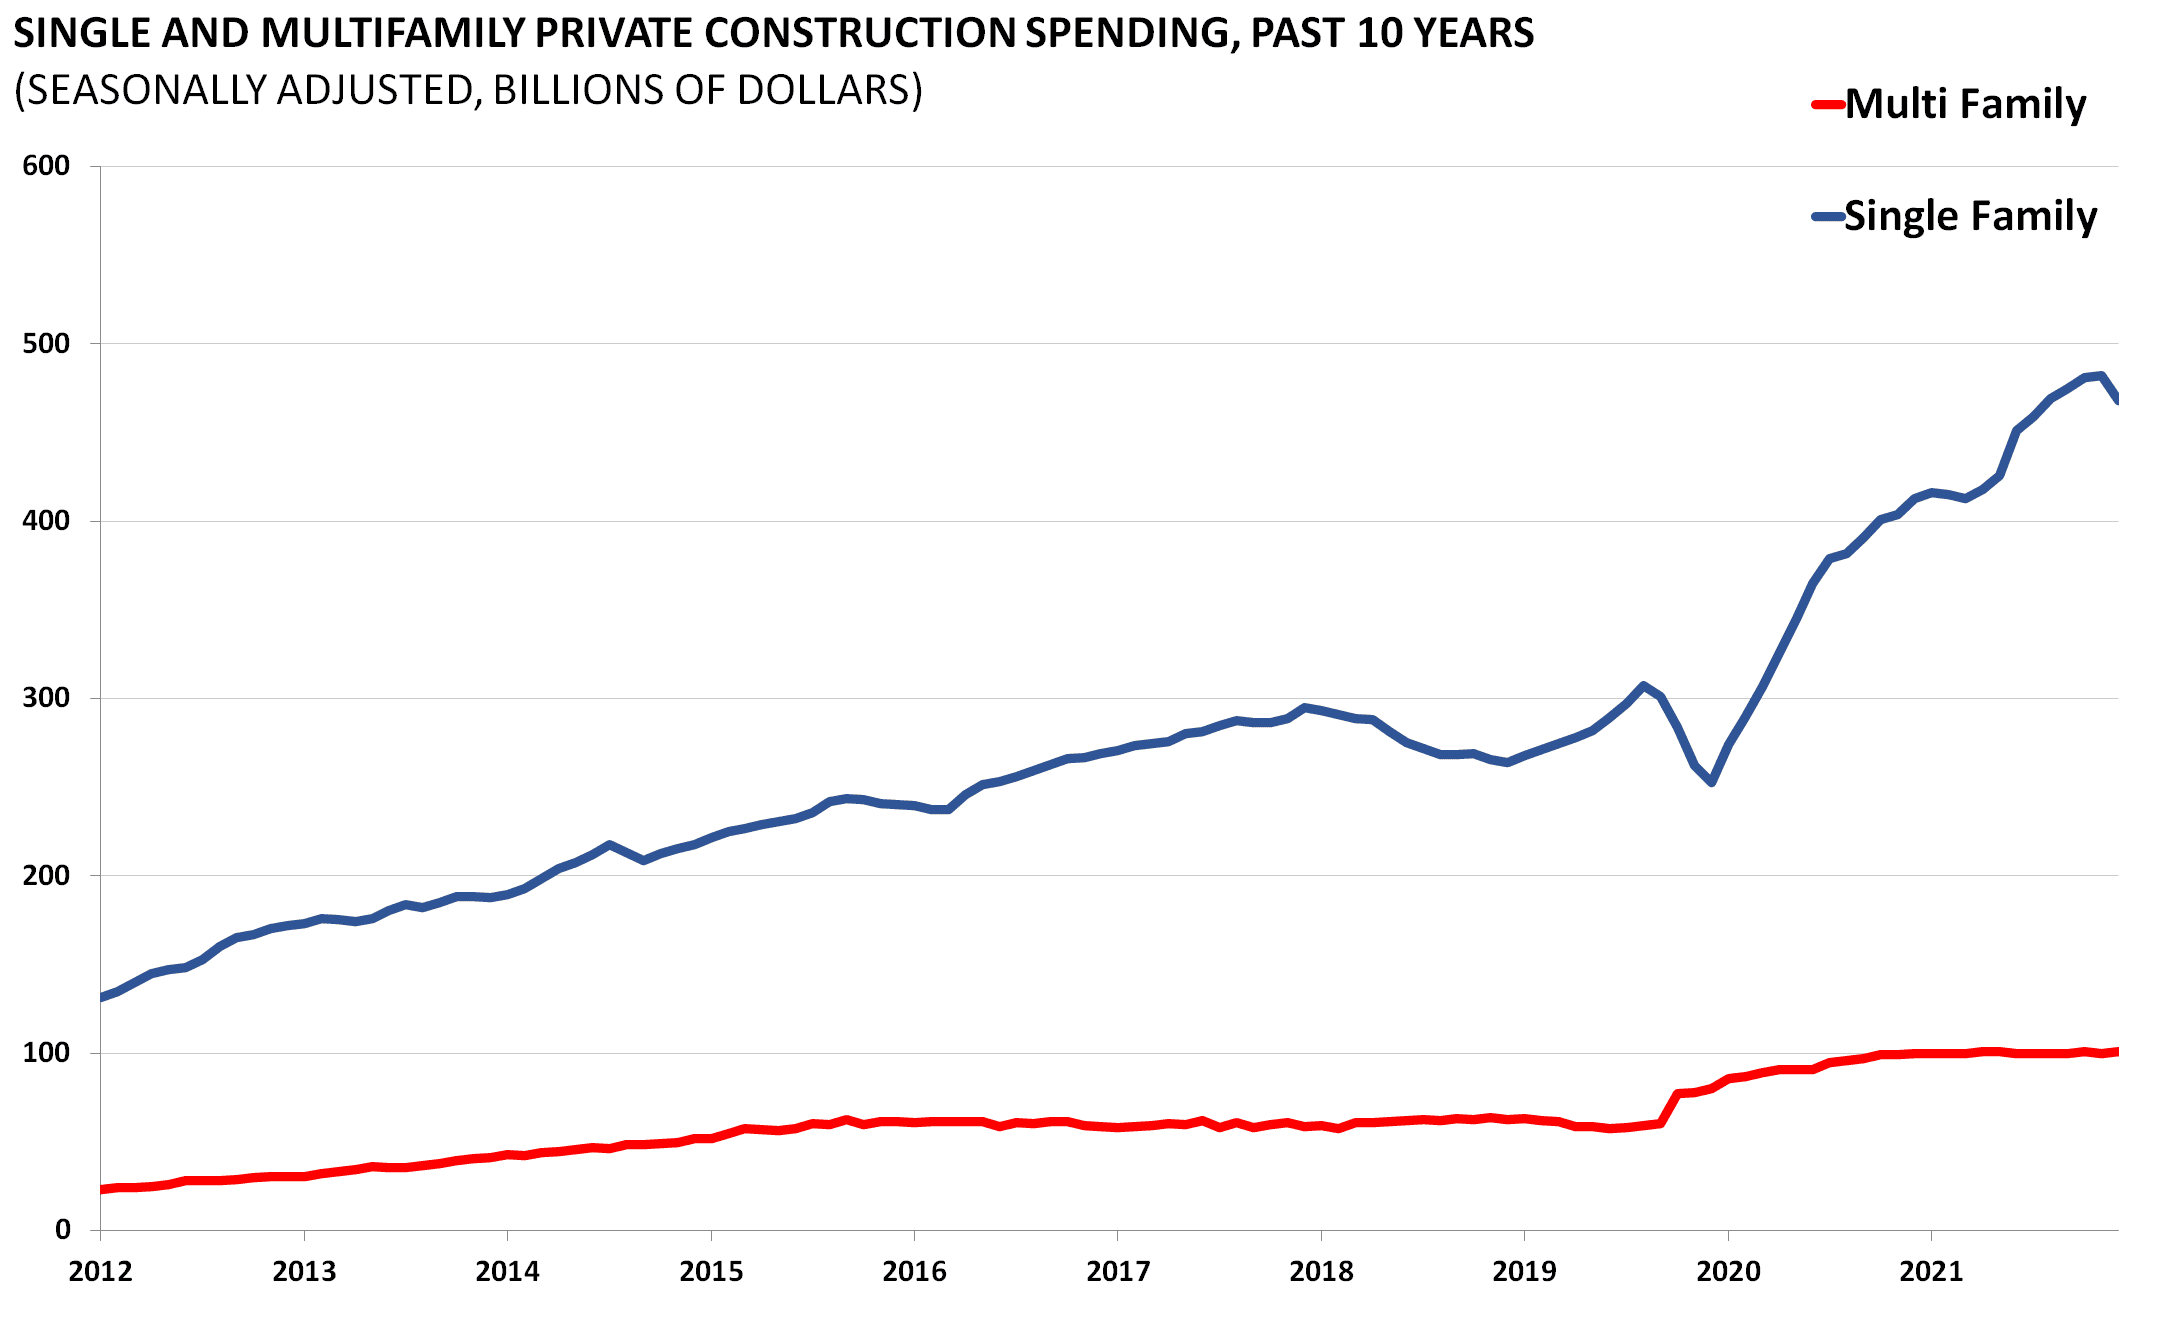
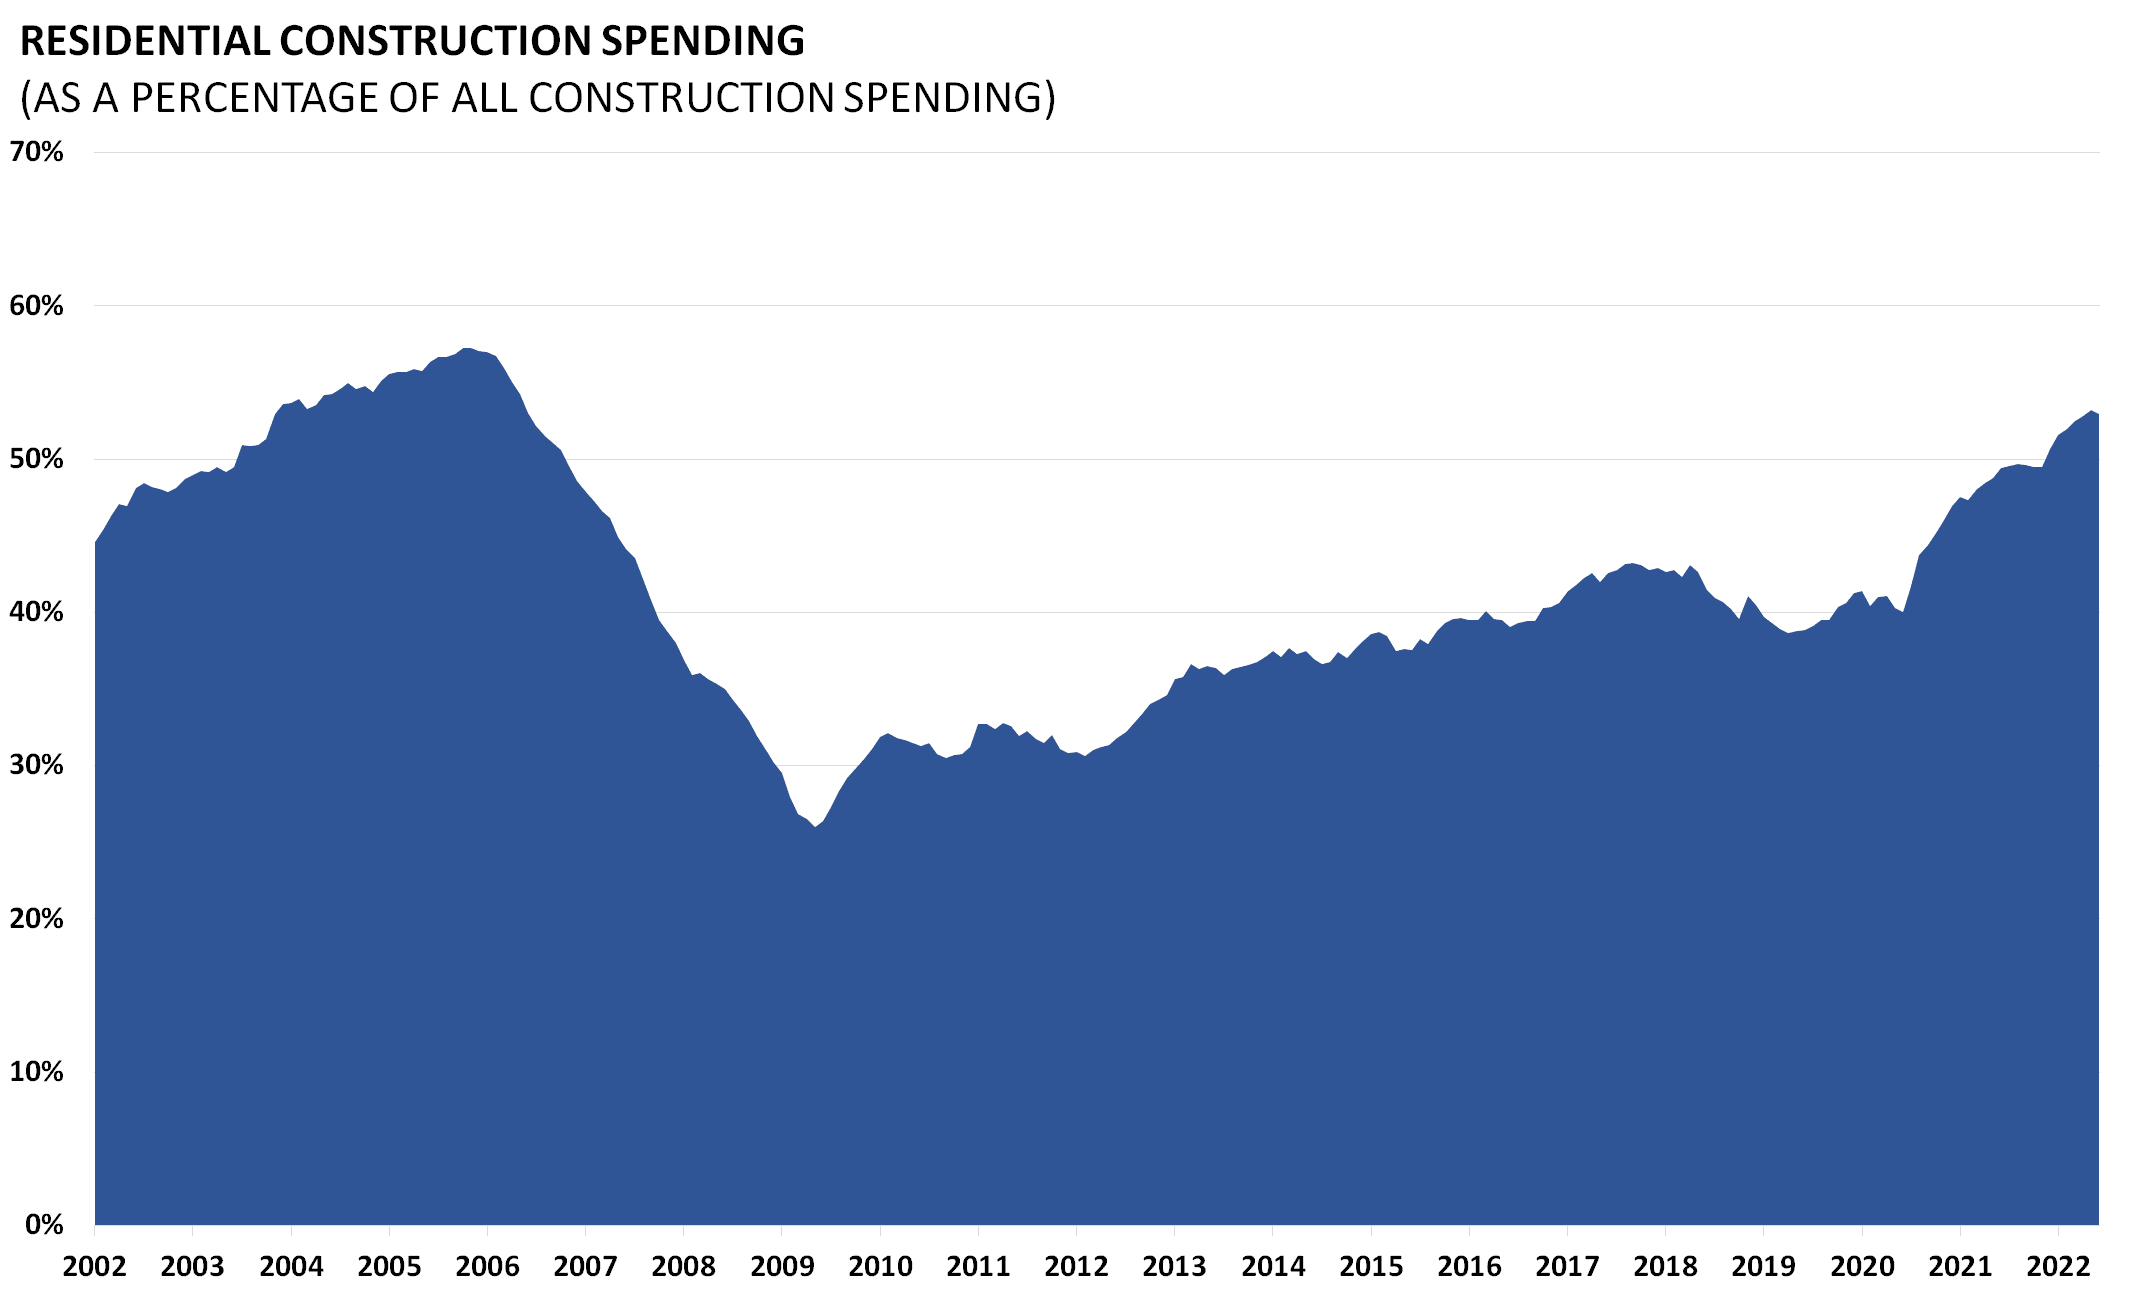
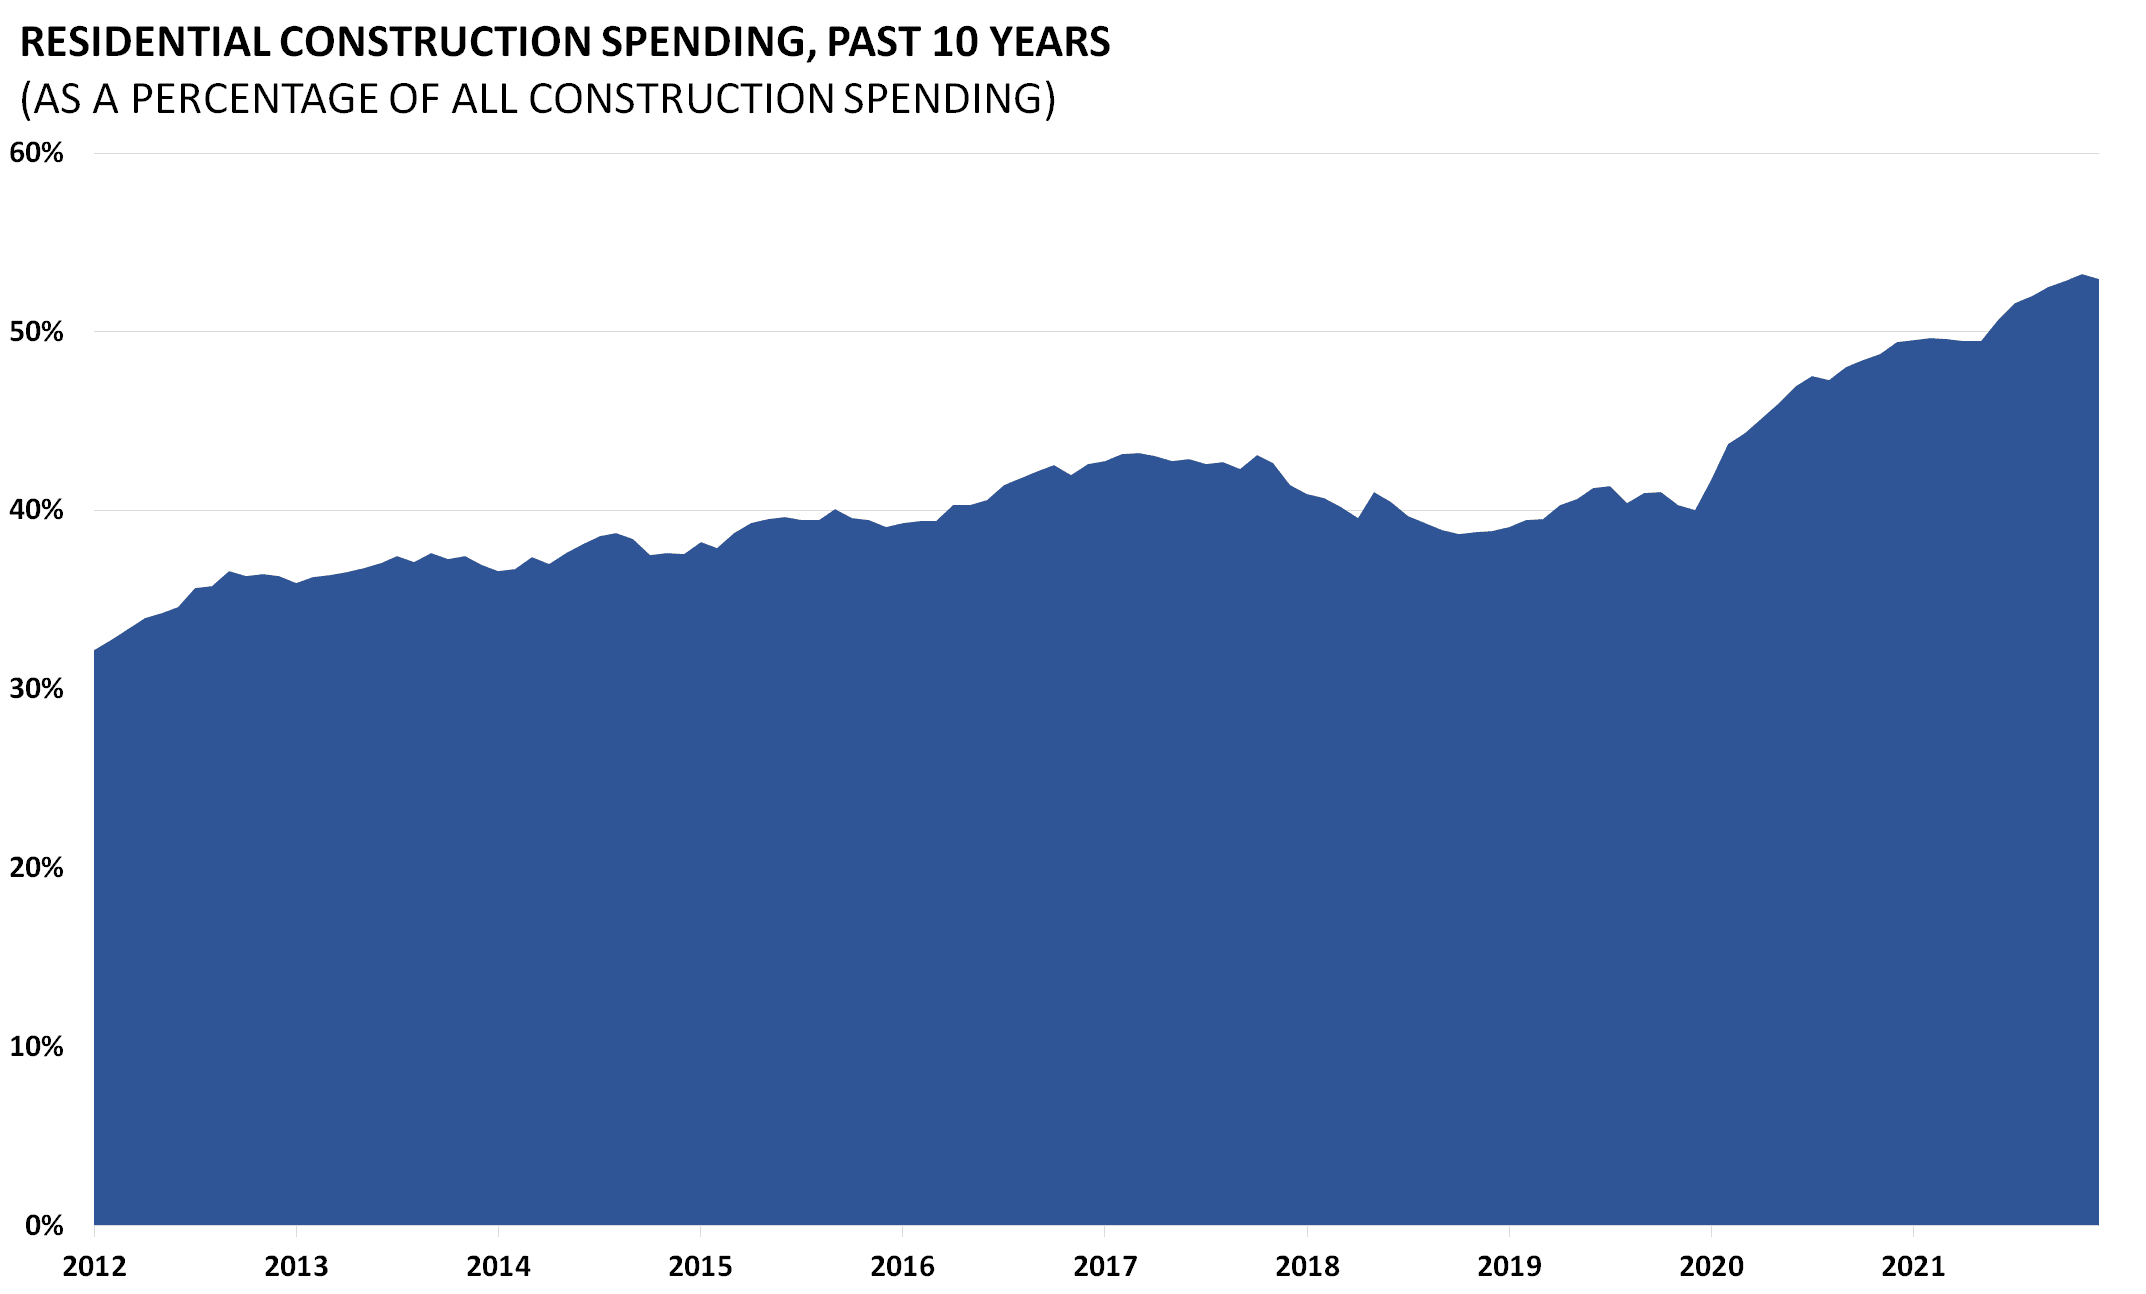
Residential construction spending data releases are monthly estimates of the total dollar value of construction of residential properties. Information on residential construction comes from a larger compilation of all construction work in both privately and publicly funded.
Source: http://www.census.gov/construction/c30/historical_data.html
Data Release: http://www.census.gov/construction/c30/pdf/release.pdf
Jobs
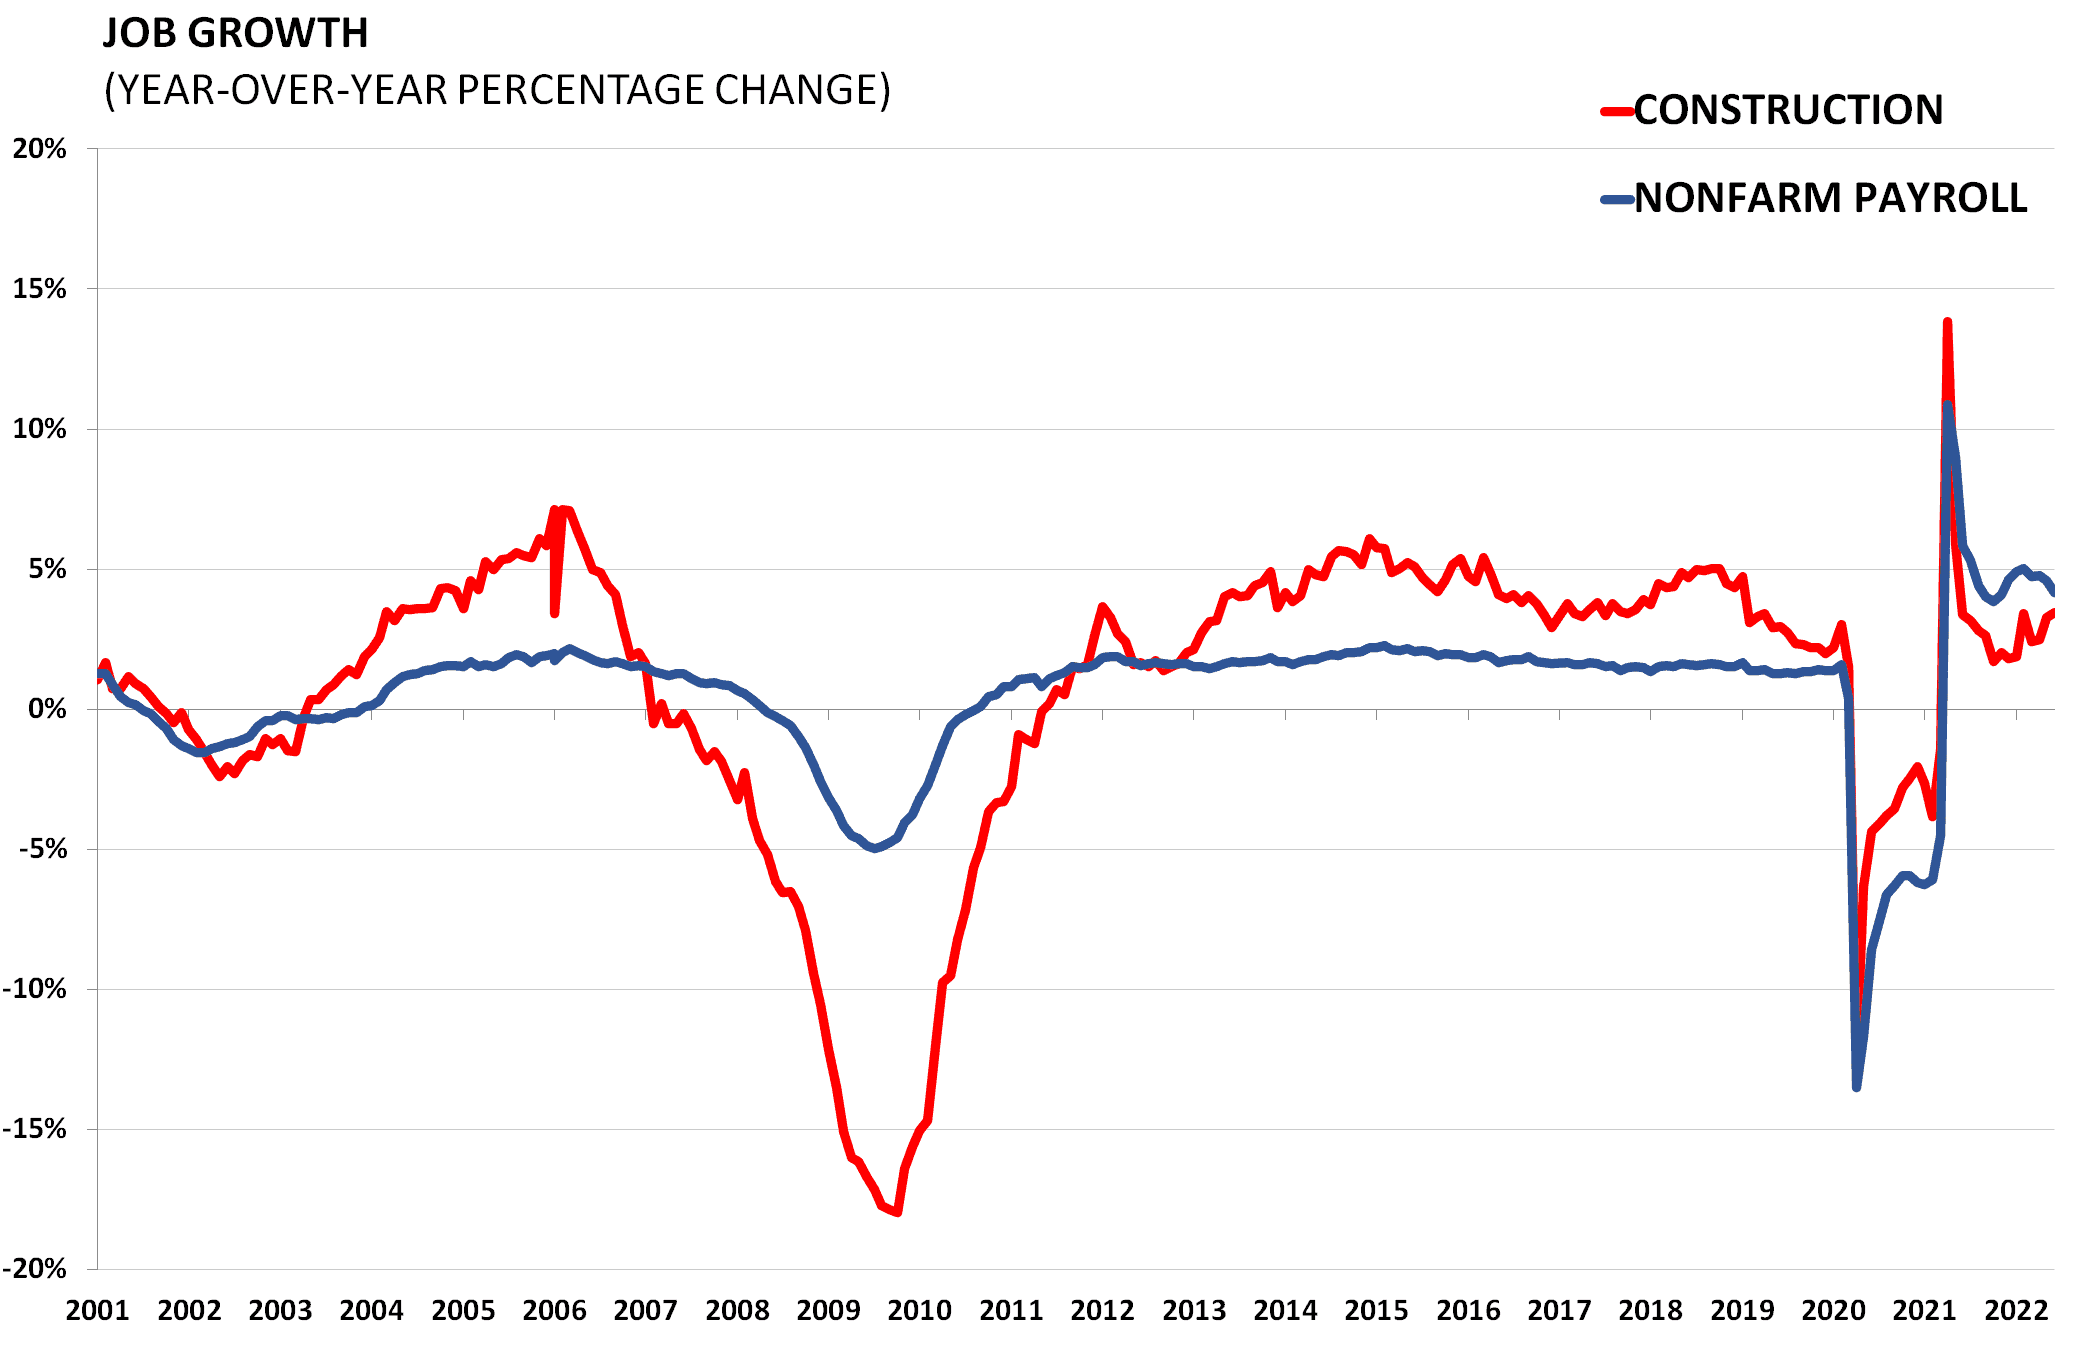
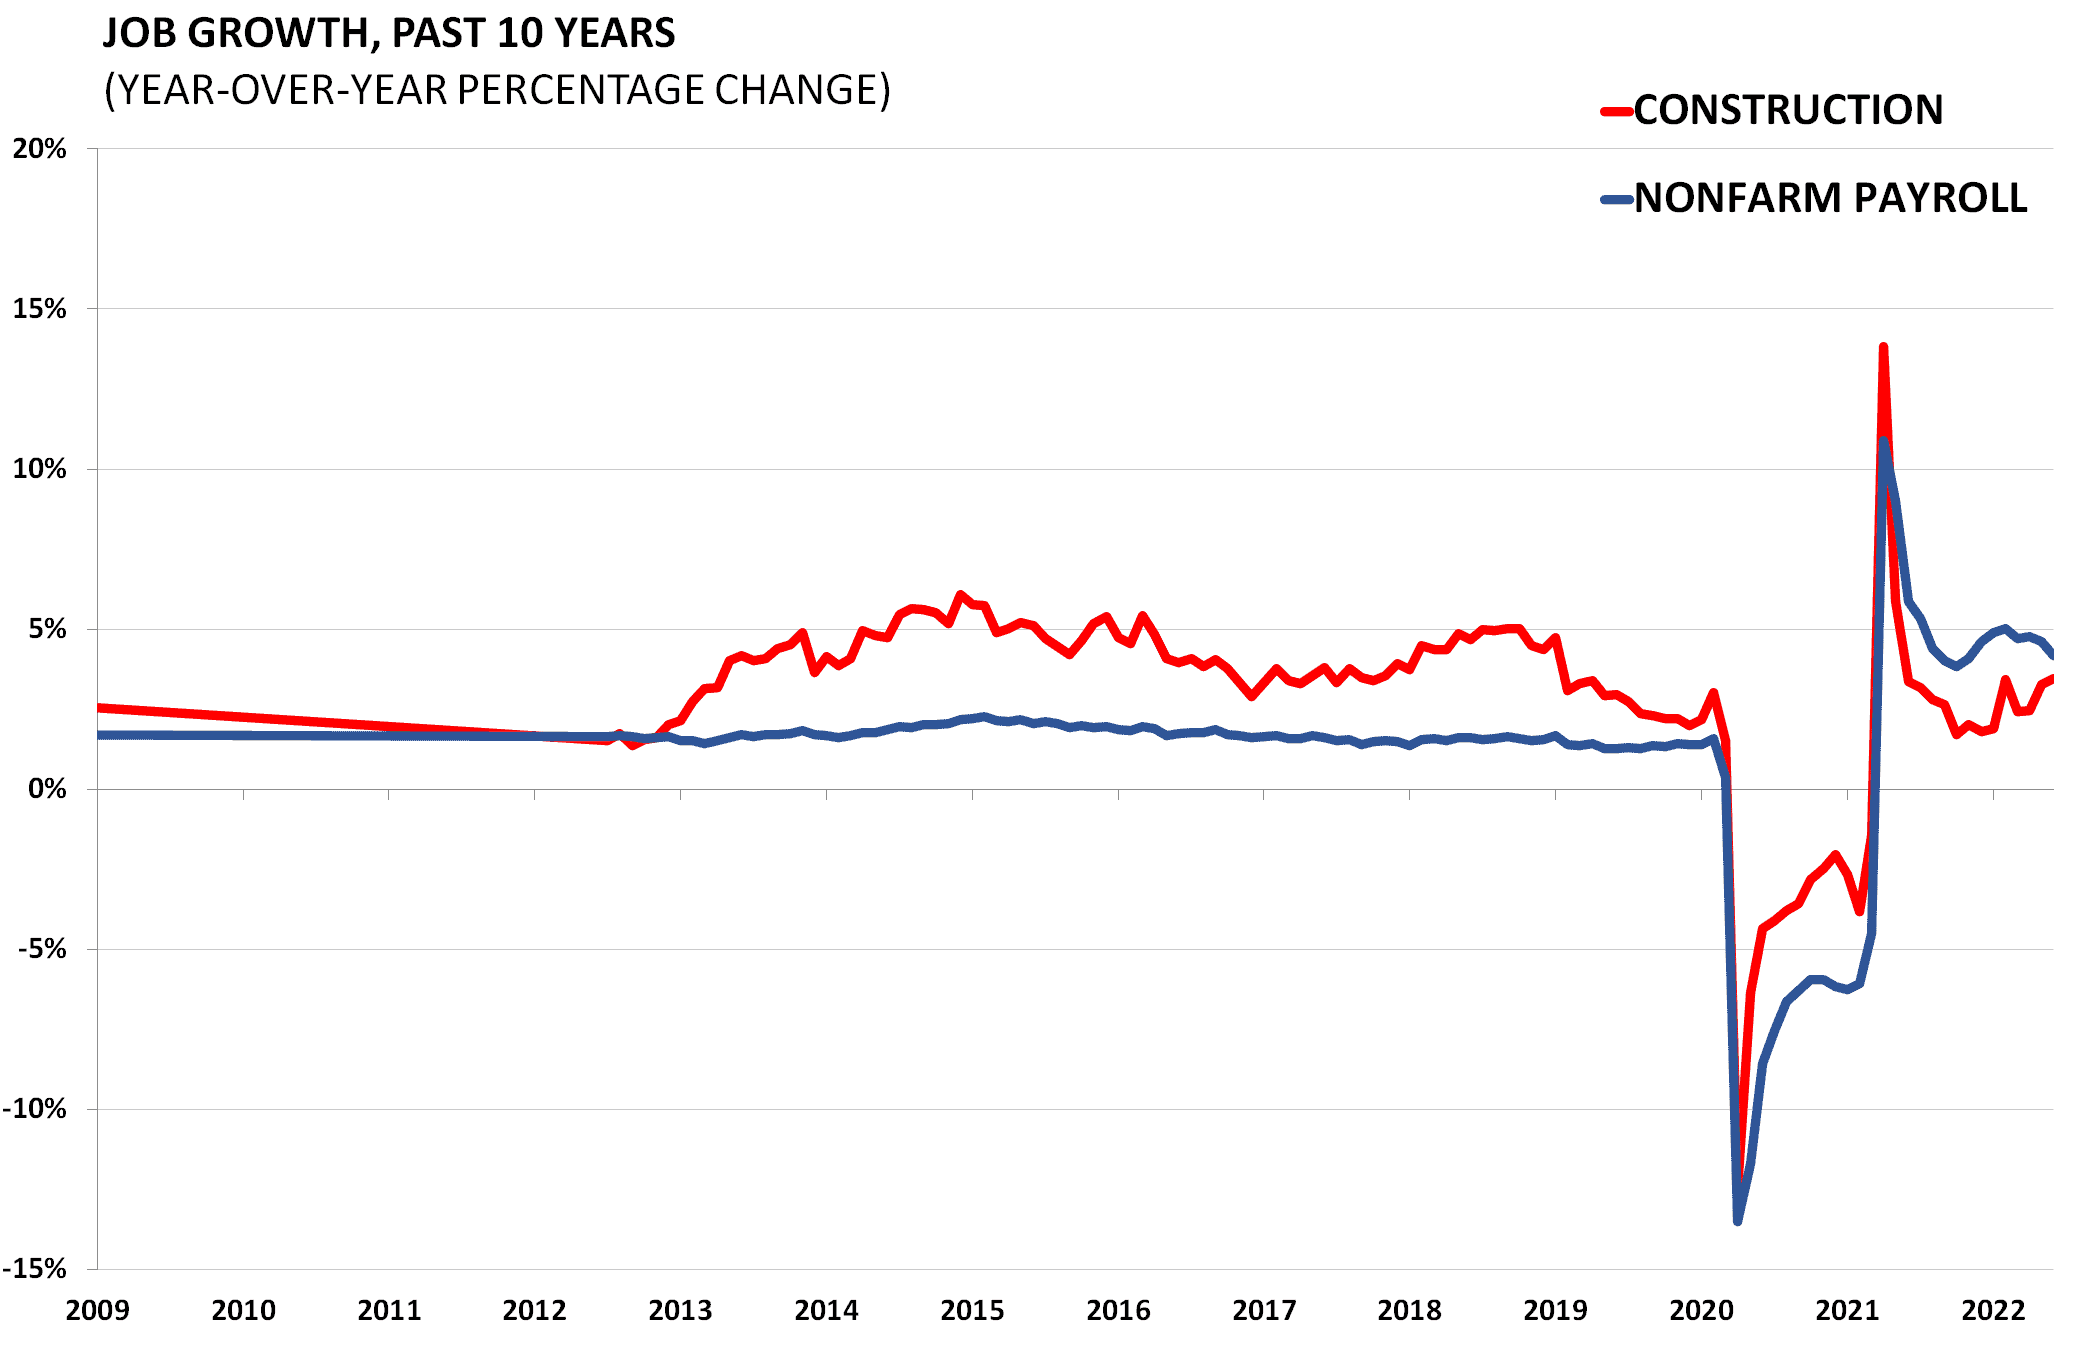

Non-farm payroll and construction employment data come from the Bureau of Labor Statistics which surveys 145,000 businesses and government agencies monthly in order to provide detailed industry data on employment, hours, and earnings. During the Great Recession, the economy shed 7.3 million jobs. The state of labor markets deeply affects the performance of the housing sector. A return in construction jobs will also herald a recovery in the housing market.

Chart Book Index
Share Chart Book