


The Daily Dish
January 11, 2024
Eakinomics: Inflation and the Fed
The Bureau of Labor Statistics will release the report on the Consumer Price Index (CPI) for December, 2023 at 8:30 this morning. In itself the report is not expected to be earth-shattering – year-over-year CPI inflation up to 3.2 percent from 3.1 percent and core CPI inflation down from 4.0 percent to 3.8 percent. (Of course, the real excitement is when the data defy expectations!)
Nevertheless, the report will restart the debate over the future of Federal Reserve monetary policy. To frame the issues, consider the graph below. The bars represent different measures of inflation – CPI (blue), core CPI (orange), and shelter CPI (gray) – in 2023. The clusters represent different time horizons, ranging from 1-year (November 2022-November 2023) at the right, and successively shorter periods that reach one month at the left. (All are measured at an annualized rate.)
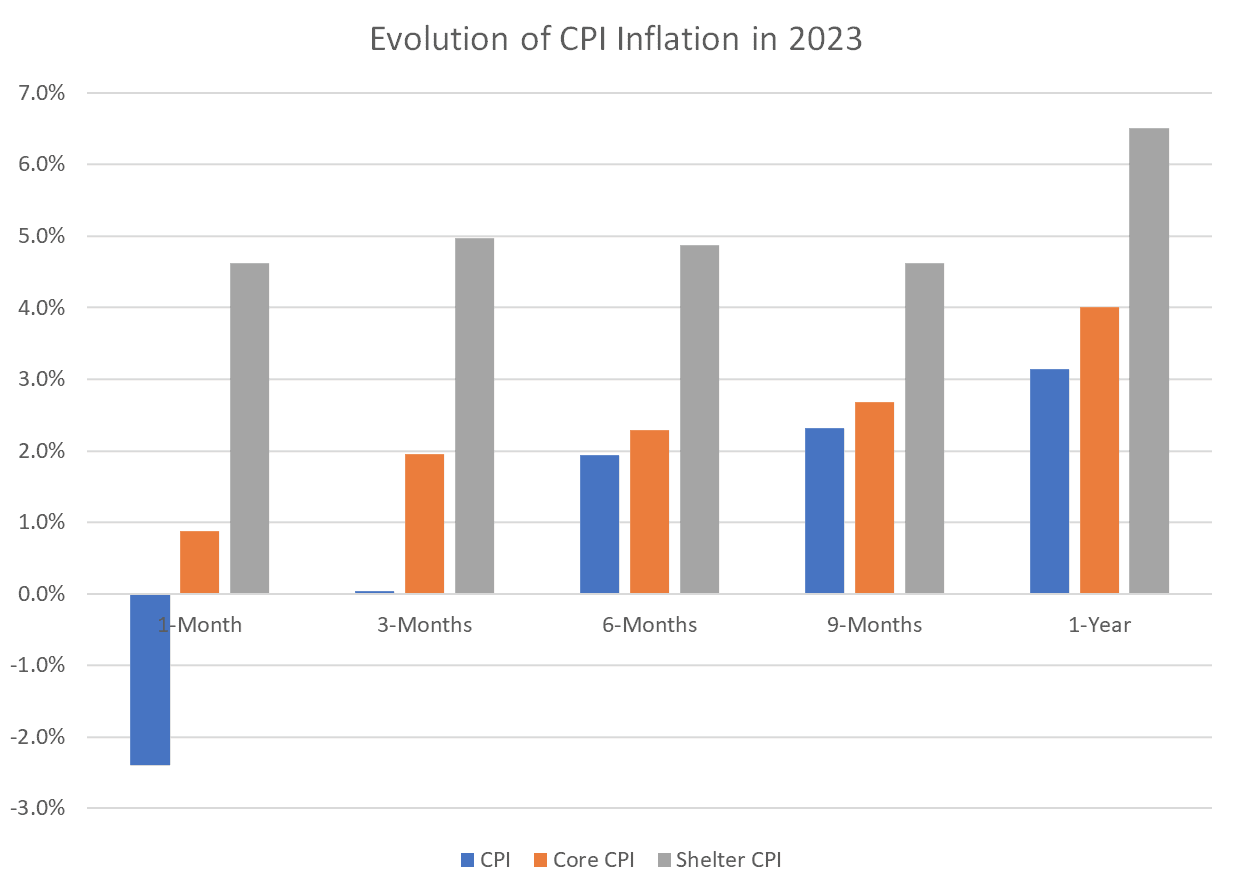
As regular readers of Eakinomics will recall, the overall CPI has been heavily influenced by the sharp decline in energy prices, which produced actual deflation in the November report. Core inflation, in contrast, has remained positive but has decelerated in the most recent months. Finally, a key element of core inflation is shelter (which constitutes one-third of the CPI overall). As the graph indicates, shelter inflation is lower over recent months, but the changes are not dramatic.
How, then, does one think about the outlook for the Fed? There are three key issues to contemplate. First, how strong is underlying demand in the economy? Some read the recent data as indicating sustained strength – a 5.2 percent annualized growth in gross domestic product in the third quarter of 2023, 216,000 jobs in the December jobs report, and so forth. If you think the economy is growing robustly, the case for easing restrictive monetary policy becomes much tougher. Alternatively, one can read the data as providing evidence of weaker and more uneven growth.
The second issue is how much more impact does one expect past restrictive policy to have going forward. Milton Freeman is famous for point out that monetary policy operates with long and variable lags. How much can the Fed count on past actions to provide restraint going forward?
The final issue is your standard of proof. Consider again the core CPI in the graph. In the past month (annualized) inflation was under one percent (recall the Fed’s target is 2 percent). Looking over the past 3 months, the core comes in essentially at the 2 percent target. Even over the past 9 months, the core is below 3 percent, and one might conclude on track to reach the target. Over the past year, the core inflation was twice the target. When one hears arguments that the Fed should declare victory and move policy to neutral, it typically relies on being satisfied on the basis of 3 to 6 months data that inflation is at 2 percent and will remain at 2 percent. Others (count Eakinomics in this group) are more skeptical.
So, get ready for the data at 8:30 and the debate for months to come.
Fact of the Day
Due to large-scale subsidies to clean (non-fossil) energy in the Inflation Reduction Act, California will not realize the over $27 billion in Medicare savings from the IRA's “inflation tax” and drug price “negotiation.”
