








The Daily Dish
November 5, 2026
Employer Cost Constraints
Every month, markets and economists fixate on the headline jobs number, the unemployment rate, and average hourly earnings. Yet few focus on two, less frequent, quarterly datasets – also from the Bureau of Labor Statistics – that explain what labor is actually costing employers: the Employment Cost Index (ECI) and the Employer Costs for Employee Compensation (ECEC).
The ECI measures the change in employers’ hourly labor cost over time – tracking both cash wages and benefits – using a fixed “basket” of labor. This methodology eliminates the effects of workers moving between occupations and industries. The ECEC meanwhile, measures the average employer cost per employee hour worked for total compensation, wages and salaries, and benefits while reflecting real-time changes in the workforce.
The September 2026 ECI data showed that total compensation growth for private-industry employers held steady at 3.4 percent over the past 12 months. Underlying component growth diverged, however. Benefit costs accelerated to 3.9 percent year over year, while wages and salaries cooled to 3.1 percent, continuing its four-year decline and failing to keep up with inflation.
Digging into the details, private-sector employer costs for health insurance surged 6.4 percent for the 12 months ending in September. Health insurance cost growth had last topped the 6-percent mark in late 2005.
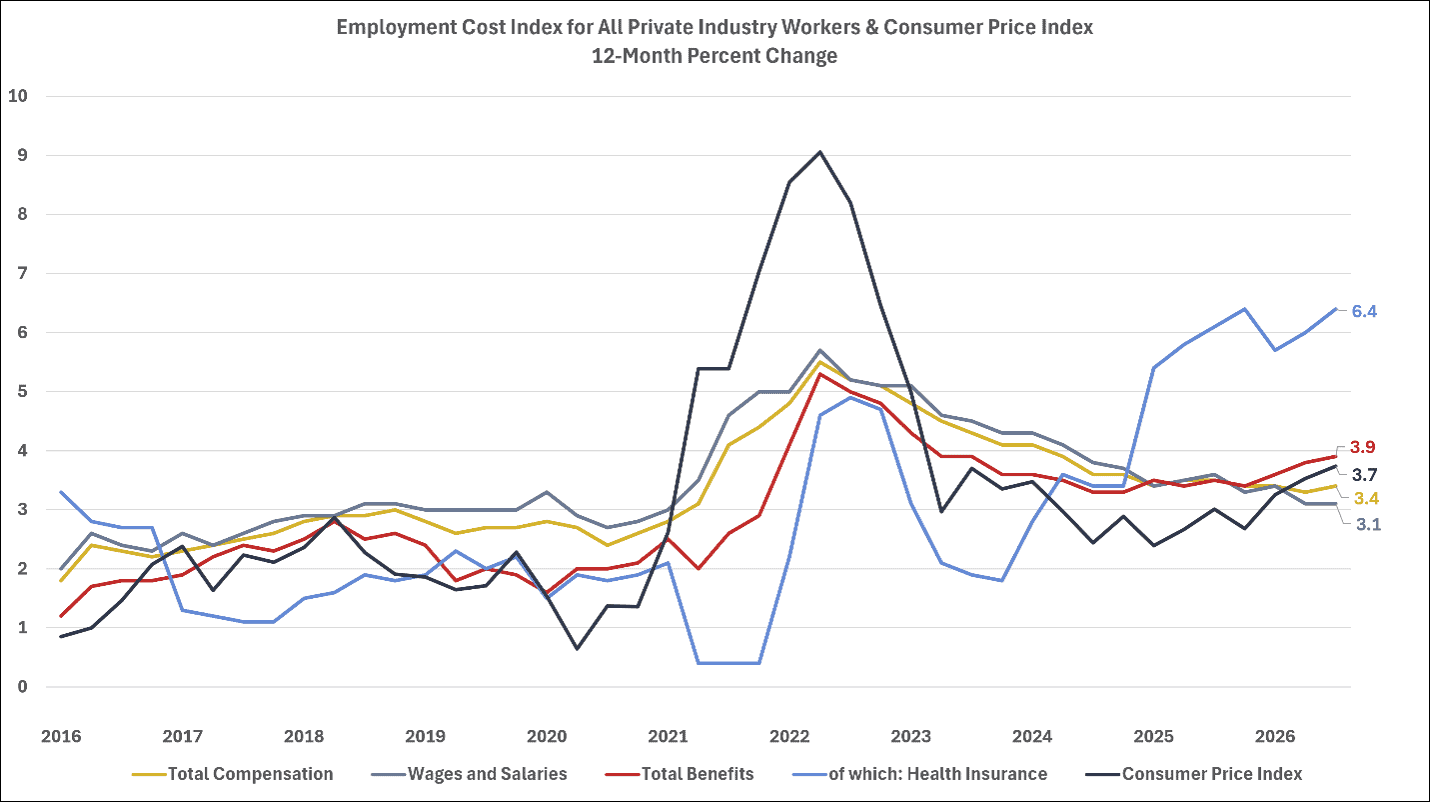
Source: Bureau of Labor Statistics ECI; CPI
While the ECI shows how fast costs are accelerating, the ECEC assigns a dollar value that ultimately shows up on a firm’s income statement and balance sheet. Nationally, wages and salaries account for about 70 percent of total private compensation, with benefits composing the remaining 30 percent. As of June 2026, private industry compensation costs averaged $46.89 per hour worked – $32.82 for wages and salaries and $14.07 for benefits.
Insurance, which makes up 8 percent of total compensation and just over 25 percent of total benefits, increased to $3.69 per hour worked, an annual increase of 7.3 percent. Health insurance, which accounts for roughly 95 percent of insurance cost, rose 7.7 percent.
While firms may not yet see any marginal benefit in cutting workers, as evidenced by multi-decade lows in initial jobless claims, the rapid rise of health insurance costs could be a drag on monthly hiring.
Freddy’s Forecast: October Jobs
Payroll employment growth was sluggish in September as employers added just 29,000 jobs. Goods-producing and service-providing industries experienced growth while government payrolls shrank. Revisions to the prior two months pulled employment down by a combined 60,000, with data for July revised from 21,000 jobs gained to 10,000 jobs lost. The unemployment rate ticked up to 4.2 percent as nearly 500,000 people entered the labor force. Average hourly earnings were weak, up just 0.1 percent for the month and 3.0 percent for the year, again failing to keep pace with inflation.
Since that last report, data from ADP showed the pace of private-sector hiring was steady at 86,000. Small businesses added 28,000 workers while medium-sized businesses (+33,000) and large firms (+24,000) also added jobs. Job gains were broad-based as construction (+13,000), education and health services (+28,000) and leisure and hospitality (+19,000) offset weakness in the manufacturing (-1,000) and professional and business services (-27,000) industries.
The Bureau of Labor Statistics’ Job Openings and Labor Turnover Survey data showed that job openings jumped to just over 7.5 million in September, the highest level since May. The hiring rate ticked up to 3.4 percent, a level that suggests it is still incredibly difficult to find a job. Separations, meanwhile, increased but remained muted.
Initial jobless claims remained historically low during the week ending October 31 at 197,000. The four-week moving average, which smooths out weekly volatility, trended lower during the month, dropping to 194,750. Continuing claims were largely steady at 1.718 million.
The Institute for Supply Management reported that manufacturing activity expanded in October, at a faster pace than in September as the overall index increased 1.0 percentage point to 55.5. An increase in the new orders, inventories, and production helped offset a slowdown in the pace of hiring. Data for the services sector showed a slower expansion in October as the index slipped 0.4 percentage points to 54.5. More muted growth in production and new orders dragged on the headline, while employment increased to 51.4.
For October, expect payroll gains of 52,000 and the unemployment rate to remain at 4.2 percent. Growth in average hourly earnings remains low at 0.3 percent for a 2.9-percent annual gain.
Fact of the Day
Since the start of 2026, the federal government has published $1.4 trillion in total regulatory net cost savings and 160.6 million hours of net annual paperwork increases.