


The Daily Dish
May 1, 2024
Employment Cost Index
Yesterday the Bureau of Labor Statistics released the employment cost index (ECI) data for the first quarter of 2024. The ECI is the best measure of labor cost inflation, as it includes wages and salaries as well as benefits. It also adjusts for the mix of workers’ skills in the labor market.
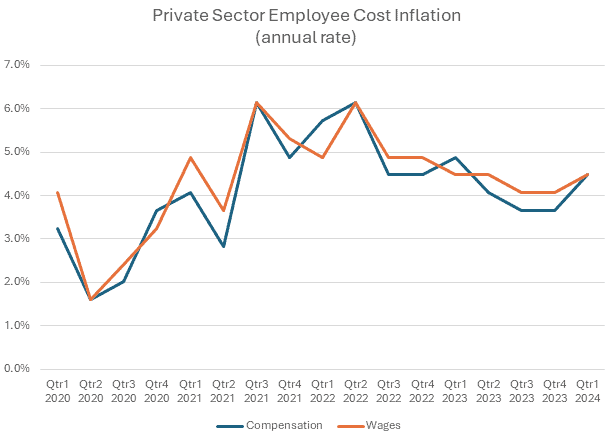
As has been widely reported, the ECI came in a bit hot, with both total compensation (green) and wages and salaries (orange) rising at a 4.5 percent annual rate. This remains well below the peak of 6.1 percent in 2021 and 2022, but up sharply from the 3.6 percent rate a quarter earlier.
These data are a reminder that the labor market remained relatively tight in the first quarter, averaging 276,000 new jobs each month. By comparison, it averaged about 251,000 a month in 2023.
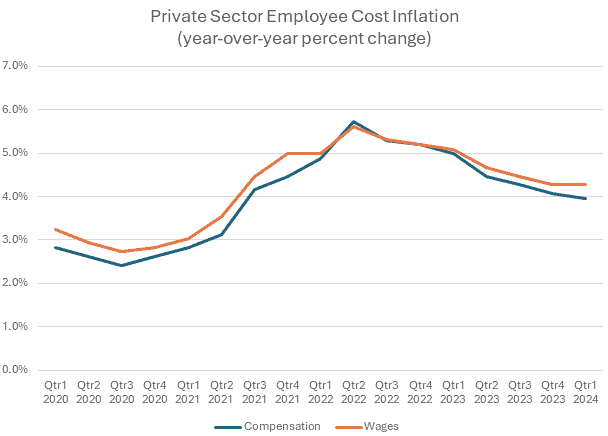
The first read on labor data in the 2nd quarter arrives on Friday with the employment report for April. This will provide some insight as to the pace at which employment cost pressures are likely to rise in the future. As shown below, at present, year-over-year employment cost inflation is running in the 4 percent range, something that is consistent with inflation in the 2.5 to 3.0 percent range.
Add the ECI to the list of reasons that the Fed will stand pat on interest rates today. The slow pace at which the labor market is coming into balance also suggests that a slowing of the ECI to a rate consistent with the Fed’s 2 percent target will take several quarters or more.
Fact of the Day
As of April 24, the Fed’s assets stood at $7.4 trillion.
