


The Daily Dish
April 8, 2026
Inflationpalooza
Inflation junkies, get ready. This Thursday the Bureau of Economic Analysis (BEA) releases the personal consumption expenditures (PCE) price index for February, and Friday the Bureau of Labor Statistics (BLS) releases the consumer price index (CPI) for March.
The PCE is the Federal Reserve’s preferred measure of inflation because it reflects the actual mix of purchases in the economy, in contrast to the CPI which is a fixed basket of goods and services. The PCE takes a bit longer to collect and assemble, so it lags behind the CPI by a month. This sets up an interesting week because the PCE will show inflation trends prior to the war with Iran, while the CPI will be the first inflation data to reflect the impact of the war on prices.
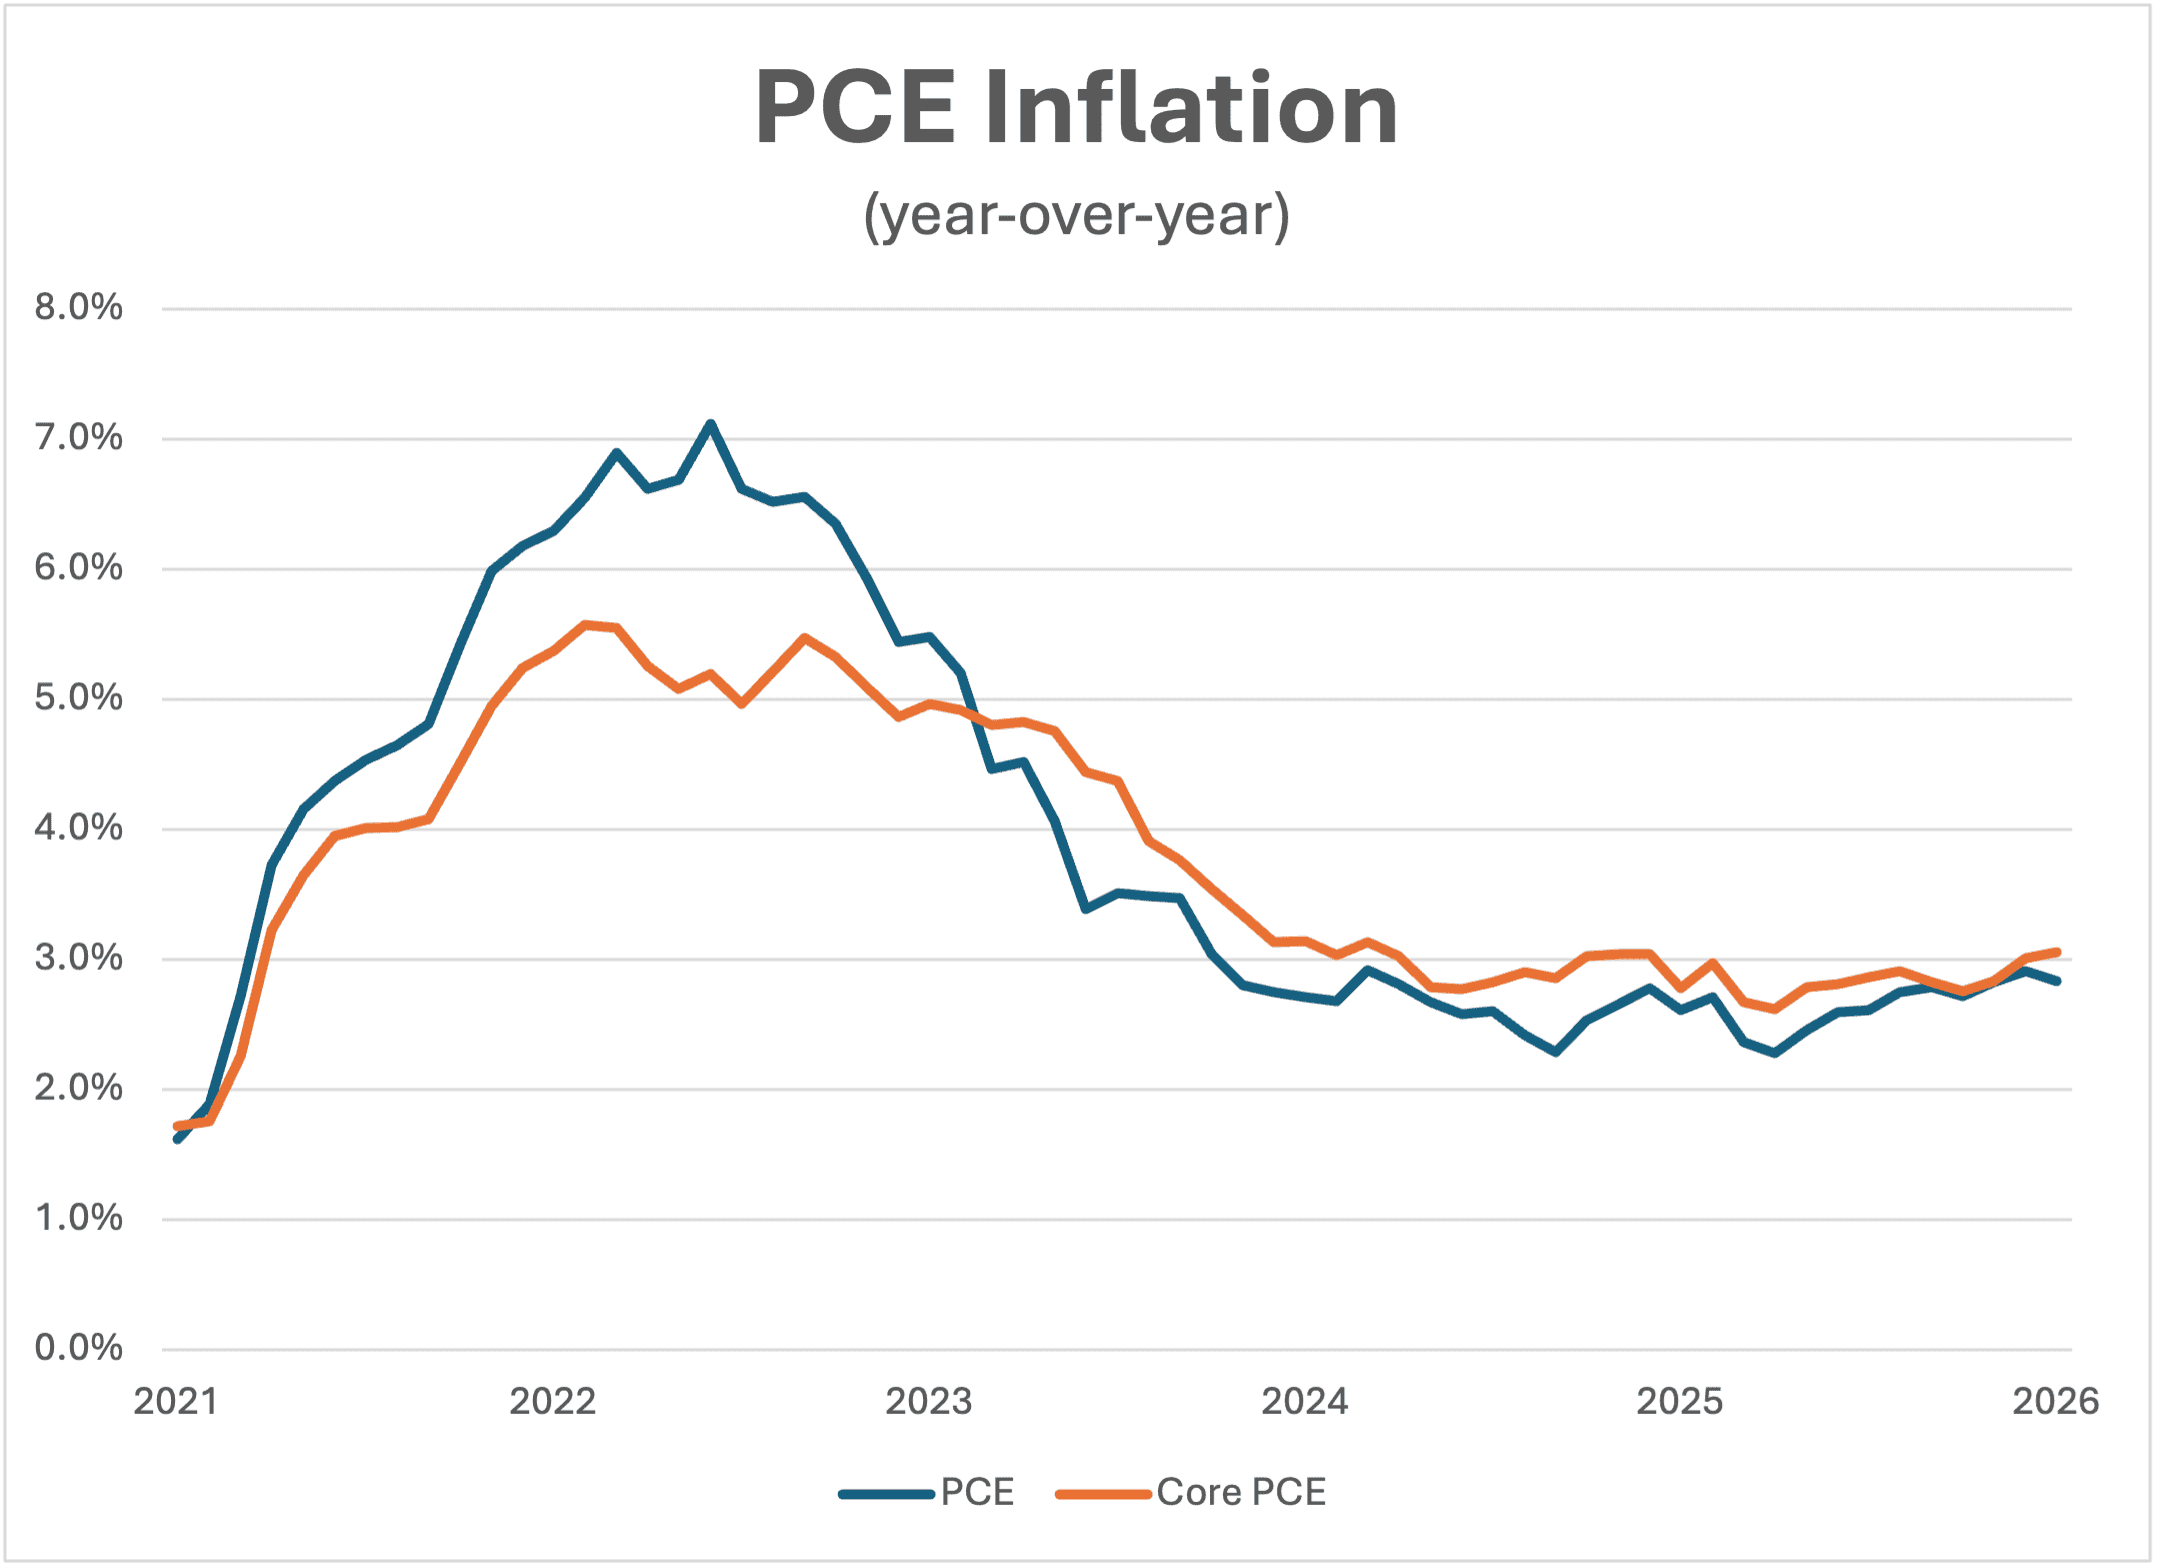
As you can see in the graph below, PCE inflation through January was far from the 2 percent target. It had levelled off in the vicinity of 3 percent, and there was some evidence that it was rising again (especially when looking at core inflation). The February data will help settle the trend before the war.
The CPI data are plotted in the graph below (the gap is the legacy of the government shutdown this past fall). They showed a more promising level and trend in inflation, but the impact of the war is expected to be substantial. The one-month inflation rate could reach 1 percent (a roughly 12 percent annual rate). Most of that will be the direct impact on energy prices. A more interesting piece of data will be the impact on the core CPI. How much does the price pressure spill over to non-energy prices?

The final piece of the puzzle is inflation expectations. If people expect inflation, they will take steps to insulate themselves from its effects by asking for raises, charging higher prices to their customers, and so forth. But that simply generates inflation, so the inflation expectations become self-fulfilling. Keeping inflation expectations under control is a huge step toward controlling inflation itself.
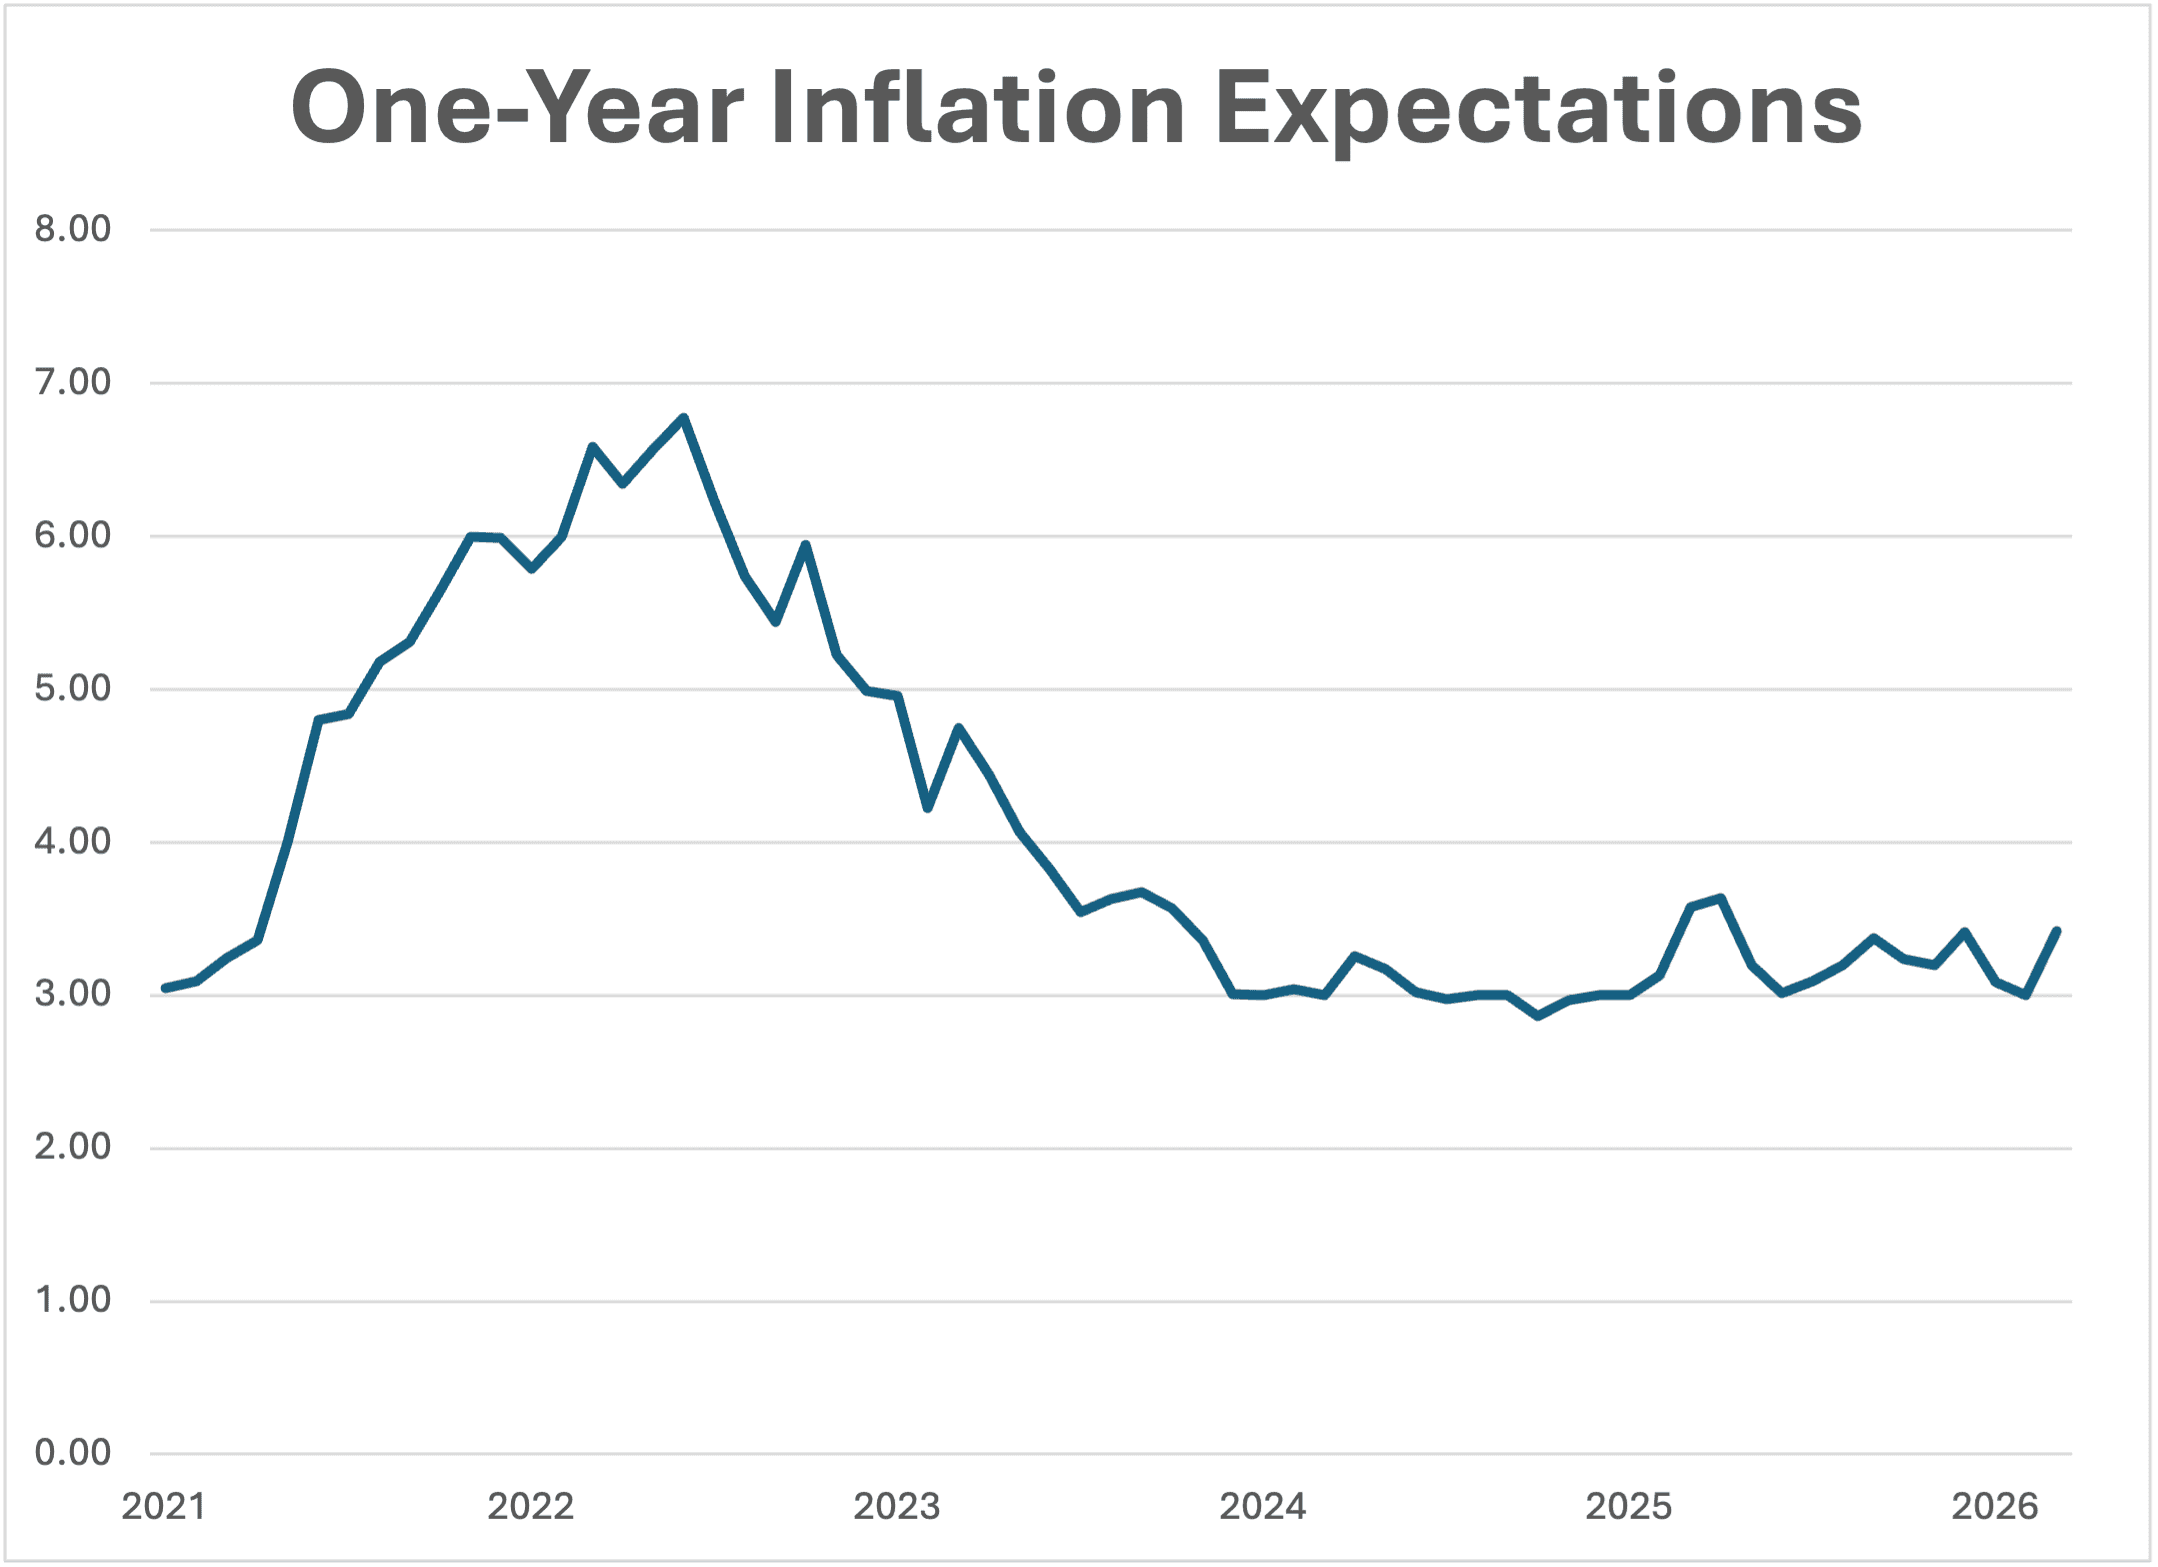
As the chart below shows, one-year inflation expectations soared with the advent of the big inflation in 2021 and 2022. Since then, the Fed basically got the expectations genie back in the bottle with a blip in 2025 as the result of the tariffs. What will happen going forward?
So, stay tuned for Inflationpalooza. It is going to be great fun.
Fact of the Day
As of April 1, the Fed’s assets stood at $6.7 trillion.
