


The Daily Dish
February 3, 2026
Policy Volatility, Yes. Bad Outcomes, Maybe.
The Washington Post has a story pinpointing that the president’s “chaotic governing style is hurting the value of the U.S. dollar.” In particular:
But perhaps the key to the dollar’s drop is the ripple effect of the president’s erratic policymaking, including abrupt stops and starts with tariffs and military action against a lengthening list of countries. After more than a year of nonstop upheaval emanating from the White House, many foreign investment managers are exhausted.
This resonates with a not-dead-yet, surviving-on-caffeine, can’t-believe-it’s-only-been-a-year Eakinomics. Moreover, there has been a documented rise in some measures of policy uncertainty. The graph, for example, shows the Baker-Bloom-Davis index of policy uncertainty. The index is based on counts of policy mentions in newspaper articles and shows a clear upshift from the end of the Biden Administration to the Trump year. So the “chaos” is clear in these data.
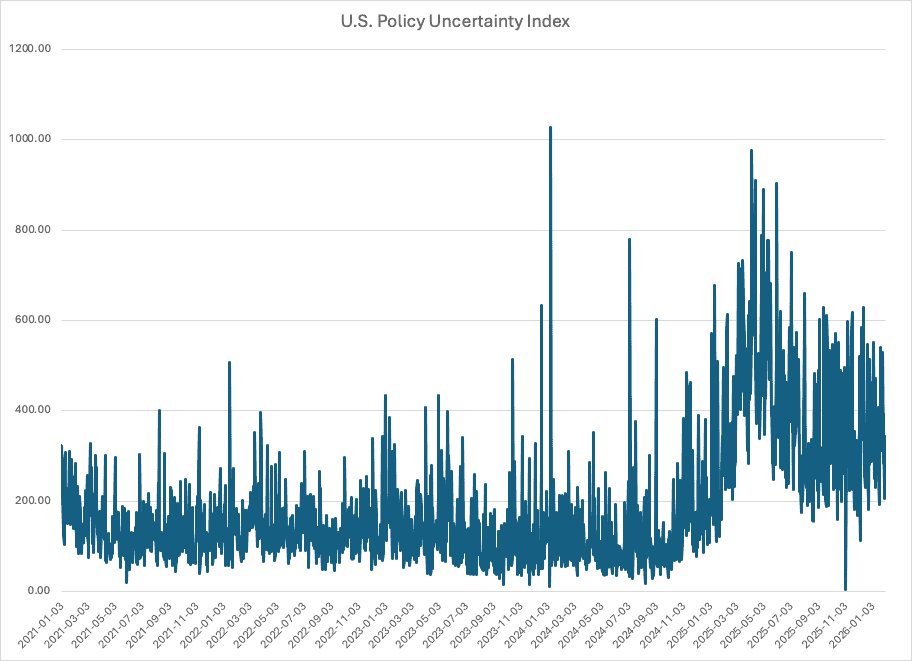
Source: Baker, Scott R., Bloom, Nick and Davis, Steven J., Economic Policy Uncertainty Index for United States [USEPUINDXD], retrieved from FRED, Federal Reserve Bank of St. Louis; Economic Policy Uncertainty Index for United States (USEPUINDXD) | FRED | St. Louis Fed, February 2, 2026.
But the Post article makes the stronger claim that this translates into particular economic outcomes (a lower value of the dollar, for example). As noted above, that made sense to Eakinomics, so a bit more data exploration was in order. The results, however, were a bit surprising.
The mechanism by which policy chaos or uncertainty affects the economy presumably involves noisy signals to private-sector decision-makers. Chief among those would be asset-market pricing, which directs the flow of capital into or out of the U.S. and across uses in the domestic economy. So, a volatile policy apparatus should be mirrored by volatility in those asset prices. Let’s take a look.
Begin with the dollar. Eakinomics calculated the daily percentage change in the value of the dollar for the Biden years and the Trump presidency. The volatility is measured by the standard deviation of these percent changes, which came in at 0.3063 percent for the Biden years. And Trump? Surprisingly, the volatility is lower at 0.2869 percent. Doing a similar calculation for the 10-year Treasury yield produced 2.2715 percent for Biden compared to 1.0669 for Trump. Looking at equity pricing using the S&P 500, however, produced 1.0122 percent for Biden but a slightly higher 1.1174 for the Trump year.
This is not high science and is hardly conclusive. But it is not a slam dunk case that the indisputably volatile policymaking of the administration is generating comparably volatile incentives in markets. Indeed, it may be the case that as time goes on the markets ignore more of the day-to-day noise, with a diminished headwind to the economy.
Fact of the Day
Across all rulemakings, federal agencies published roughly $1.8 billion in total costs and added 8 million paperwork burden hours.
