


The Daily Dish
November 30, 2022
The Fed and Measures of House Prices
Yesterday S&P released the September data on U.S. house prices (the S&P/Case-Shiller National Home Price Index), which is a good reminder to check in on the impact of the Fed’s tightening cycle on housing markets in the United States. (This is also a cheap way to advertise that I will be testifying on Thursday before the House Financial Services Committee on the topic of “Boom and Bust: The Need for Bold Investments in Fair and Affordable Housing to Combat Inflation.”)
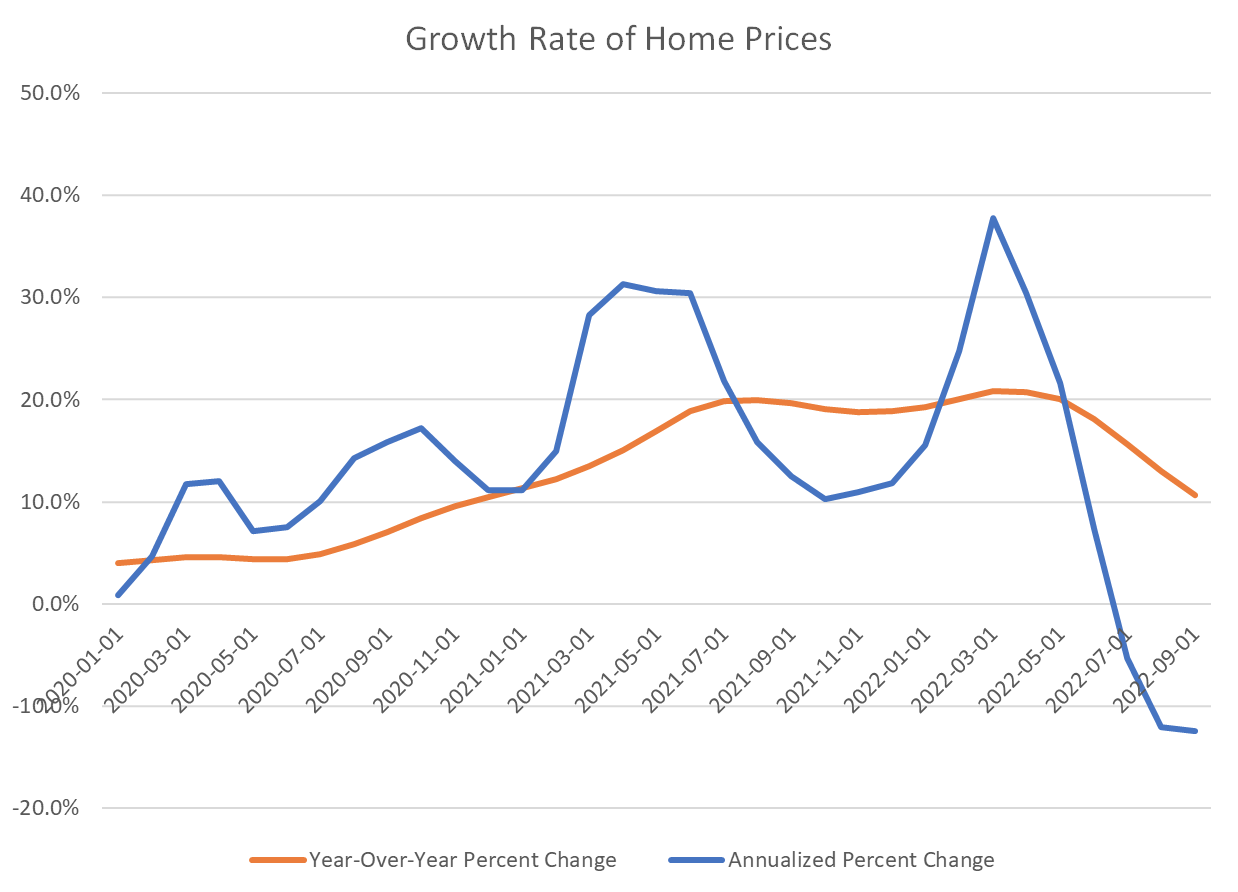
What do the data show? As shown in the chart below, the level of overall home prices declined in September, the third consecutive monthly decline. The blue line shows the monthly percent change at an annual rate, while the orange line shows the percent change from the same month one year earlier. This is quite a change from the double-digit yearly increases that have prevailed since the start of 2021. Clearly the sharp rise in mortgage and other interest rates has had a dramatic impact on home prices.
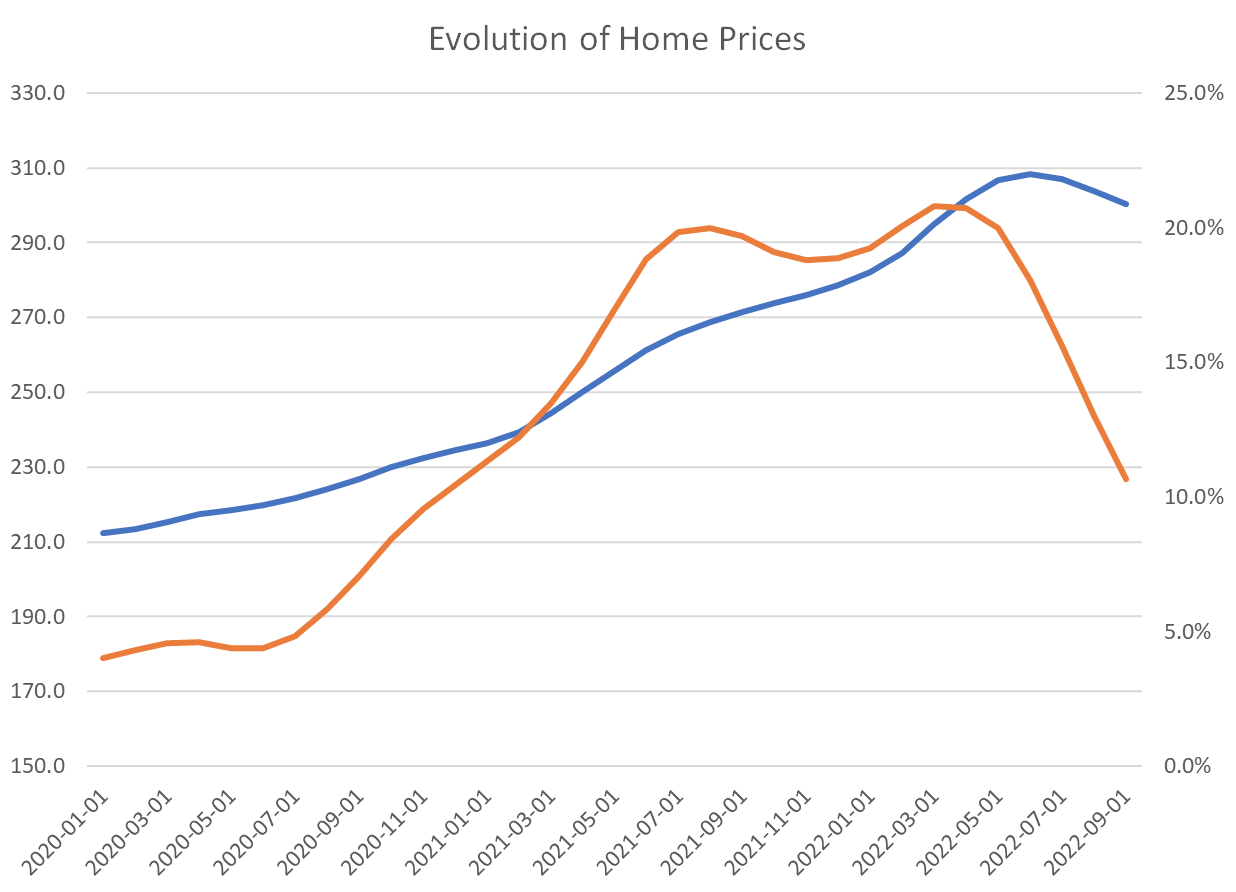
Nevertheless, despite the recent decline, the level of home prices (blue line, left axis) remains well above the price levels at the start of the pandemic. See graph, below, which also reproduces the year-over-year price growth from above (orange line, right axis).
The level versus growth rate is an important distinction when we think of the “cost” or consumer price of housing. For renters, this price is simply the rent. For owners, however, the price of consuming housing is not the purchase price. Instead, the right conceptual measure is the price at which the owner would rent the unit to herself. In a competitive housing market, that price would just cover the cost of providing the house for a year.
That cost would include the cost of financing the mortgage debt, the cost of not being able to put the equity into another asset and earning a rate of return, taxes, maintenance, and so forth. These costs are all typically a fraction of the house value, so – other things being the same – a rise in the house price raises the consumer price of housing.
But there is another key component: rising house values, also known as capital gains on housing. If house prices are rising, the ability to sell at a capital gain offsets the mortgage and other costs in whole or part. Thus, if owners expect house prices to rise, this lowers the effective consumer price. But this also works in reverse. If, as now, one might expect house prices to decline, the capital loss adds to the direct interest, taxes, and other costs to raise the consumer price of housing.
All of these considerations make judging the impact of the Fed tightening on consumer housing prices a bit complicated. During the boom, the high level of house prices increased the cost, but the very rapid expected capital gains made the effective consumer price much lower. Now, the opposite is happening. Yes, the level of home prices is falling, but the expectation of a capital loss is keeping the effective monthly price much higher.
Fact of the Day
The FDA estimates its rule regarding “Requirements for Additional Traceability Records for Certain Foods” will cost $6 billion over a 20-year window.
