


The Daily Dish
April 18, 2024
The Housing Market and Demography
Yesterday, Eakinomics focused on the tight supply-demand conditions in owner-occupied and residential rental housing. Yesterday also included Eakinomics participating in a panel discussion of the outlook for residential and commercial real estate in the United States. During the discussion of commercial real estate, the large, negative shock to the demand for office space that originated in the pandemic was the focus of attention. The reduced demand for office space has generated real credit risk for about $1 trillion of commercial real estate loans.
But the flip side of that negative shock for office space is a positive shock for some locations in the residential sector. This is part of the sustained rise in demand that is fueling shelter price inflation. As discussed yesterday, the high-rate environment that the Fed is forced to sustain impedes the construction of new supply.
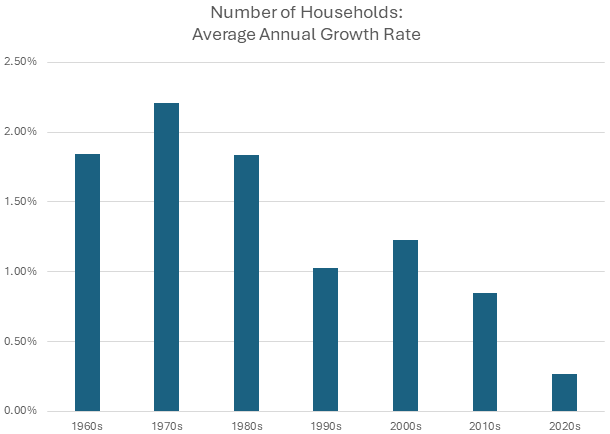
But there is another way for the housing market to adjust. If there are going to be fewer houses and/or apartments, create fewer households. That seems plausible, but Eakinomics had never checked the data. The chart below shows calculations based on Census data. Each bar represents the average annual growth rate for the number of households in the United States for the respective decades.
The data for the 1960s and 1970s show the influx of the baby boom generation, but the striking change is the 2020s. In the decade of the pandemic, (thus far) the growth rate of households has plummeted. Of course, this may be a transitory phenomenon, with new households forming as the housing market cools somewhat. But it is a reminder that not only does economics respond to demographic changes, but the reverse is true as well.
Fact of the Day
As of April 10, the Fed’s assets stood at $7.4 trillion.
