


The Daily Dish
November 21, 2022
The Science of Misery
As we near Thanksgiving, let us contemplate our misery. Just kidding! Many readers will be familiar with the “Misery Index” introduced by Brookings Institution economist Arthur Okun in the early 1970s. The Misery Index is the simple sum of the unemployment rate and the inflation rate, and it makes intuitive sense.
Inflation is bad, unemployment is bad, and both contribute to economic discontent or “misery.” Moreover, attempts to reduce inflation often involve rising unemployment (and vice versa) and the misery index captures these tradeoffs.
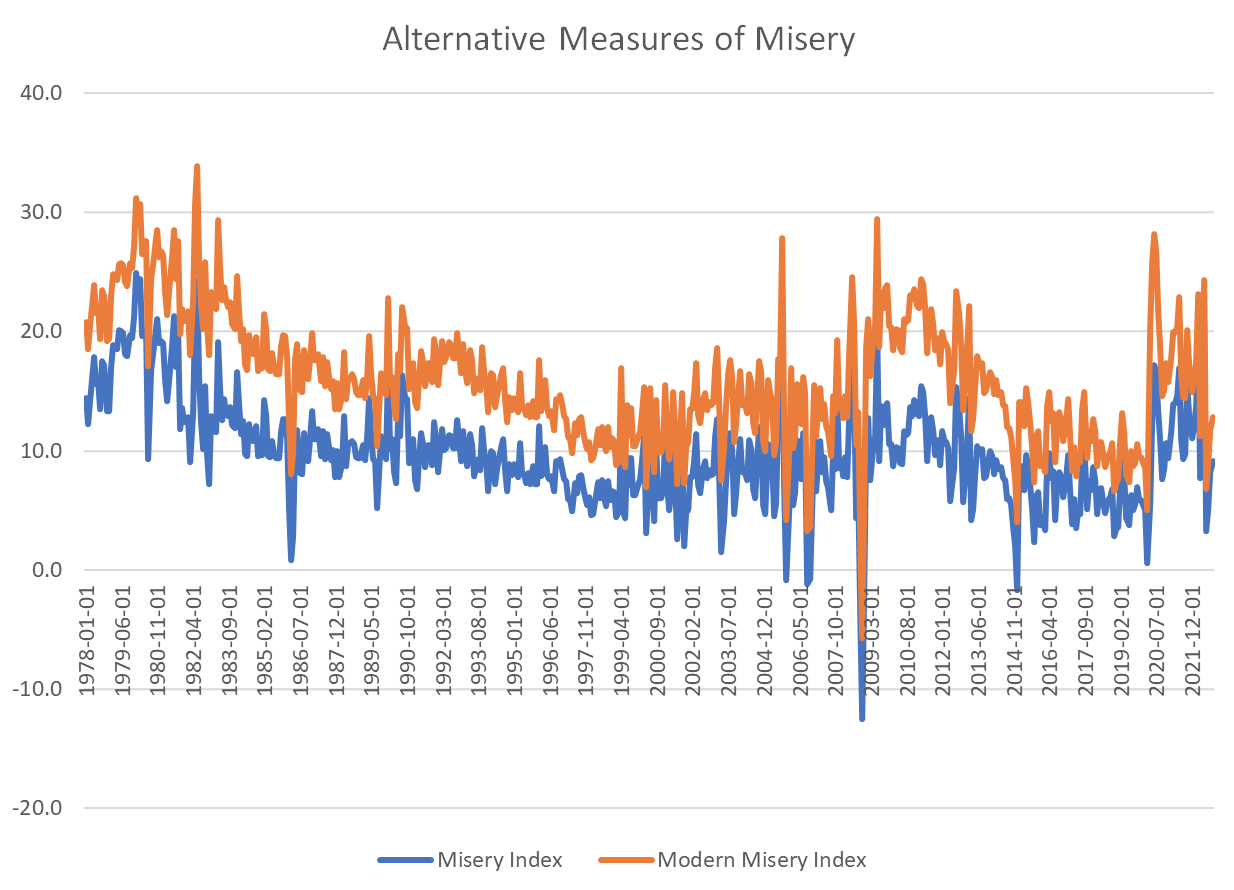
The misery index is shown in blue in the graph below. It indicates the very high misery index in the late 1970s, as well as the more recent rise since early 2021. A recent Wall Street Journal article points out that research by Andrew Oswald of the University of Warwick indicates: “A 1-percentage-point increase in the unemployment rate had an equivalent impact on happiness as a 1.97-point increase in the inflation rate. Mr. Oswald said that if he were to construct a Misery Index, he would make a simple modification: Multiply the unemployment rate by two and add it to the inflation rate.”
This “Modern Misery Index” is shown as the orange line in the graph. Adding a greater weight to unemployment does not dramatically change the insights from the misery index, but it does highlight the economic distress produced by nagging high unemployment during and after the Great Recession.
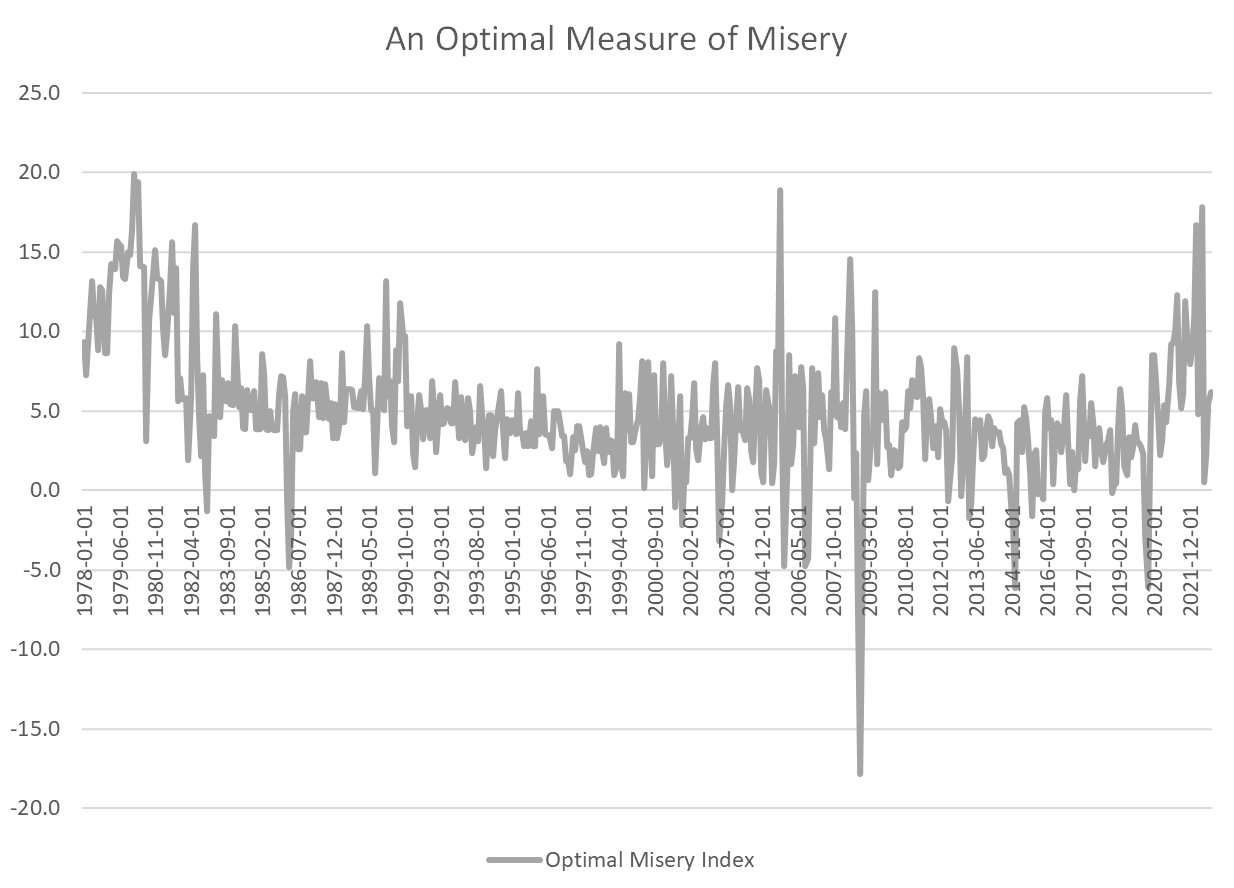
A final cut at the science of misery is contained in the final graph (below). In this case, the first step is to estimate the statistical relationship between the University of Michigan index of consumer sentiment and the unemployment and inflation rate. This indicates that increases in both unemployment and inflation reduce consumer sentiment. Yet the relative weight of unemployment is not twice as large as inflation, but rather only one-fifth as large (0.21 to be precise).
Despite its differences, this “Optimal Misery Index” does not tell a story much different than its predecessors. Misery was high in the 1970s, spiked again during the Great Recession, and was pushed north by the recent inflation.
Perhaps the lesson is that attempts to quantify economic misery are ultimately more art than science. One knows economic misery when one sees it, whether you can measure it or not.
Fact of the Day
EPA’s analysis estimates the total compliance costs of the supplemental proposed rule regulating methane emissions from the oil and natural gas industries to be $15 billion (at a 7 percent discount rate) from 2023–2035.
