Insight
February 3, 2026
2024 National Health Expenditures: Analyzing What We Spend on Health Care
Executive Summary
- The Centers for Medicare & Medicaid Services’ (CMS) actuaries recently released the 2024 National Health Expenditures (NHE), which summarizes national spending on health care.
- NHE 2024 data show total health spending grew to $5.28 trillion, with spending on hospitals and physician services making up $2.74 trillion, more than 50 percent of total NHE spending and over five times as much as the $467 billion spent on prescription drugs.
- This insight provides an in-depth look at NHE and the data it provides on where major spending is occurring; this is critical as the magnitude of these numbers is likely to spur policymakers and others to grasp for quick fixes to reduce spending – such as price caps or access restrictions – but such short-term actions are unlikely to yield effective long-term outcomes.
Introduction
The United States regularly spends trillions of dollars on health care, as illustrated in the recently released 2024 National Health Expenditures by the Centers for Medicare and Medicaid Services’ (CMS) Office of the Actuary. The report shows that health spending rose to $5.28 trillion in 2024 – a 7.83 percent increase from 2023; it is projected to rise significantly to $8.58 trillion in 2033, according to Health Affairs.
National Health Expenditures (NHE) are summary figures that compile the nation’s total spending on hospitals and professional services, residential and personal care, home health care, nursing care facilities, sales of medical products, administration of health insurance, government public health activities, and investments. NHE provide valuable insight into the distribution of health care spending in the United States. 2024 data show that of the $5.28 trillion in total health-related spending, spending on hospitals and physician and clinical services commanded $2.74 trillion – more than 50 percent of total NHE and over five times as much as the $467 billion spent on prescription drugs.
As policymakers and others look to reduce health care spending, the discussions often focus on addressing rising prices. Yet if the goal is to lower overall health spending over the long term, simply capping prices at an arbitrary level – which has become a popular go-to proposal – is unlikely to yield successful results. To further inform this discussion, this insight takes an in-depth look at what makes up NHE, and why context is vital when using NHE figures in health care reform conversations.
Spending Categories of NHE: Pulling Back the Curtain
NHE measure the total dollar amount of health care consumption in the United States – aggregating the dollar amounts spent on medical care and health administration, invested in medical sector structures and equipment, and devoted to non-commercial research in health care. NHE can provide a comprehensive outline of quantities that different sectors and payers are contributing to health spending; it is important, however, to remember that NHE are an output figure rather than a measure of value or utilization, and the context surrounding NHE is vital to understanding the figure itself.
The segments that make up the NHE include Personal Health Care (PHC) and Health Consumption Expenditures (HCE – see chart). PHC comprises all revenue received by health care providers and retail establishments for medical goods and services. HCE represents expenses for goods and services directly related to patient care, administration of health insurance, and public health activities, plus PHC. NHE equals HCE plus investment, or the sum of medical sector purchases of structures and equipment and expenditures for non-commercial medical research. 
The segments that make up NHE consist of a variety of categories. Some of the categories’ titles are broad, and understanding the definitions of the largest categories is helpful in contextualizing these figures. The three largest categories are hospital care, physician and clinical services, and prescription drugs. Hospital care refers to the sum of all services provided by hospitals to patients, and any other services billed by hospitals. Physician and clinical services – under professional services – covers the services provided in establishments operated by doctors, outpatient care centers, plus medical laboratories services. Prescription drugs – under retail outlet sales of medical products – is composed of retail sales of human-use dosage-form drugs, and products that are available only by a prescription. These categories represent more than 60 percent of 2024 NHE, significantly larger than all other categories combined.
Analyzing NHE Figures and Projections
Analysis of the 2024 NHE report shows a total expenditure of $5.28 trillion, with $4.51 trillion (over 85 percent of the total) made up of PHC categories. The three largest categories of NHE – hospital care at $1.63 trillion, physician and clinical services at $1.11 trillion, and prescription drugs at $467 billion – are all components of PHC. Hospitals and physician and clinical services alone command over 50 percent of 2024 NHE, with each quantity over twice as large as prescription drugs. Most health spending is dictated by individuals going to hospitals and physicians to receive care. This suggests that increased utilization of care, leading to increased spending, can be positive.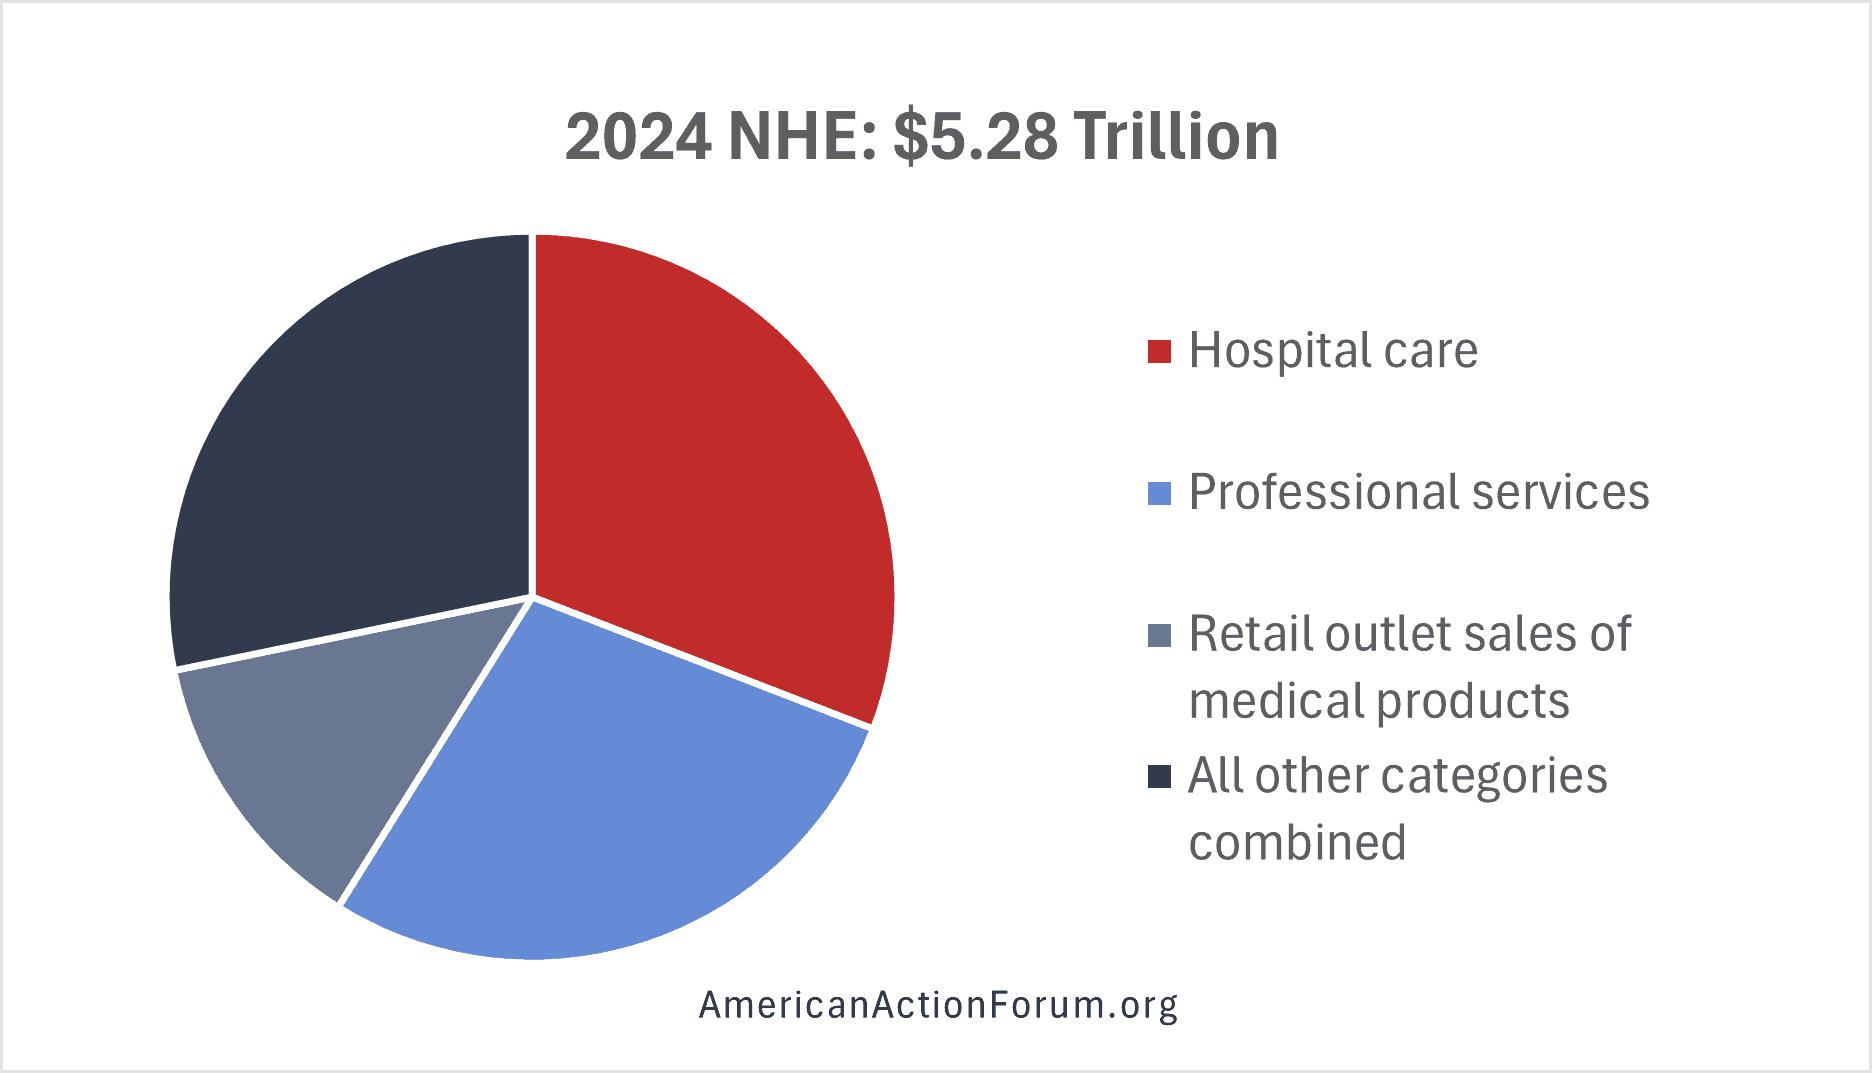
NHE 2033 projections illustrate significant future spending growth. While prescription drug spending is increasing at a rapid rate, the federal government’s mandatory spending on Medicare, Medicaid, and other health programs is the largest contributor to rising NHE.
The 2033 NHE are projected to reach $8.58 trillion, with PHC making up $7.29 trillion. The three largest categories remain unchanged: hospital care at $2.69 trillion; physician and clinical services at $1.67 trillion; and prescription drugs at $776.1 billion. The total increase is significant – a projected rise of 65 percent in NHE. When comparing the 2024 and 2033 numbers, none of the 10 categories that make up NHE saw greater than a 2 percent increase or decrease in share of NHE totals. These categories are expected to retain a consistent share of NHE over time, despite the significant increase in the NHE totals. This illustrates that the expected rise in NHE figures cannot solely be attributed to the rapid growth or decline of one of these categories.
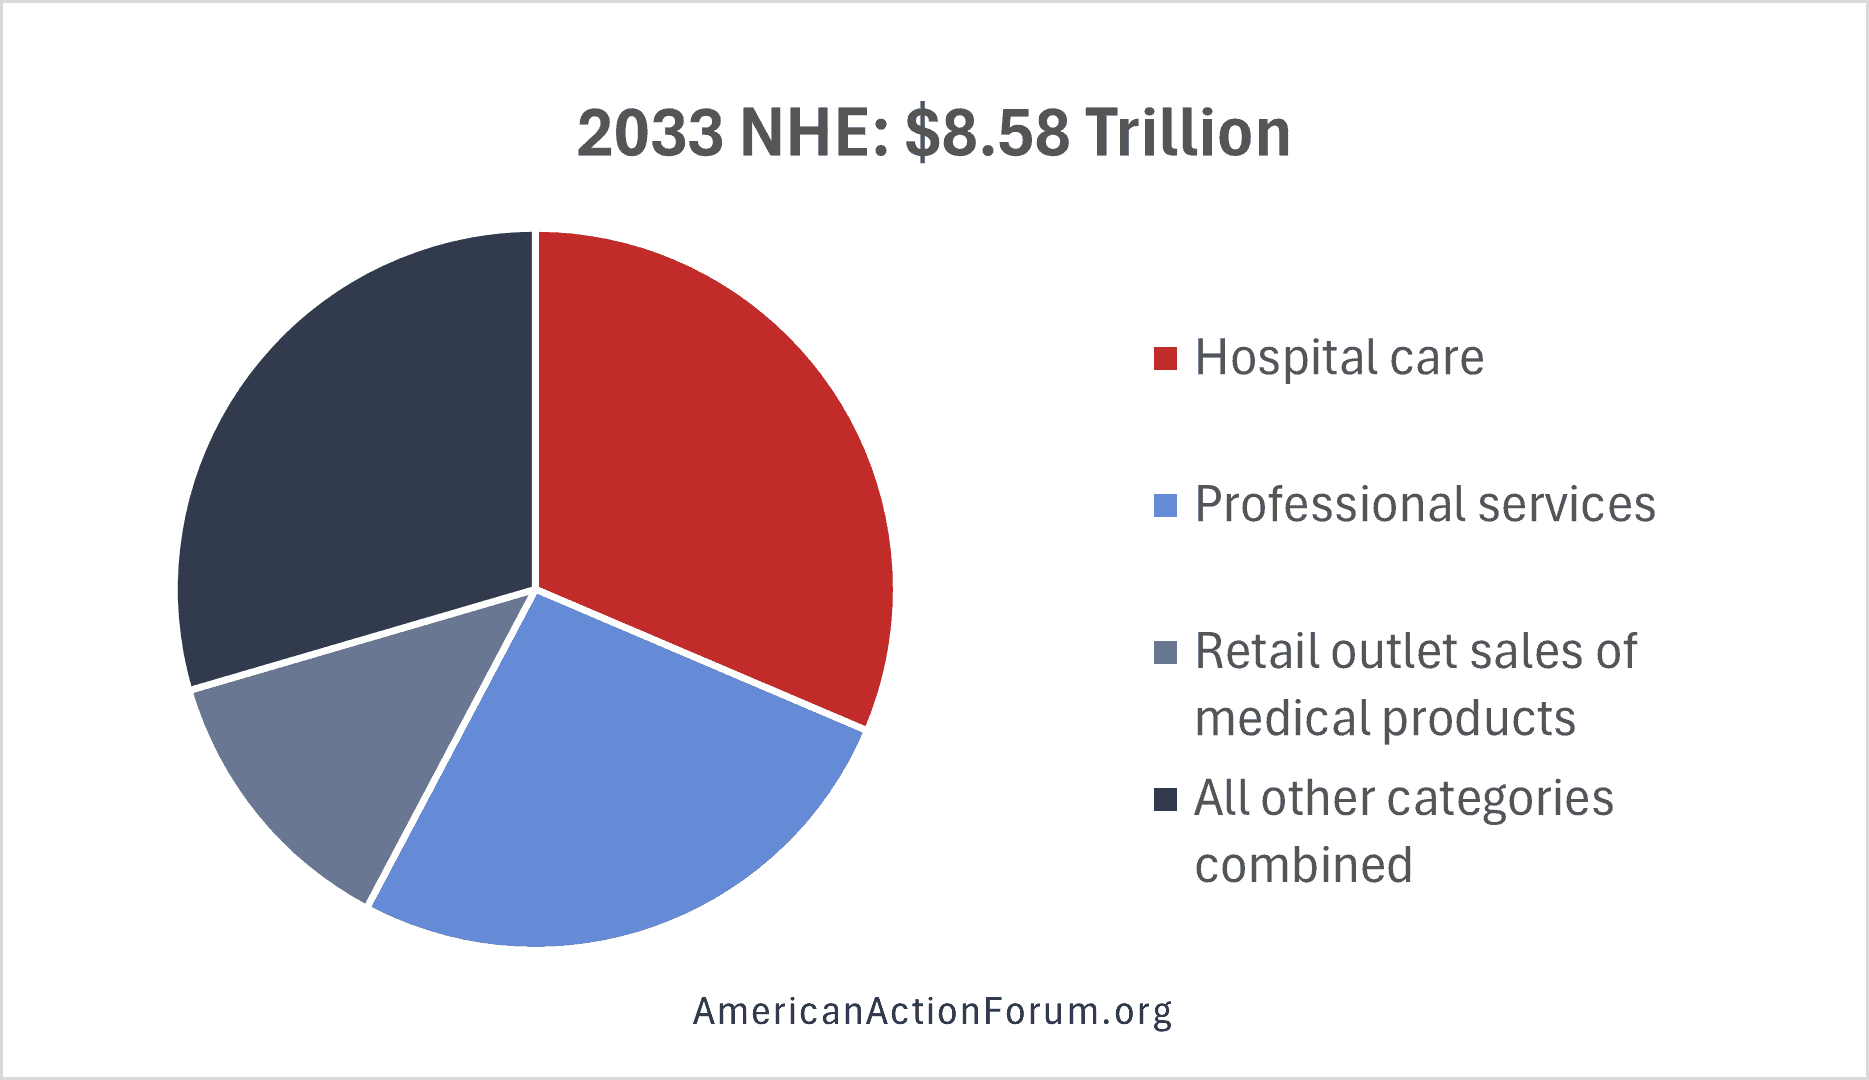
Health care inflation typically outpaces inflation in other sectors of the economy, contributing to patient concerns about prescription drug prices. Spending for prescription drugs grew at a faster rate (7.8 percent) than spending on hospitals (6.7 percent) and physician and clinical services (7.3 percent) from 2020 to 2024. NHE are expected to rise from $5.28 trillion in 2024, to $6.28 trillion in 2027, and $8.58 trillion in 2033. These projections from Health Affairs show that that from 2024-2033, NHE average annual growth rates are expected to outpace average annual gross domestic product growth (4.3 percent).
The largest share of NHE is federal health programs, which accounted for 31 percent in 2024. This spending total includes the federal portion of Medicaid payments, Medicare payments, contributions to private health insurance as an employer, and other federal health programs. Medicare benefit payments in 2000 were under $200 billion – a stark contrast from $910 billion in 2024 and a projected $1.8 trillion in 2035. The federal budget allocated $1.67 trillion to major health care programs in 2024 and an estimated $1.75 trillion in 2025, according to Peterson-KFF. This figure is projected to jump to $2.95 trillion by 2035. The aging population has a direct correlation with inevitable future increases in Medicare spending and therefore NHE.
Looking Forward
NHE can be an effective measure to review aggregated health spending. They should not be used, however, as a metric for analyzing the state of the health care economy and need to be interpreted with broader context. Conversations regarding health care spending often revolve around a limited scope of topics and issues. Increased NHE can reflect technological developments, changes in the demographic composition of the population, changes in the manner health care services are delivered, and price inflation for medical goods and services.
As noted by past American Action Forum work, a component of this discussion is understanding the difference between price and cost in health care. Lowering prices could reduce NHE in the short run. Underlying cost pressures, however, could drive long-run cost increases, causing NHE to continue rising. This complicates efforts to lower the associated prices and costs for over half of all NHE, without jeopardizing quality of care and long-run issues. If a hospital pays for a new electronic health record system, the cost of implementing this may increase spending, but result in more effective care. These developments help explain the layered considerations necessary to analyze health spending increases and NHE.