








Insight
October 8, 2026
CBO: FY 2026 Budget Deficit Totaled $2 Trillion
Executive Summary
- The Congressional Budget Office’s (CBO) September 2026 Monthly Budget Review shows the federal budget deficit totaled $2.0 trillion during fiscal year (FY) 2026 – $218 billion higher than the $1.8 trillion deficit recorded in FY 2025 and $140 billion above the $1.9 trillion deficit CBO projected in its latest baseline.
- The FY 2026 deficit was the net effect of $7.4 trillion of spending and $5.4 trillion of revenue collections
- The $218 billion increase in the deficit can be explained by a $386 billion increase in spending that more than offset the $169 billion of higher revenue collections.
Introduction
The Congressional Budget Office’s (CBO) September 2026 Monthly Budget Review shows the federal budget deficit totaled $2.0 trillion during fiscal year (FY) 2026. The $2.0 trillion deficit was the net effect of $7.4 trillion of spending and $5.4 trillion of revenue collections. The FY 2026 deficit was $218 billion higher than the $1.8 trillion deficit recorded in FY 2025 and $140 above the $1.9 trillion deficit CBO projected in its latest baseline. The difference between the FY 2025 and FY 2026 deficit was the net effect of a $386 billion increase in spending that more than offset the $169 billion of higher revenue collections.
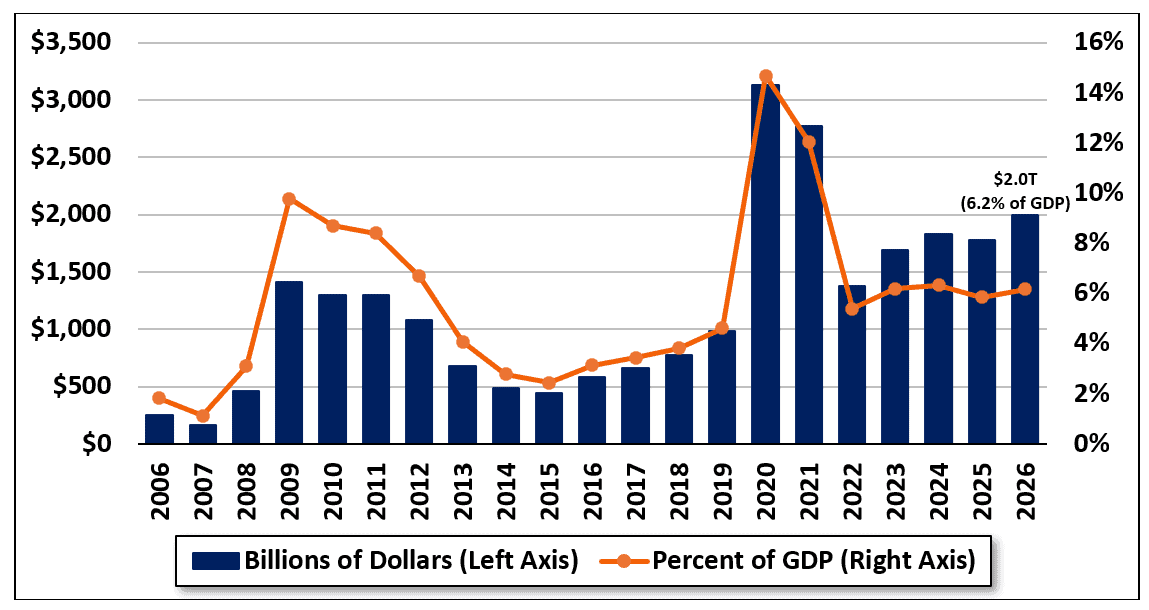
As a share of the economy, the FY 2026 deficit was an estimated 6.2 percent of gross domestic product (GDP), 0.3 percentage points of GDP higher than the 5.8 percent of GDP FY 2025 deficit.
Annual Budget Deficit, FY 2006–2026 (Billions of Dollars and Percent of GDP)
Source: CBO.
The $218 billion increase in the deficit between FY 2025 and FY 2026 can be explained by$271 billion of greater mandatory and discretionary spending, $115 billion of higher interest payments on the national debt, and $169 billion of higher revenue collections.
In nominal dollars, the FY 2026 deficit was the third largest in history, behind the COVID-19 pandemic-driven deficits of $3.1 trillion in FY 2020 and $2.8 trillion in FY 2021.
Revenue Was Up in FY 2026
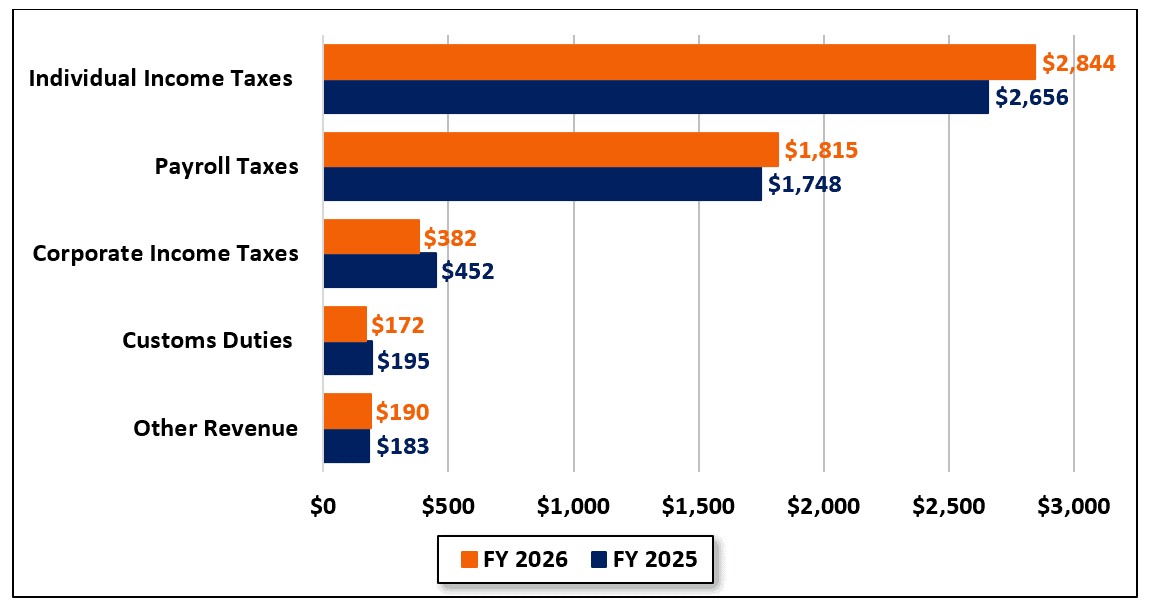
According to CBO, federal revenue collections rose by $169 billion (3 percent) between FY 2025 and FY 2026, from $5.2 trillion to $5.4 trillion. Individual income tax receipts increased by $188 billion (7 percent) and payroll tax collections rose by $67 billion (4 percent) due to higher wages and salaries. Corporate income tax receipts declined by $70 billion (16 percent) due to the One Big Beautiful Bill’s business tax changes, including larger tax deductions for certain business investments. Customs duties fell by $22 billion (11 percent). Customs duties were larger early in FY 2026 (October–April) but drastically declined between May and September as the federal government issued about $130 billion of the $166 billion of total eligible tariff refunds to businesses that paid tariffs imposed under the International Emergency Powers Act, which the Supreme Court ruled illegal.
Other sources of revenue, including estate and gift taxes and excise taxes, rose by $6 billion (3 percent), due to larger estate and gift tax collections and Federal Reserve remittances.
Federal Revenue Collections During FY 2026 and FY 2025 (Billions of Dollars)
Source: CBO.
Spending Was Up in FY 2026
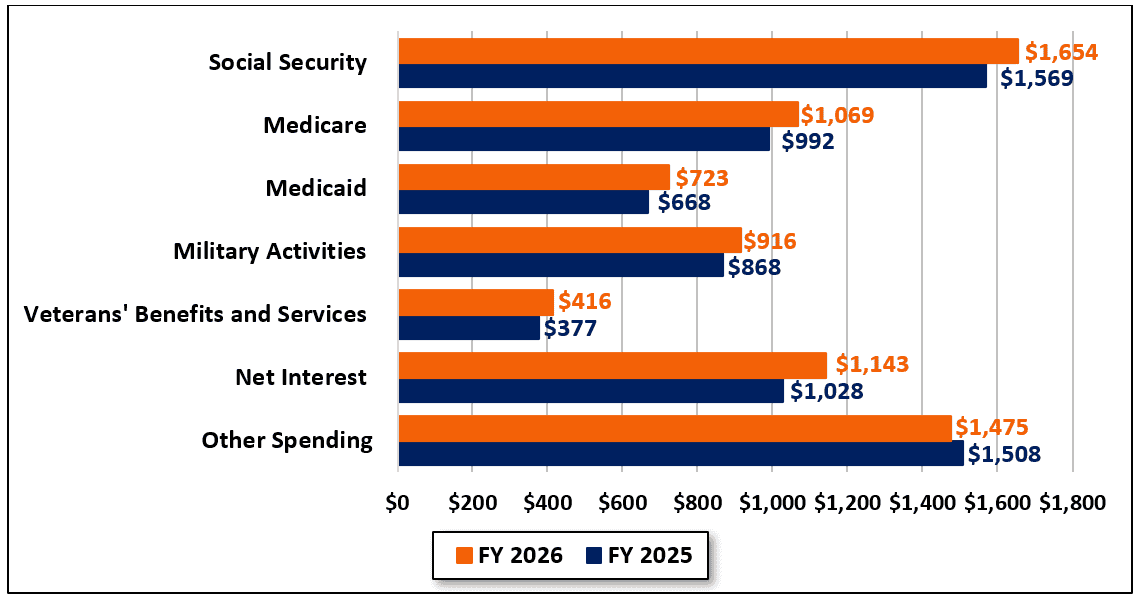
According to CBO, federal spending rose by $386 billion (6 percent) between FY 2025 and FY 2026, from $7.0 trillion to $7.4 trillion. Social Security spending increased by $86 billion (5 percent) due to increases in average monthly benefits and the number of beneficiaries enrolled in the program. Medicare spending rose by $77 billion (8 percent) due to higher enrollment and payment rates for services, and Medicaid spending increased by $55 billion (8 percent) because of higher per-enrollee costs.
Department of Defense spending on military activities increased by $48 billion (5 percent) due to higher spending on military personnel and research and development. Spending on veterans’ benefits and services rose by $39 billion (10 percent) because more people received benefits and per-beneficiary spending rose. Other programmatic spending fell by $33 billion (2 percent).
Federal Spending During FY 2026 and FY 2025 (Billions of Dollars)
Source: CBO.
Interest payments on the national debt increased by $115 billion (11 percent) because the debt was larger and long-term interest rates were higher. A decline in short-term interest rates partially offset the increase in interest payments. Net interest was the second-largest government expenditure behind Social Security.
The National Debt Is Unsustainable
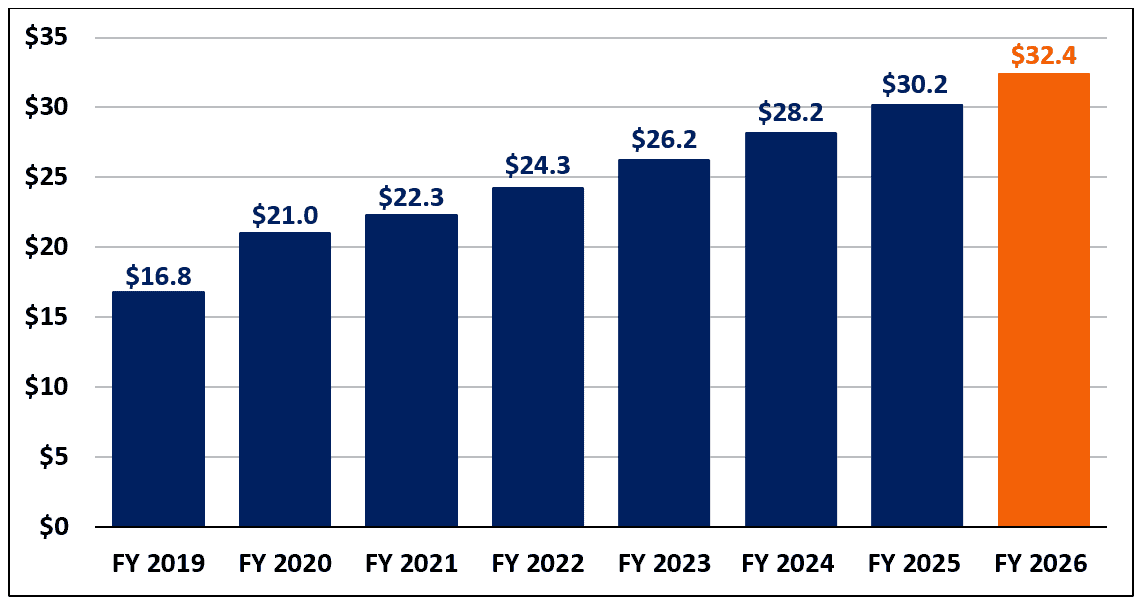
At the end of FY 2026, federal debt held by the public totaled $32.4 trillion. This was $2.3 trillion higher than the $30.2 trillion debt at the end of FY 2025.
As a share of GDP, the debt was an estimated 100 percent – 0.5 percentage points higher than the 99 percent debt-to-GDP at the end of FY 2025. The debt is projected to continue to rise over both the short- and long-term, in both nominal dollars and as a share of GDP.
Federal Debt Held by the Public, FY 2019-2026 (Trillions of Dollars)
Sources: CBO and U.S. Department of the Treasury.