Insight
August 17, 2016
Does Globalization Hurt the Middle Class?
Donald Trump’s jobs plan is largely defined by his desire to overhaul U.S. trade policy. During an address at a metals recycling facility in Pennsylvania, the Republican nominee asserted that “globalization has wiped out our middle class.” To rebuild it, Trump proposed withdrawing from major trade deals including the Trans-Pacific Partnership (TPP) and the North American Free Trade Agreement (NAFTA). He also argued that restricting trade would be a job creator. By imposing high taxes on imports, Trump pledged to increase domestic production and bring jobs back to the U.S.
On the opposite side of the aisle, Hilary Clinton is not far from Trump on this issue. She spoke at length about the weaknesses of trade during an economic policy speech last week. After declaring that “past trade deals have been sold to the American people with rosy scenarios that did not pan out,” she vowed to “stop any trade deal that kills jobs or holds down wages – including the Trans-Pacific Partnership.”
Both candidates maintain that they want to advance American prosperity. Each has also blamed trade for the economic woes of working class families. But is globalization really the culprit?
A major criticism of globalization is that U.S. companies are harmed by import competition. The fear is that nations with less expensive production costs (driven by cheap labor and government subsidies) will be able to sell competing products at lower prices. This concern, while legitimate, may be exaggerated. The table below shows that the overall impact of import competition on job loss is negligible.
Table 1: Job Separations Due to Import Competition
|
Year |
Job Separations Due to Import Competition |
Total Separations |
Percentage of Total Separations Due to Import Competition |
|
1997 |
12,770 |
1,146,115 |
1.1% |
|
1998 |
18,473 |
1,227,573 |
1.5% |
|
1999 |
26,684 |
1,149,267 |
2.3% |
|
2000 |
13,416 |
1,170,427 |
1.1% |
|
2001 |
28,008 |
1,750,643 |
1.6% |
|
2002 |
15,350 |
1,272,331 |
1.2% |
|
2003 |
23,734 |
1,216,886 |
2.0% |
|
2004 |
8,064 |
993,511 |
0.8% |
|
2005 |
11,112 |
884,661 |
1.3% |
|
2006 |
10,458 |
935,969 |
1.1% |
|
2007 |
11,589 |
966,526 |
1.2% |
|
2008 |
9,679 |
1,516,978 |
0.6% |
|
2009 |
3,192 |
2,108,202 |
0.2% |
|
2010 |
1,199 |
1,257,134 |
0.1% |
|
2011 |
1,214 |
1,112,710 |
0.1% |
Table 1 displays data from the Bureau of Labor Statistics (BLS)’s Extended Mass Layoff Reports. These reports explain the primary reasons why U.S. workers are separated from their jobs. An extended mass layoff is defined as a layoff event resulting in at least 50 unemployment insurance claims filed against the same establishment within a five-week period, and one in which at least 50 workers were separated from their jobs for more than 30 days.
At the high water mark in 1999, import competition was responsible for 2.3 percent of total annual job separations. In 2011, the last year of available data, only 0.1 percent of total separations were due to import competition. As a comparison, government regulation accounted for 1,500 separations (0.1 percent) and the end of seasonal work accounted for 393,000 (35.3 percent) in 2011.
Critics also worry that globalization incentivizes American companies to move overseas. This issue has been raised repeatedly during the election season. Donald Trump has repeatedly condemned U.S. firms like Ford and Carrier for opening production facilities in Mexico, while Hilary Clinton has criticized Trump for offshoring the production of his suits and ties. However, similar to import competition, offshoring does not have a large effect on overall job displacement.
Table 2: Job Separations Due to Overseas Relocation
|
Year |
Total Job Separations |
Separations Due to Overseas Relocation |
Percentage of Total Separations Due to Overseas Relocation |
|
1997 |
1,146,115 |
10,439 |
0.9% |
|
1998 |
1,227,573 |
8,797 |
0.7% |
|
1999 |
1,149,267 |
5,683 |
0.5% |
|
2000 |
1,170,427 |
9,054 |
0.8% |
|
2001 |
1,750,643 |
15,693 |
0.9% |
|
2002 |
1,272,331 |
17,075 |
1.3% |
|
2003 |
1,216,886 |
13,205 |
1.1% |
Data in the above table was also taken from BLS’s Extended Mass Layoff Reports. Because BLS stopped collecting information on overseas job relocations in 2004, data is only available until 2003. However, the pattern is clear: overseas relocation is not a giant job killer. Even in the aftermath of NAFTA, which took effect in 1994, offshoring never displaced more than 20,000 workers annually. Furthermore, it only triggers around 1 percent of annual job separations.
It is also valuable to examine offshoring in the context of all possible types of company relocations. While job separations due to domestic relocation are offset by job gains elsewhere, U.S. workers who temporarily lose their jobs are similarly affected by both domestic and overseas relocations. Table 3 (below) contrasts job separations from firms that relocated within the U.S. to those that moved abroad.
Table 3: Job Separations Due to Domestic Relocation vs. Overseas Relocation
|
Year |
Total Job Separations Due to Company Relocation | Percentage Due to Overseas Relocation | Percentage Due to Domestic Relocation |
| 1997 | 25,864 | 40.4% | 59.6% |
| 1998 | 24,863 | 35.4% | 64.6% |
| 1999 | 15,606 | 36.4% | 63.6% |
| 2000 | 20,542 | 44.1% | 55.9% |
| 2001 | 34,345 | 45.7% | 54.3% |
| 2002 | 36,982 | 46.2% | 53.8% |
| 2003 | 29,010 | 45.5% | 54.5% |
Not only does offshoring account for a minor percentage of job separations, but the number of workers displaced annually by domestic relocation is consistently larger than the number displaced by overseas relocation. In the last year of available data, 54.5 percent of job displacements were due to relocations within the U.S., while 45.5 percent were caused by relocations to different country.
The data on trade-related job loss suggests that anti-trade rhetoric on the campaign trail has been exaggerated. This includes the assertion that trade is decimating our middle class. Last year, Pew Research Center released a report examining the changing size and makeup of the American middle class. While the report confirms that the middle class is shrinking, more have moved up the economic ladder than down. From 1971 to 2015, the share of Americans in the middle class fell from 61 percent to 50 percent. Meanwhile, the upper class grew by 7 percent and the lower class by only 4 percent. This means that nearly twice the number of middle class Americans moved to the upper class than to the lower class.
The connection between international trade and economic growth is simple. As nations engage in trade, they specialize in the goods and services they can most efficiently produce. For example, the share of total U.S. nonfarm workers in service-providing industries has shot up 26.4 percentage points since 1945. This shouldn’t be surprising; the U.S. is a global leader in services trade. In 2013, we had a services trade surplus of $230.5 billion and services exports totaled $662.1 billion. Furthermore, services account for 78 percent of private sector Gross Domestic Product and the U.S. is the world’s largest single-country exporter and importer of services.
These shifts can change the composition of our labor market. By definition, as the share of workers in service-providing industries goes up, the share of workers in the goods-producing industries goes down. However, by generating productivity advancements in what we do produce, trade also creates wealth. The chart below shows that the U.S. did not experience any significant economic growth until the “globalization bang” in the 19th century. Once industrialization drove down production and transportation costs, the U.S. increased its volume of trade and the economy expanded.
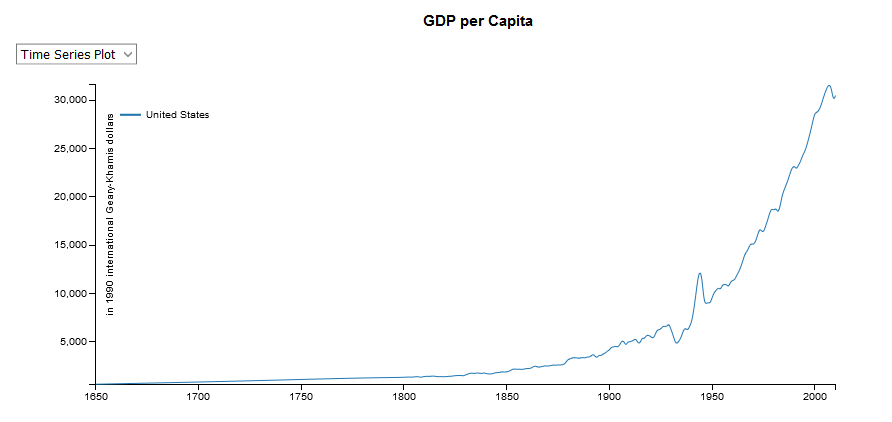
Source: The Netherlands Organisation for Scientific Research
Shielding the U.S. from globalization would be a mistake. The cost of protectionism is high, while trade has been shown to drive economic growth. It is true that labor market shifts can cause some workers to be displaced; and affected workers need suitable job training to help them transition into growing industries. However, if the 2016 presidential candidates truly want to increase American prosperity and generate growth, they should embrace the benefits of trade.