Insight
April 13, 2018
Highlights from the 2017 NAEP Mathematics & Reading Assessments
The biannual results from the National Assessment of Education Progress (NAEP) has been released. The results indicate little change since the last test: While eight-grade reading scores saw a slight uptick, there were no changes for reading at fourth grade or for mathematics at either grade. What follows are the highlights from additional key findings prefaced by a technical refresher on The Nation’s Report Card.
Understanding NAEP
NAEP was administered between January and March of 2017 to a nationally representative sample of 149,400 fourth graders and 144,900 eighth graders. The results for reading and mathematics are reported as average scores on a 0-500 scale. These scale scores summarize the overall level of performance attained by the students. Scores for individual students are not reported, but summary statistics describing scale scores for groups of students (demographic, gender, race/ethnicity, etc.) are reported.
Achievement on NAEP is based upon performance standards that describe what students should know and be able to do at their grade level. A broadly representative panel of teachers, education specialists, and other experts from the general public formulate the achievement standards. Results are reported as percentages of students performing at or above four achievement levels – Below Basic, Basic, Proficient, and Advanced. Students performing at or above the Proficient level on NAEP assessments demonstrate solid academic performance and competency over challenging subject matter.[i]
Comparisons between years or among groups are based on statistical tests that consider both the size of the difference and the standard errors of the two statistics being compared. Standard errors and estimates based on smaller groups are likely to have larger margins of error. For example, a 2-point change in the average score for the nation may be statistically significant, while a 2-point score change for a state is not due to the size of the standard errors for the score estimate. The size of the standard errors may also be influenced by other factors, such as the degree to which the assessed students are representative of the entire population.
A scale score that is significantly higher or lower in comparison to an earlier assessment year is reliable evidence that student performance has changed. NAEP is not, however, designed to identify the causes of change in student performance. Although comparisons are made in students’ performance based on demographic characteristics and educational experiences, the comparisons cannot be used to establish a cause-and-effect relationship between the characteristic or experience and achievement. Many factors may influence student achievement, including educational policies and practices, available resources, and the demographic characteristics of the student body. Such factors may change over time and vary among student groups.[ii]
Average Scores from 1990 to 2017

Compared to 2015, there was a 1-point increase in the average reading score among eighth graders in 2017, but no significant change in the average score for reading among fourth graders, or for mathematics at either grade. Compared to the initial assessments in the early 1990s, average scores for both subjects were higher for both grades this year. It is important to note, however, that the scores have largely plateaued and remained static for the better part of the last decade.
Performance Gap Widening
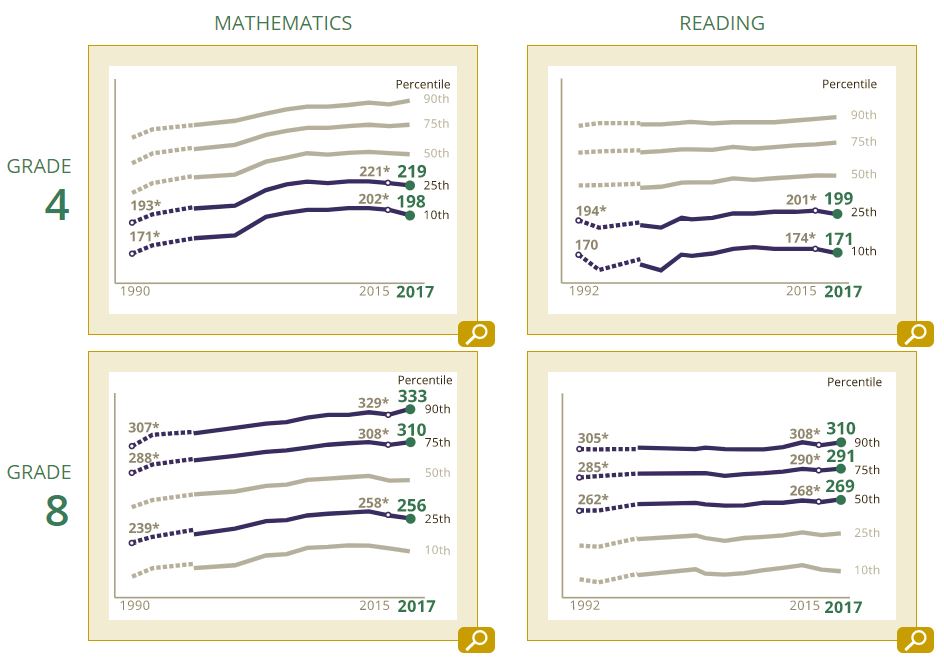
Breaking out the performance of students into five percentile groups shows the progress made by students at the lower (10th and 25th percentiles), middle (50th percentile), and higher (75th and 90th percentiles) ends of student performance. The 2017 results show that mathematics and reading scores were generally higher for at the 75th and 90th percentiles and lower for the 10th and 25th percentiles than the last sitting of the test.
In other words, while the national average remains flat or unchanged for the better part of the last decade, the lower performing students saw their scores decrease while the upper percentiles continue to see gains.
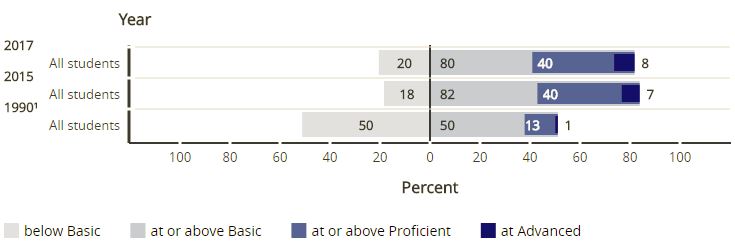
Achievement Levels of Students
As mentioned above, results are reported as percentages of students performing at or above four achievement levels – Below Basic, Basic, Proficient, and Advanced. The charts below detail the achievement of all students comparing 1990, 2015, and 2017.
Fourth-Grade Mathematics
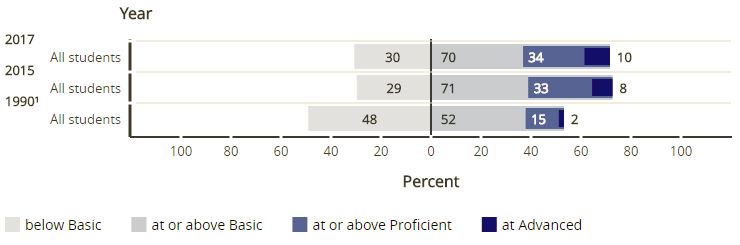
Eighth-Grade Mathematics
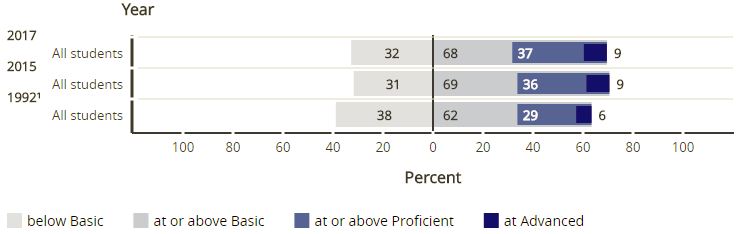
Fourth-Grade Reading
Eighth-Grade Reading
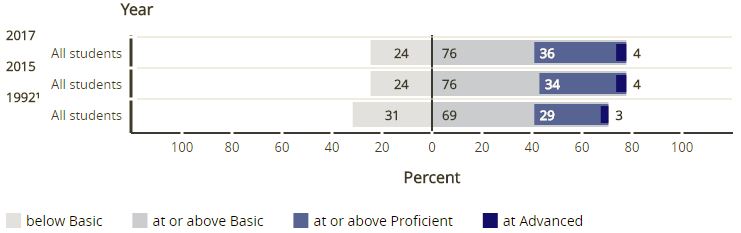
As you can see from the charts, the percentage of students that score below basic has shrunk since the initial testing but comparing the results for the 2015 and 2017 test reveals little to no change. Most disturbing is the lack of improvement and the overall small percentage of students that score proficient or advanced. In general, in both subjects and at both grades, roughly only 40 percent of student appear to have achieved proficiency or above.
Conclusion
Certainly, there is a wealth of information that can be gleaned from the NAEP results. Not included in this summary is a look at performance by race, gender, and or socioeconomic status, to name a few options. Nevertheless, the indicators included here are a useful representation of how our nation’s students perform against a reasonable and meaningful set of expectations. The leveling-off of average scores, the widening of the achievement gap between the top performers and the bottom, and the relatively small number of students reaching proficiency all contribute to the skills gap being felt in the U.S. economy’s workforce.
The relationship between educational achievement and long-run economic growth has long been studied. Stanford University economist and AAF education expert Eric Hanushek found that from 1970 to 2010, a one standard deviation increase in NAEP scores was associated with a 1.4 percentage point increase in the average annual economic growth rate. Moreover, using NAEP scores, AAF detailed how increased GDP growth, job growth, educational attainment, and state tax revenue are all associated with increased average NAEP scores.[iii]
Insofar as NAEP scores provide a metric for measuring the strength of the economy, the most recent results indicate there is some reason for concern.
[i] NAEP Proficient achievement level does not represent grade level proficiency as determined by other assessment standards (e.g., state or district assessments).
[ii] Institute for Education Sciences; National Center on Education Statistics; The National Assessment of Educational Progress (NAEP) – Understanding Assessment Results. Web accessed April 09, 2018. https://nces.ed.gov/nationsreportcard/guides/scores_achv.aspx
[iii] Miller, Gitis, Arndt. A Recipe for Prosperity: The Quality of Educational Standards and Economic Growth. April 27, 2016. Available at: https://www.americanactionforum.org/research/recipe-prosperity-quality-educational-standards-economic-growth/