Insight
February 11, 2026
Highlights of CBO’s February 2026 Budget and Economic Outlook
Executive Summary
- The Congressional Budget Office (CBO) has released its February 2026 Budget and Economic Outlook, projecting that federal debt held by the public will rise from 99 percent of gross domestic product (GDP) at the end of fiscal year (FY) 2025 to 101 percent of GDP by the end of FY 2026, reach a new record of 108 percent of GDP by FY 2030, and continue to grow to 120 percent of GDP by the end of FY 2036.
- Budget deficits will total 6.1 percent of GDP ($24.4 trillion) over the FY 2027 to FY 2036 budget window and total 6.7 percent of GDP ($3.1 trillion) in FY 2036; spending will total 23.8 percent of GDP ($94.6 trillion) and revenue will total 17.7 percent of GDP ($70.2 trillion) over the next decade.
- Since CBO’s last baseline in January, the net effect of legislative, economic, and technical changes increased projected deficits by $1.4 trillion over the FY 2026 to FY 2035 period; the agency also projects that economic growth and inflation will slow through 2026 and remain moderate thereafter.
Introduction
The Congressional Budget Office (CBO) has released its February 2026 Budget and Economic Outlook, which updates its January 2025 Budget and Economic Outlook to account for subsequent legislation and executive actions, recent trends in inflation, economic growth, interest rates, demographics, and other factors. Overall, the budget outlook has worsened since last January due to legislative and economic changes. CBO’s projection of budget deficits over the fiscal year (FY) 2026 to FY 2035 period is $1.4 trillion higher than CBO estimated in January 2025.
What’s Changed?
The budget outlook has deteriorated since CBO’s January 2025 Budget and Economic Outlook. CBO now estimates budget deficits will total $23.1 trillion over the FY 2026 to FY 2035 period, which is $1.4 trillion above its January 2025 projection of $21.8 trillion. This deterioration is the net effect of a $3.4 trillion increase in projected deficits from legislative changes and a $704 billion increase from technical changes that is partially offset by a $2.7 trillion reduction in projected deficits from technical changes.
Legislative Changes
Most of the $3.4 trillion increase in projected deficits due to legislative changes stems from the enactment of the One Big Beautiful Bill (OBBB) in July 2025. For a full breakdown of the OBBB’s provisions, see here.
CBO estimates the OBBB decreased projected mandatory spending by $1.2 trillion on net over the FY 2026 to FY 2035 period. Some of the law’s provisions decreased projected mandatory spending while others increased it. The reductions include $1.2 trillion from the law’s changes to Medicaid, $211 billion from its changes to the Supplemental Nutrition Assistance Program (SNAP), $158 billion from its reforms to the federal student loan system, $130 billion from provisions that restrict eligibility for and create new reporting requirements and limits on beneficiaries’ ability to receive Affordable Care Act (ACA) premium tax credits, $85 billion from allowing the Federal Communications Commission to conduct spectrum auctions, and $80 billion from the repeal of green energy tax credits. The increases include $190 billion from changes to the Earned Income Tax Credit (EITC) and the Child Tax Credit (CTC), $167 billion for immigration enforcement, $156 billion to expand shipbuilding programs, carry out air and missile defense activities, and purchase munitions, $75 billion from increased funding for agriculture programs, $39 billion for Medicare and other health programs, and $23 billion for the U.S. Coast Guard, among other provisions.
CBO reduced its projection of federal revenues by $4.9 trillion due to the OBBB’s changes to the federal tax code. CBO estimates that over 80 percent of the reduction stems from the OBBB’s provisions that extended most of the Tax Cuts and Jobs Act’s provisions that were scheduled to expire on December 31, 2025. Due to the OBBB, CBO reduced its projection of individual income tax revenue by $4.4 trillion, its estimate of corporate income tax revenue by $352 billion, and its estimate of other revenue by $177 billion. The OBBB’s provision to end the de minimis exemption that allowed commercial packages worth less $800 to enter the U.S. duty-free increased CBO’s projection of federal revenues by $59 billion.
CBO revised its projection of discretionary spending down by $1.0 trillion over the FY 2026 to FY 2035 period. This revision is the net result of a $1.2 trillion decrease in projected nondefense discretionary spending and a $174 billion increase in projected defense discretionary spending. CBO’s projection of total nondefense spending was revised down to account for a decrease in emergency spending in CBO’s baseline. CBO revised its estimate of total defense spending up due to the expiration of the Fiscal Responsibility Act’s caps on defense spending and a higher projected amount of total defense spending in FY 2026. Since CBO’s baseline assumes that defense spending will grow with inflation over the next decade, its larger projection of FY 2026 defense spending led it to project higher total defense spending through FY 2035 than it did in its January 2025 baseline.
The remaining $742 billion of projected deficit increases from legislative changes is debt service costs.
Economic Changes
CBO expects economic changes to increase projected deficits by $704 billion on net over the FY 2026 to FY 2035 period. Of this amount, $1.3 trillion comes from higher projections of federal spending due to economic changes. This includes a $270 billion increase in projected mandatory spending, mostly from inflation-related increases in projected Social Security and SNAP spending, and a $70 billion increase in projected discretionary spending. The remaining $938 billion comes from higher projections of net interest payments due to changes in CBO’s forecast of interest rates and inflation. Specifically, CBO increased its forecast of interest rates on Treasury securities.
CBO expects higher projections of federal revenue collections due to economic changes to reduce projected deficits by $573 billion. This largely stems from higher projections of economic output and the components of taxable income in CBO’s economic forecast. In addition, higher asset values increased anticipated capital gains realizations, which increased CBO’s projections of individual and corporate income tax receipts, as well as the projected account balances and distributions from taxable retirement accounts. An upward revision in CBO’s projection of Federal Reserve remittances – due to lower projected near-term interest rates in CBO’s economic forecast – also reduced projected deficits.
Technical Changes
CBO projects technical changes to increase projected deficits by $2.7 trillion on net over the FY 2026 to FY 2035 period. This includes a $1.5 trillion increase in projected spending that’s more than offset by a $4.2 trillion increase in projected revenue due to technical changes.
Of the $1.5 trillion of projected spending increases, $973 billion is due to higher projections of Medicare spending. CBO projects greater spending on prescription drugs under Medicare Part D, greater use of Medicare’s fee-for-service program, and less use of the Medicare Advantage program. Another $697 billion is due to higher projections of Medicaid spending and $600 billion from larger estimates of spending on veterans’ benefits and services. CBO reduced its projection of spending on green energy tax credits by $127 billion to reflect CBO’s change in how it classifies the credits. Projected Social Security spending fell by $105 billion due to a downward revision in CBO’s estimate of people over age 65. Estimated spending on ACA premium tax credits and related programs fell by $79 billion, largely due to an estimated reduction in enrollment in health insurance plans sold through ACA marketplaces. SNAP spending fell by $41 billion due to lower projections of enrollment in the program. Projected EITC and CTC spending increased by $29 billion and agriculture program spending by $25 billion due to technical changes. CBO increased its projection of discretionary spending by $11 billion due to technical changes.
Of the $4.2 trillion increase in projected revenue increases, $3.4 trillion comes from higher customs duties because of the administration’s tariff policies over the past year. $902 billion comes from higher individual income tax collections and $59 billion from higher corporate income tax collections. Payroll tax collections are projected to fall by $120 billion and other sources of revenue – including excise taxes – decreased by $44 billion due to technical changes.
Other technical changes reduced projected deficits by $483 billion, largely due to the debt service effects of the technical adjustments CBO made to its projections.
The Budget Outlook by the Numbers
Revenues
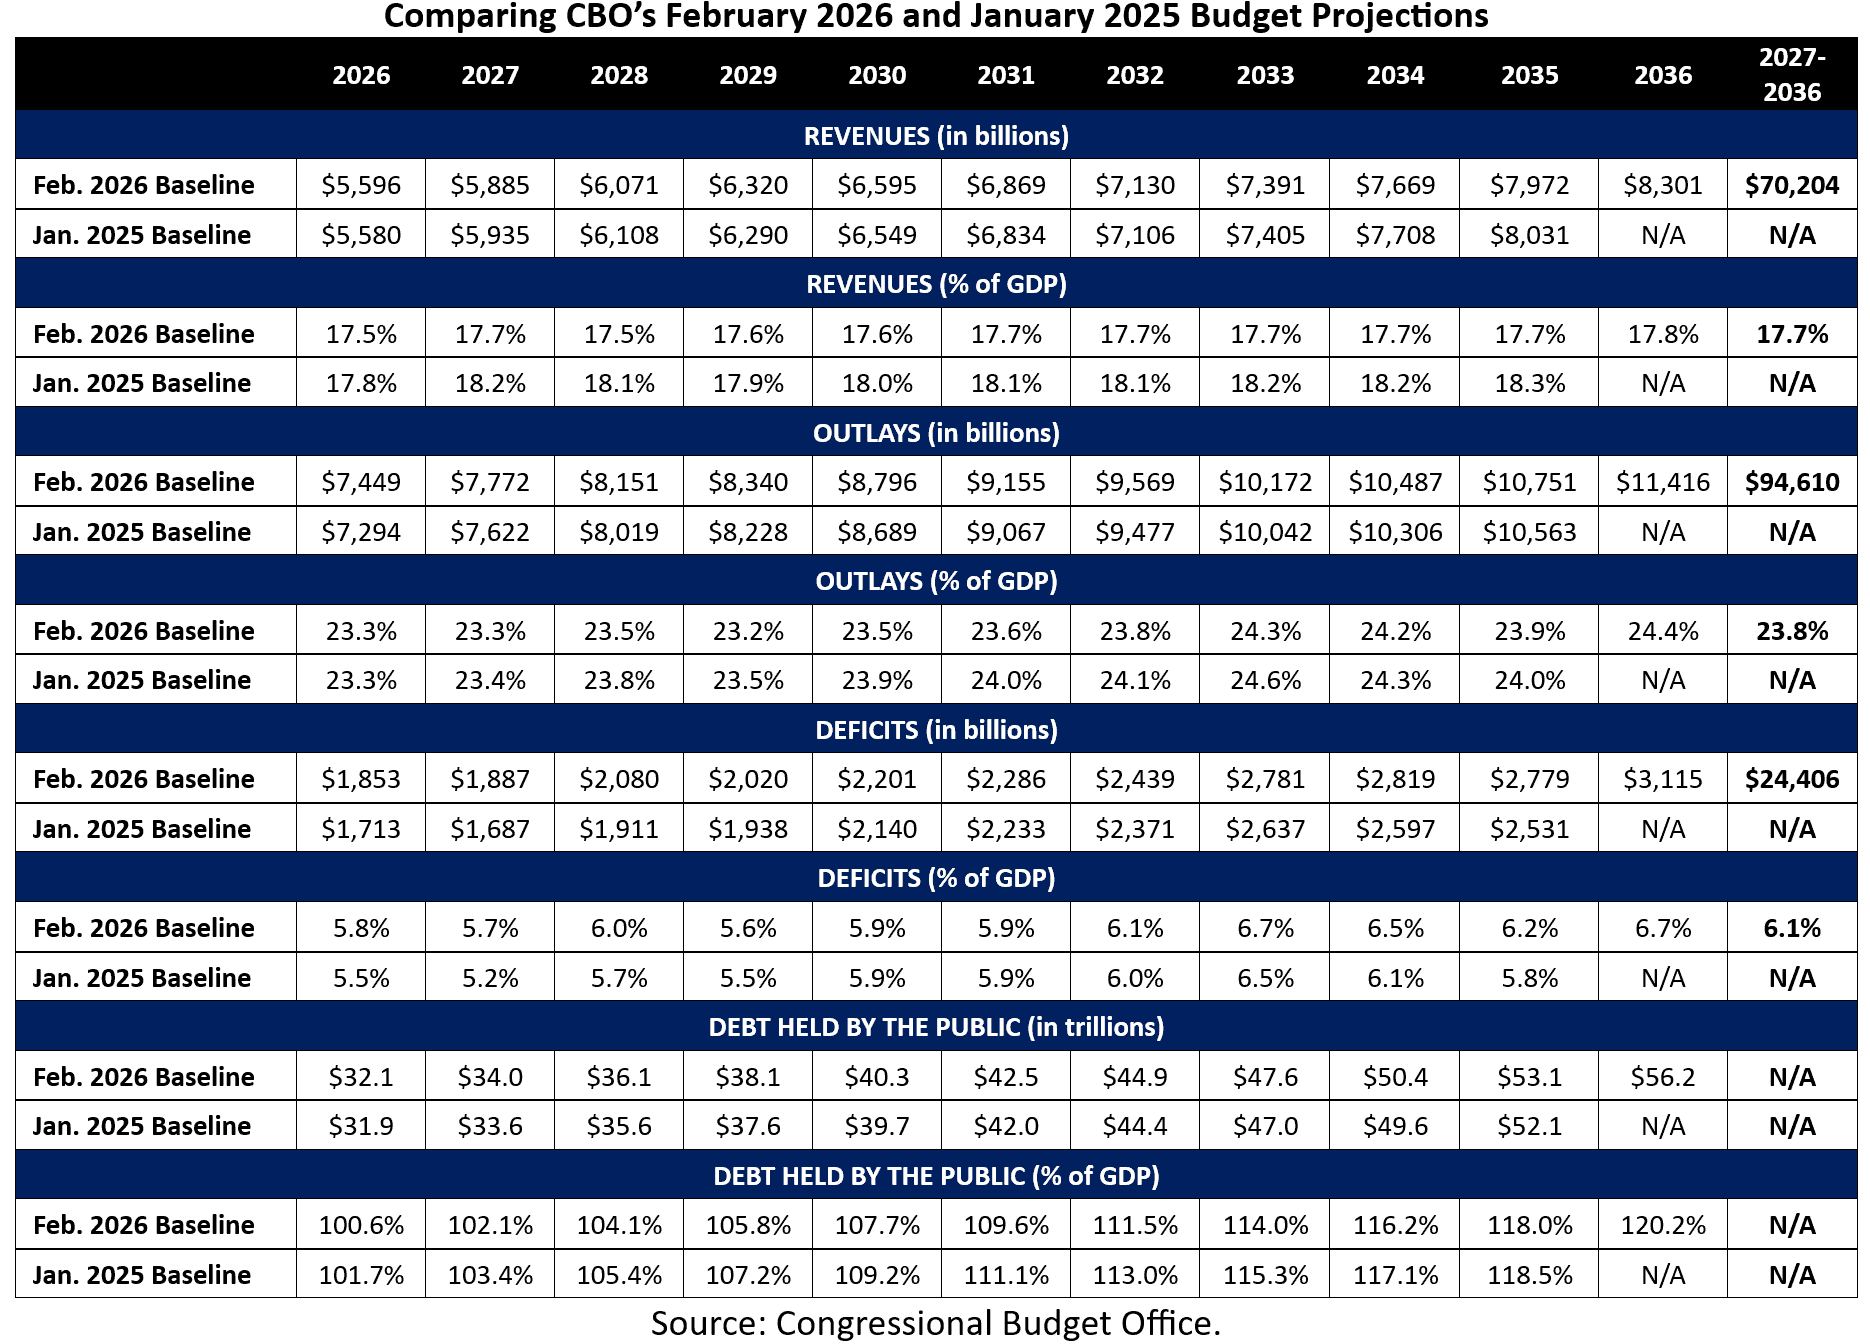
CBO projects that total federal revenue collections will rise from 17.5 percent of GDP ($5.6 trillion) in FY 2026 to 17.8 percent of GDP ($8.3 trillion) by FY 2036. For comparison, the 50-year historical average for revenue is 17.3 percent of GDP. Over the FY 2027 to FY 2036 period, revenue will total 17.7 percent of GDP ($70.2 trillion). Specifically, individual income tax revenue will total 8.9 percent of GDP ($35.5 trillion), payroll tax revenue will total 5.7 percent of GDP ($22.7 trillion), corporate tax revenue will total 1.3 percent of GDP ($5.0 trillion), and other revenue collections (including excise taxes and customs duties) will total 1.8 percent of GDP ($7.0 trillion).
Spending
CBO estimates that total federal spending will rise from 23.3 percent of GDP ($7.4 trillion) in FY 2026 to 24.4 percent of GDP ($11.4 trillion) by FY 2036. For comparison, the 50-year historical average for spending is 21.2 percent of GDP. Over the FY 2027 to FY 2036 period, spending will total 23.8 percent of GDP ($94.6 trillion). Entitlement, or mandatory, spending will total 14.6 percent of GDP ($57.9 trillion), or 61 percent of all federal spending. Discretionary (defense and nondefense) spending, meanwhile, will total 5.2 percent of GDP ($20.5 trillion), or 22 percent of all federal spending.
Deficits
CBO projects that the United States will run a unified federal budget deficit of $1.9 trillion in FY 2026, or 5.8 percent of GDP (in January 2025, CBO projected the FY 2026 deficit would total $1.9 trillion, or 6.2 percent of GDP). This follows the $1.8 trillion (5.8 percent of GDP) deficit recorded in FY 2025 and the $1.8 trillion (6.4 percent of GDP) deficit recorded in FY 2024. CBO expects deficits to total $24.4 trillion (6.1 percent of GDP) over the FY 2027 to FY 2036 period, eclipsing $2 trillion by FY 2028 and ultimately growing to $3.1 trillion (6.7 percent of GDP) by FY 2036.
Interest Payments
Interest payments on the national debt will more than double, rising from $1.0 trillion in FY 2026 to $2.1 trillion by FY 2036. Interest payments are projected to increase by 35 percent as a share of federal outlays, rising from about 14 percent of total federal spending in FY 2026 to nearly 19 percent of federal spending by FY 2036. And at a projected cost of $1.0 trillion in FY 2026, interest payments are projected to surpass the $885 billion the federal government is projected to spend on national defense and the $708 billion it is projected to spend on Medicaid. As a share of the economy, interest will grow from 3.3 percent of GDP in FY 2026 to 4.6 percent of GDP by FY 2036.
Debt Held by the Public
Borrowing from the public is projected to increase as a share of the economy under current law, reaching 120.2 percent of GDP by the end of FY 2036. In FY 2030, debt is expected to reach its highest level as a share of GDP – 107.7 percent – in U.S. history, surpassing the 106.1 percent of GDP from 1946 following the end of World War II (in January, CBO projected debt-to-GDP would surpass the prior record a year earlier, in FY 2029). In nominal dollars, debt held by the public will increase by $25.2 trillion, from $21.0 trillion today to $56.2 trillion by the end of FY 2036.
The Economic Outlook by the Numbers
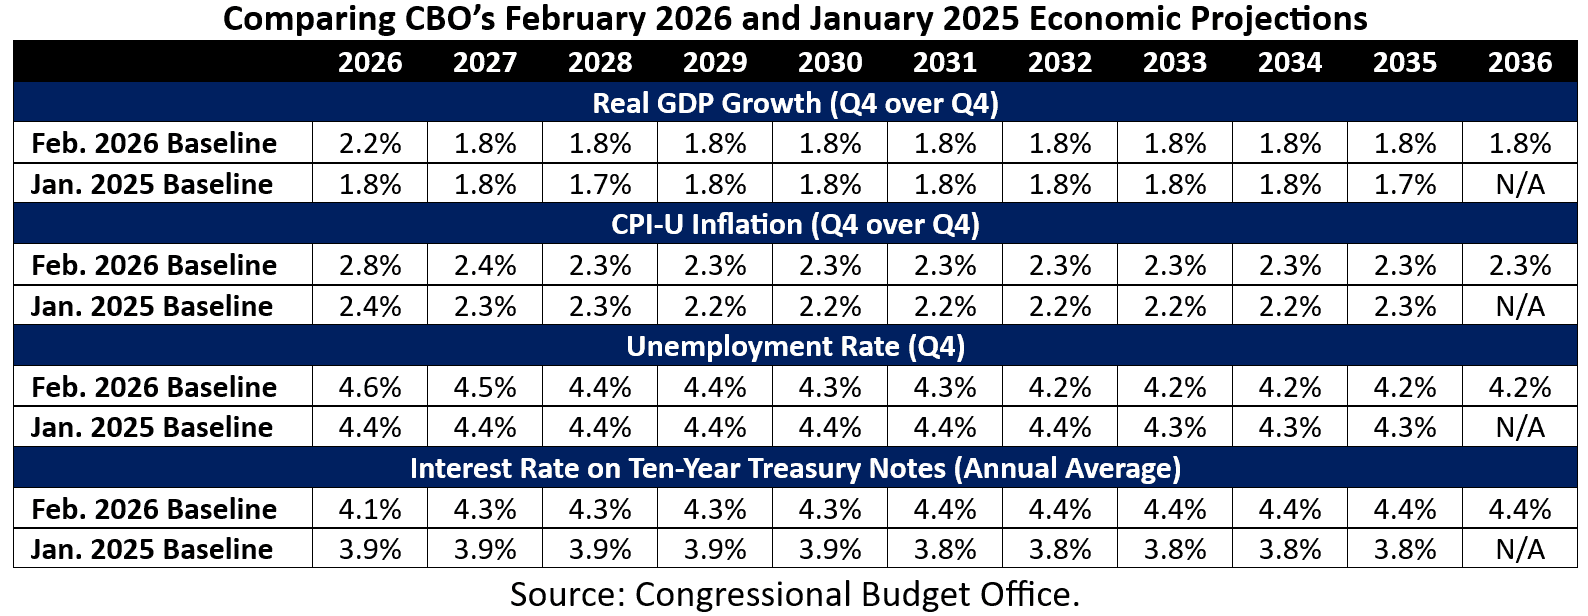
CBO expects real GDP growth, on a fourth-quarter over fourth-quarter basis to increase from 1.9 percent in 2025 to 2.2 percent in 2026 as the OBBB’s boost to consumption, private investment, and federal purchases materialize. CBO notes that higher tariffs and changes in immigration partially offset its forecast of real GDP growth in 2026. CBO expects real GDP growth to slow to 1.8 percent in 2027 and remain at that level through 2036 as the OBBB’s impact on aggregate demand wanes, net immigration falls, slower productivity growth due to higher tariffs, and a crowding out of private investment as debt and deficits continue to rise.
CBO expects Consumer Price Index (CPI) inflation, on a fourth-quarter over fourth-quarter basis, to total 2.8 percent this year. CPI inflation will continue to soften to 2.4 percent in 2027 and to 2.3 percent in 2028 and beyond. As inflation cools, CBO expects the unemployment rate to tick up from 4.3 percent today to 4.6 percent by the end of 2026. From there, the unemployment rate will gradually decline to 4.5 percent by the end of 2027, to 4.4 percent in 2028 and 2029, and to 4.3 percent in 2030 and 2031. The unemployment rate will stabilize at 4.2 thereafter. CBO notes that employment will grow more slowly over the next decade due to reduced immigration and an aging population.
CBO forecasts that the average interest rate on 10-year Treasury notes will total 4.1 percent this year, increase to 4.3 percent in 2027 and remain there through 2030, and then increase further to 4.4 percent in 2031 and beyond. CBO assumes that the Federal Reserve will continue cutting interest rates through the end of 2026.