


Insight
March 11, 2024
Highlights of the FY2025 President’s Budget
Executive Summary
- The Fiscal Year 2025 President’s Budget proposes collecting $4.9 trillion in higher taxes, $1.6 trillion in new spending, and running the debt up to levels not seen since World War II.
- The President’s Budget proposes policies that would push debt-service costs higher than the budgets of every federal agency – this year.
- Compared to the Congressional Budget Office’s (CBO) baseline, the Office of Management and Budget baseline that underpins the President’s Budget conveniently assumes a combined $5 trillion in higher tax receipts and higher spending.
- The President’s Budget assumes stronger economic growth, lower unemployment, and lower interest rates compared to CBO.
By the Numbers
Taxes: The President’s Budget includes substantially increased tax revenue, both as a function of assumed higher revenue and through proposed tax increases. The Office of Management and Budget (OMB) estimates that the President’s Budget proposes $4.9 trillion in higher tax collections relative to OMB’s baseline. Importantly, compared to the Congressional Budget Office (CBO), OMB assumes nearly $2.8 trillion in additional baseline revenues. Accordingly, the President’s Budget proposes nearly $7.7 trillion in higher taxes compared to CBO’s baseline.
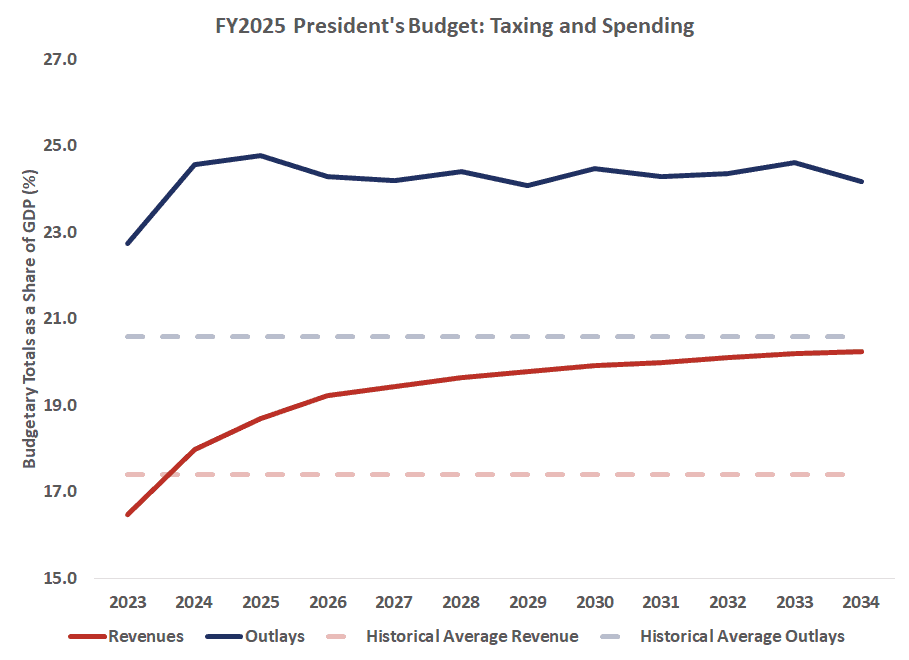
Revenues in the President’s Budget are projected to increase as a share of gross domestic product (GDP), from 18.0 percent – healthily above the 60-year average of 17.4 percent – to 20.3 percent of GDP. Over 10 years, the budget proposes an average level of taxation of 19.7 percent, higher than any 10-year period in the history of the modern U.S. tax system.
Spending: By the end of the budget window, the President’s Budget would increase spending by nearly $1.7 trillion compared to OMB’s baseline. Again, OMB assumes a higher level of spending in its baseline than does CBO. Compared to CBO, OMB assumes over $2.2 trillion in higher spending in its baseline. As a share of GDP, spending would reach 24.4 percent of GDP, nearly 4 percentage points higher than the 60-year average, by 2033. Over the next decade, spending would average 24.8 percent of GDP.
Deficits: The President’s Budget assumes projected deficits totaling $16.3 trillion over the next decade. OMB estimates the deficit will reach $1.9 trillion this year and average $1.6 trillion. Compared to the 60-year historical average, the President’s Budget proposes running an average deficit over the next decade that is 1.3 percentage points higher than the U.S. historical average.
Interest Payments: Interest payments on the debt will reach $1.5 trillion in 2034. This reflects a more-than-doubling of debt service costs from $658 billion in 2023. Under this budget, debt service costs would exceed all federal agency budgets, including the Department of Defense, this year. By the end of the decade, 14 cents out of every federal dollar spent would be on interest costs.
Debt Held by the Public: Borrowing from the public would increase as a share of the economy under the President’s Budget, rising from 97.3 percent of GDP in fiscal year (FY) 2023 to 105.6 percent of GDP in FY2034. Only in 1946 did the debt exceed this level, and no period in American history has seen debt sustained at this level.
Economic Projections
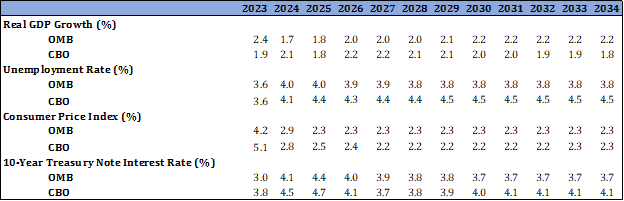
The President’s Budget includes more optimistic economic projections on average than does CBO’s latest projection in terms of real GDP growth, unemployment, and interest rates. Under the President’s Budget, real GDP is assumed to grow slightly faster than estimated by CBO, particularly over the longer term, while OMB assumes, on average, 0.6 percent lower unemployment and 0.2 percent lower interest rates on the 10-year note. OMB’s and CBO’s forecasts for inflation are, on average, the same over the budget window, but differ in pattern. These effects combine to increase tax revenues and reduce debt service, which can explain some of the more favorable assumptions in OMB’s baseline compared to CBO’s.
