Insight
October 26, 2023
Pandemic Lockdowns and Obesity Rates: A Case Study of Florida and California
Executive Summary
- California and Florida took very different approaches to pandemic closure policy, as measured by the Oxford Covid-19 Government Response Tracker’s stringency index score – which measures the robustness of governments’ responses to the COVID-19 pandemic – with California averaging a more stringent 55.77 in 2020 while Florida averaged a 44.24 that year.
- In 2020, California had a historically high increase in its obesity rate of 15.3 percent, while Florida experienced a more modest 5.2 percent increase after fully opening most businesses by October 2020; in 2021, when California allowed businesses and activities to resume more broadly and averaged a stringency index score of 43.17, it saw an 8.7 percent decrease in its obesity rate.
- While Florida and California’s disparate outcomes in resident health do not suggest that specific facility closures alone are responsible for changes in the overweight and obese population, policymakers should consider such information to ensure policies intended to protect public health do not inadvertently harm it.
Introduction
At the start of the COVID-19 pandemic, states across the country introduced broad restrictions on personal activity, shuttering businesses and public gathering areas in an attempt to stem the spread of the virus. Initially, most states took broadly similar measures, but as the pandemic dragged on, states began taking different approaches to openings and closings. Some states decided to maintain heavy, general lockdowns – meaning broad business closures, banned or limited public gatherings, and closed schools, for long periods of time – while other states took targeted approaches, only closing specific businesses, allowing flexibility with public gatherings, and implementing hybrid in-person and distanced learning that lasted for shorter periods of time. Perhaps the two states with large populations that best symbolized those different approaches were California and Florida, with California favoring a more heavy-handed approach to closures and Florida preferring a lighter touch. This insight is a case study comparing the effects of those two different approaches in those two states, as measured by the stringency index of the Oxford Covid-19 Government Response Tracker (OxCGRT), and the potential correlation with obesity and other health measures in the states’ populations.
Background
This case study measures California’s and Florida’s government responses using state-level data obtained from the OxCGRT, which was developed by the Blavatnik School of Government at the University of Oxford.[1] The OxCGRT measured the differences in government responses both in the United States and globally, with the intent of understanding the variance in government measures as well as their impacts. This case study focuses specifically on the OxCGRT’s “stringency index,” which measures and records “the strictness of ‘lockdown-style’ closure and containment policies that primarily restrict people’s behavior.”[2] In 2020, California averaged an OxCGRT stringency index score of 55.77 (out of 100), while Florida averaged a score of 44.24. In 2021, California averaged a stringency index score of 43.17, while Florida averaged a score of 18.51. Stringency index score data was taken from January 31, 2020 (when the U.S. government declared a public health emergency), through December 31, 2021, the last year for which health outcomes data was available.
To measure health effects, this case study uses data from the Behavioral Risk Factor Surveillance System (BRFSS), a project by the Centers for Disease Control and Prevention to measure a variety of health impacts.[3] The BRFSS uses telephone surveys to collect from residents in all 50 states, the District of Columbia, and three U.S. territories, with more than 400,000 adults interviewed every year. This case study focuses on three health measures in the BRFSS: percentage of adults with obesity, percentage of adults who are overweight, and percentage of adults who are sedentary (meaning they did not engage in any physical activities in the past month when surveyed). Obesity was chosen as the main focus of the paper, given its known impacts on general physical health, while the other two were chosen due to their association with obesity.[4] To establish general patterns for each state, each health measure was examined from 2015–2021, the last year of available data for both states.
The timing of lockdown policies and the types of lockdowns in place are worth mentioning for each state. California Governor Gavin Newsom issued lockdown orders on March 24, 2020, closing a wide variety of businesses, including indoor gyms and restaurants, for months. These orders were not lifted until January 25, 2021, though restrictions still remained in certain regions of California that strictly limited gym and restaurant capacity until specific metrics were met. Similarly, Florida Governor Ron DeSantis imposed lockdown orders on March 20, 2020, also closing a wide variety of businesses including gyms and restaurants. On May 18, 2020, however, Governor DeSantis issued an executive order allowing restaurants, retail establishments, indoor gyms, and museums and libraries to reopen at 50 percent capacity, with full capacity for these establishments restored before October 2020.
Findings
Obesity Rates
As demonstrated in Figure 1 below, year-to-year changes in obesity rates (defined as individuals with a body mass index, or BMI, of 30 or greater) dramatically increased for California (15.3 percent from 2019–2020), while Florida only saw modest growth (5.2 percent increase from 2019–2020). From 2015–2019, California averaged a 2.0 percent increase year-to-year, while Florida averaged a 0.5 percent increase year-to-year in the same period. California’s obesity rate went from 26.2 percent in 2019 to 30.2 percent in 2020, while Florida’s went from 28.4 percent to 30.0 percent. Of note, in 2021, California’s obesity rate decreased by 8.6 percent to a total of 27.6 percent, while Florida’s grew again by 5.6 percent to a total of 30.0 percent.
Figure 1.

Source: BRFSS Prevalence & Trends Data
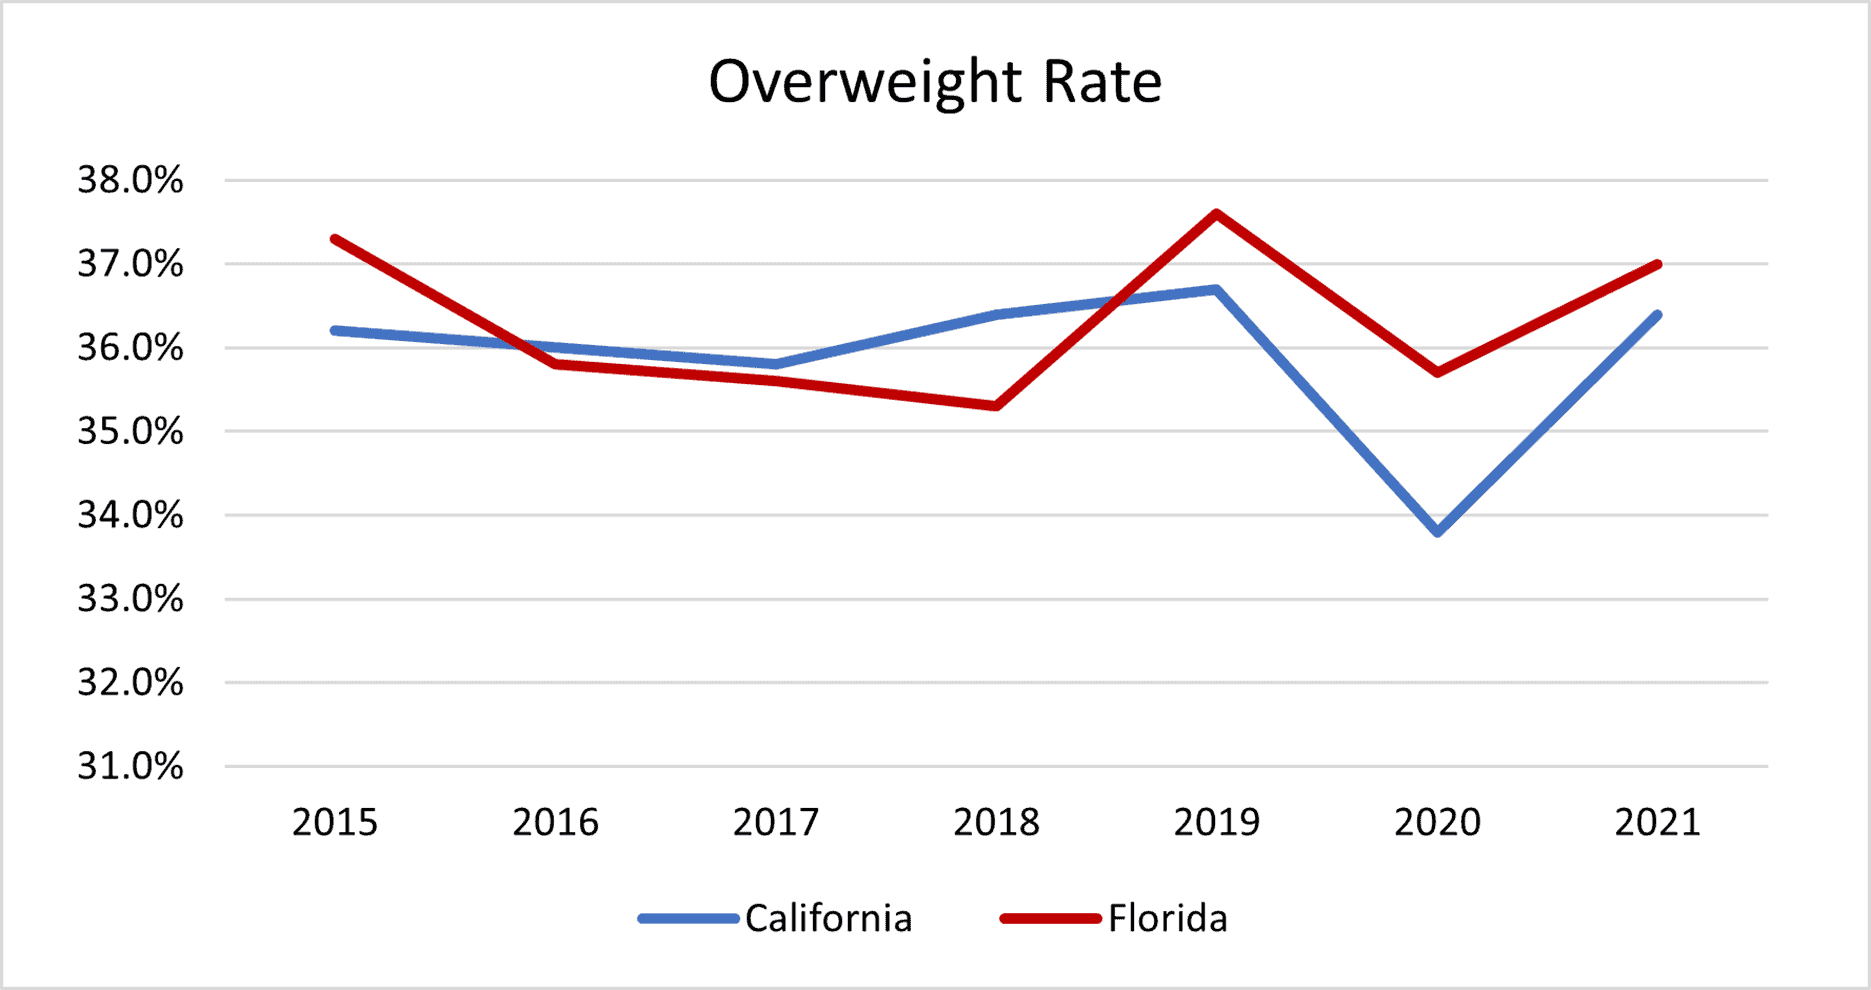
Overweight Rate
As Figure 2 below shows, California and Florida had similar average year-to-year increases in the number of people who were overweight (defined as a BMI of 25–29.9) from 2015–2019, both at 0.3 percent. From 2019–2020, California saw a 7.9 percent decrease in the number of people who were overweight, while Florida saw a 5.1 percent decrease. From 2020–2021, both states saw increases in the percentage of people who were overweight, with California’s percentage growing by 7.7 percent and Florida’s growing by 3.6 percent. From 2019–2020, California went from a 36.7 percent overweight rate to 33.8 percent overweight rate, while Florida went from a 37.6 percent rate to a 35.7 percent rate. In 2021, California had a 36.4 percent overweight rate, while Florida had a 37 percent rate.
Figure 2.
Source: BRFSS Prevalence & Trends Data
Sedentary Rate
The sedentary rate, as demonstrated in Figure 3, is interesting because despite California’s increase in obesity, the state experienced a 5.4 percent decrease in its sedentary rate from 2019–2020, from 22.4–21.2 percent, while Florida saw a 1.1 percent increase in its sedentary rate, from 26.5–26.8 percent. California’s 2015–2019 average growth in the sedentary rate was 2.9 percent, while Florida’s was 0.6 percent. In 2021, California experienced a decrease of 5.2 percent in its sedentary rate, while Florida experienced a 2.2 percent decrease.
Figure 3
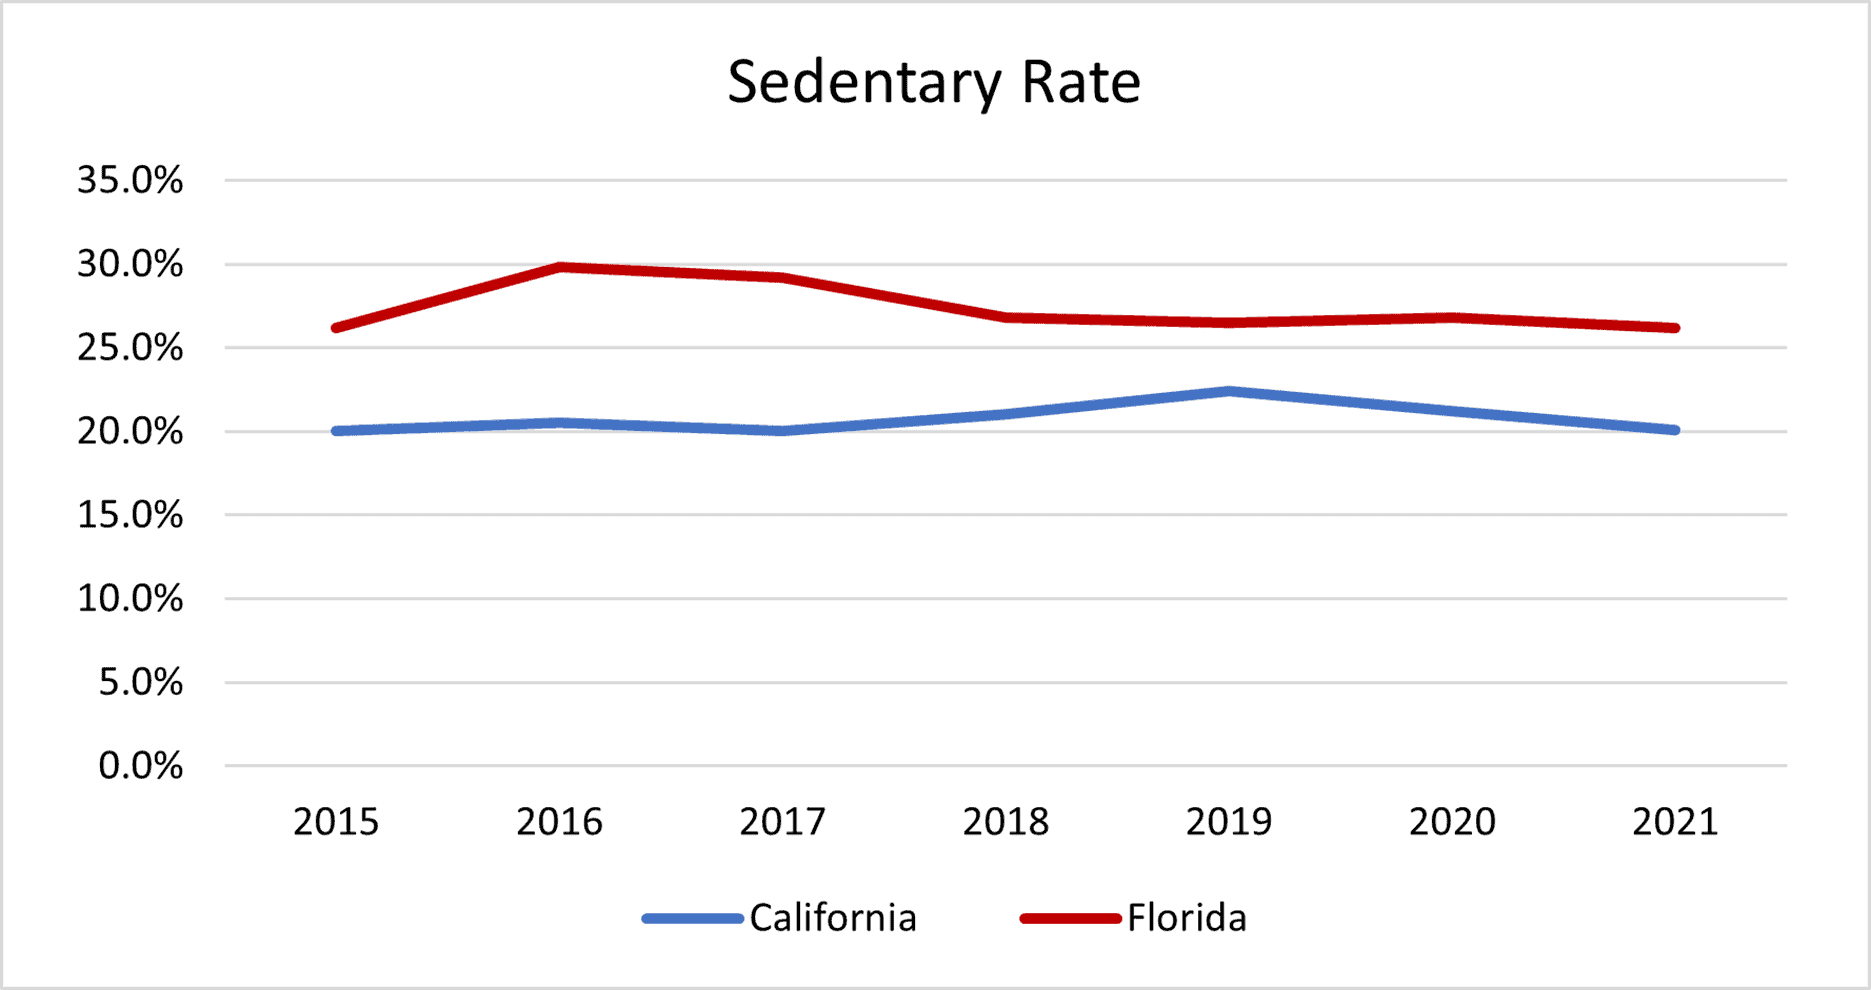
Source: BRFSS Prevalence & Trends Data
Discussion
Overall, these findings demonstrate a relationship in the stringency index score for Florida and California and their respective increases in obesity. It should be mentioned that the yearly average stringency index score does not give the full picture of a state’s lockdown. If we began from when California and Florida issued lockdown orders, rather than when the U.S. government declared a public health emergency in January 2020, we would see that when California began its lockdowns on March 24, 2020, the state had a stringency score of 76.85, while Florida had a similarly high score of 68.98. By September 2020, however, Florida’s stringency score had dropped below 50 and would end 2020 with a score of 33.80. Over that time, Florida only saw its obesity rate increase by 5.2 percent, while California saw an increase of 15.3 percent. Meanwhile, California ended 2020 with a score of 63.43 and wouldn’t drop below 50 until June 15, 2021.
Notably, Florida’s obesity rate dropped 12.1 percent in 2019. It is unclear what caused this significant drop, preceded the year before by an 8.1 percent increase. It is possible that the significant increase in the sedentary rate in 2016, followed by a return to the lower 2015 sedentary rate in 2018, may have contributed to 2018–2019 swings in Florida’s obesity rate. Regardless, the 2011–2019 average year-to-year change in obesity rates was 0.4 percent, similar to the state’s 2015–2019 rate of 0.5 percent, indicating that 2018–2019 may have been anomaly years for Florida. Without the outlier 2018–2019 years, Florida’s average year-to-year growth from 2011–2017 would be 1.0 percent. California’s 2011–2019 average year-to-year change in the obesity rate was 1.2 percent, almost half its 2.0 percent for 2015–2019, indicating an increasing growth rate in obesity, but the state had no anomalies similar to Florida, and never experienced a change greater than 5.0 percent between 2011–2019.
As mentioned above, it is notable how restaurants, retail stores, and gyms, were re-opened sooner in Florida than California and it is likely that this increased the public’s ability to be active (albeit not necessarily exercising, as the sedentary rates indicate) seems to have provided a means to mitigate increases in the obesity rate. California’s significant increase in obesity despite its 5.4 percent drop in sedentary rates is possibly explained by the reasoning that whatever exercise the population was partaking in was not intense or frequent enough to counteract the overall decline in general activity that would accompany going to work or socializing outside of the home. To this point, when California allowed for more businesses and activities to reopen and resume in 2021, the state saw a significant decrease in its obesity rate of 8.6 percent coupled with a further 5.2 percent decrease in its sedentary rate. Florida’s obesity rate increased again by 5.6 percent in 2021, but by then almost all businesses, including gyms and other fitness activities, had been open at full capacity since October of 2020, indicating diminishing returns in reducing the OxCGRT stringency score past a certain point.
As for the declines in the changes in the overweight rate, specifically with regards to 2020, it is interesting to note that Florida’s decrease in its overweight rates nearly matches its increase in obesity rates, suggesting that those who were already overweight may have become obese during 2020. Similarly, it is conceivable that the overweight population in California made a similar transition, but given the stricter and longer lockdowns, even individuals who weren’t previously overweight may have become obese during that period. More research is needed in other states to confirm these hypotheses, as well as to examine the potential correlation between lockdown intensities and changes in year-to-year obesity rates.
Conclusion
California and Florida took very different approaches to COVID-19 closures in 2020 and ended up with very different obesity rate trajectories. California’s significantly stricter and longer lockdowns coincided with the highest increase in obesity in almost a decade of 15.3 percent, three times higher than its previous highest increase in 2011. Meanwhile, Florida’s 5.2 percent increase in obesity, while higher than its historical average, was still significantly lower than California’s and not out of line from past increases. It is difficult to remove Florida’s shorter lockdowns from this equation, as they allowed for continued activity, both in the form of exercise at gyms as well as daily activity outside of the home at work and social gatherings. No doubt the policy response to the pandemic had far-reaching economic, educational, and broad societal impacts, so it would be presumptuous to claim that specific facility closures alone are directly responsible for changes in the overweight and obese population. But observations such as those highlighted in this case study should give policymakers pause in future epidemics, so that government heavy-handedness doesn’t unwittingly encourage populations to be less healthy in the name of protecting public health.
[1] COVID-19 Government Response Tracker – U.S. Data. Blavatnik School of Government, the University of Oxford. https://github.com/OxCGRT/USA-covid-policy/blob/a8a81e09c1ce8743c868bf6e5ef60ecba7da3392/data/OxCGRT_US_latest.csv
[2] Laura Hallas, et al. Variation in US states’ responses to COVID-19. Blavatnik School of Government, the University of Oxford. December, 2020. https://www.bsg.ox.ac.uk/sites/default/files/2020-12/BSG-WP-2020-034-v2_0.pdf
[3] BRFSS Prevalence & Trends Data. Centers for Disease Control and Prevention. https://nccd.cdc.gov/BRFSSPrevalence/rdPage.aspx?rdReport=DPH_BRFSS.ExploreByLocation&rdProcessAction=&SaveFileGenerated=1&irbLocationType=States&islLocation=06&islState=&islCounty=&islClass=CLASS10&hidLocationType=States&hidLocation=12&hidClass=CLASS15&hidTopic=TOPIC23&hidTopicName=Exercise&hidYear=2015&irbShowFootnotes=Show&rdICL-iclIndicators=_TOTINDA&iclIndicators_rdExpandedCollapsedHistory=&iclIndicators=_TOTINDA&hidPreviouslySelectedIndicators=&DashboardColumnCount=2&rdShowElementHistory=&rdScrollX=0&rdScrollY=467&rdRnd=76118
[4] Lim, Yizhe and Boster, Joshua. Obesity and Comorbid Conditions. National Cener for Biotechnology Information, National Library of Medicine. February 8, 2023 https://www.ncbi.nlm.nih.gov/books/NBK574535/