Research
May 11, 2017
FCC Data Suggests Broadband Inequality Has Decreased
Executive Summary
The Federal Communications Commission (FCC) collects and disseminates a number of important data regarding broadband usage. Unfortunately, while it produces authoritative work on year-by-year snapshots, there is a paucity of time series data. However, by connecting data from 2014 and 2015, AAF created a two year time series of real broadband consumers, totaling 2,600 households from across the United States. Here is what we found:
- Between 2014 and 2015, 885 households, 34 percent of the total, experienced speed changes.
- Within this group of households that saw service changes, 104 households downgraded their broadband.
- The households that downgraded from 2014 to 2015 subscribed to broadband service that was nearly 10 Mbps faster than all other households in 2014.
- Conversely, the households that upgraded in 2015 subscribed to slower service, on average, as compared to all other households in 2014.
- From 2014 to 2015, the median service speed has increased faster than the mean service speed, suggesting that the broadband market is evening out.
- Similarly, the dispersion of broadband service decreased from 0.47 to 0.44 between 2014 and 2015 using the Gini coefficient measurement.
- Over this time period, 107 people changed their ISP, moving away from DSL and into cable, fiber, and AT&T’s U-Verse.
Why are these findings significant?
There is a persistent belief, retold in articles without much data, that broadband service is getting more unequal, that private markets aren’t the best way to provide service, and that some people are being left behind. Yet, the analysis assembled here supports an opposite conclusion. Broadband inequality has decreased, a third of consumers saw speed changes, and households seem to be choosing the level of service that best suits them.
Full Analysis
The analysis is built upon official FCC panel data. According to the agency, the sample was organized to cover every major Internet Service Provider (ISP) in the 48 contiguous states across the major broadband technologies. To help ensure geographic diversity, the panel had regional targets to compensate for the variations in broadband networks across the United States. The FCC has extensive documentation on this panel data, located in the technical appendix of the most recent “Measuring Broadband America 2016” report. To create the time series data, the data from the 2016 report was connected with data from the 2015 report, and only households that appeared in both were selected for analysis. The total sample includes 2600 households and closely reflects the regional variation in the original data.
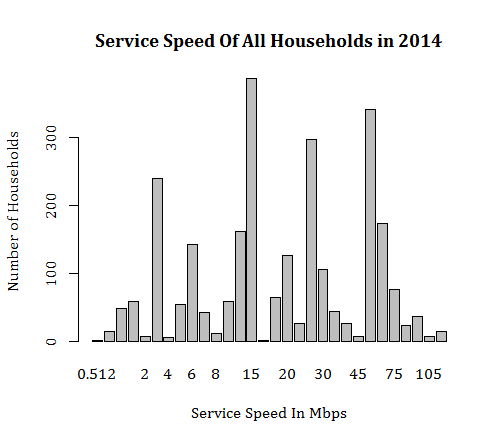
The chart below shows the service level of all households in 2014. As you can see, households seem to congregate around the 3 Mbps, 15 Mbps, 25 Mbps, and 50 Mbps service levels.
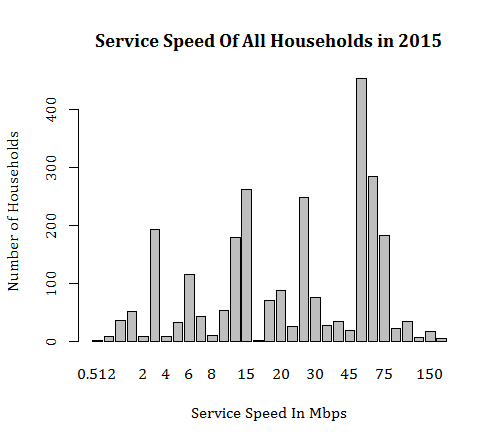
Between 2014 and 2015, consumption of broadband saw marked changes as people began to consume the service at higher levels. While local peaks still existed at the 3 Mbps, 15 Mbps, and 25 Mbps speeds, consumers moved into service levels around 50 to 75 Mbps, as shown in the chart below. From 2014 to 2015, the median service level shifted upward from 20 Mbps to 25 Mbps, while the average increased at a slower pace from 27 Mbps to 34 Mbps. One measure used to track statistical dispersion is the Gini coefficient. You often hear this measurement used to describe income inequality. When applied to the data, the dispersion of broadband service was found to decrease from 0.47 to 0.44 in 2014 to 2015 Effectively then, broadband inequality decreased in this time period.
Most of the upward shift in broadband speeds came from consumers moving upwards to faster service within the same company. Yet, 107 households did change their ISP from 2014 to 2015, as consumers shuffled away from DSL, into cable, fiber, and AT&T’s U-Verse. On average, those that changed their ISP had the effect of increasing broadband speed by about 14 Mbps. Below is a breakdown of the technology these households consumed for both of the time periods.
| Technology | Total Households | Percent of Total |
|
Households in 2014 |
||
| Cable | 1300 | 50.0% |
| DSL | 869 | 33.4% |
| Fiber | 390 | 15.0% |
| Satellite | 41 | 1.6% |
| Households in 2015 | ||
| Cable | 1321 | 50.8% |
| DSL | 633 | 24.4% |
| Fiber | 405 | 15.6% |
| Satellite | 42 | 1.6% |
| U-Verse | 199 | 7.7% |
Of the 2,600 households tracked in this analysis, 885 experienced some kind of service change. Speed increases occurred in 781 households, while 104 households saw service downgrades. Never before have these households been the focus of research.
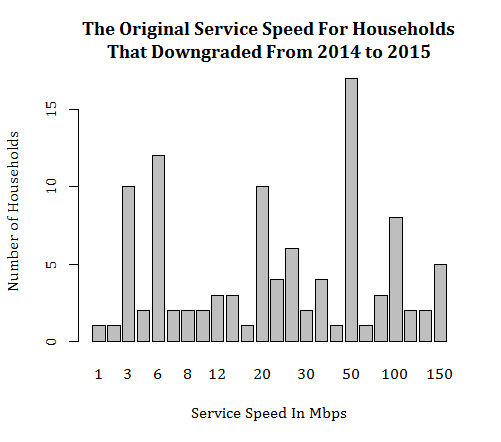
What sets apart the households that downgrade? For one, they consumed faster broadband speeds in 2014. The median download speed for households that decreased their speed was 24 Mbps in 2014, compared to all other households which subscribed to 20 Mbps. Similarly, the average speed for the downgrade group was about 10 Mbps faster than those that didn’t downgrade. In other words, the downgrade group tended to skew towards the higher end, as compared to those that didn’t see a change in their broadband speeds, as seen in the chart below. After downgrading, this group ranked below both the median, at 13.5 Mbps, and the mean, at 21.6 Mbps, compared to the 2015 baseline.
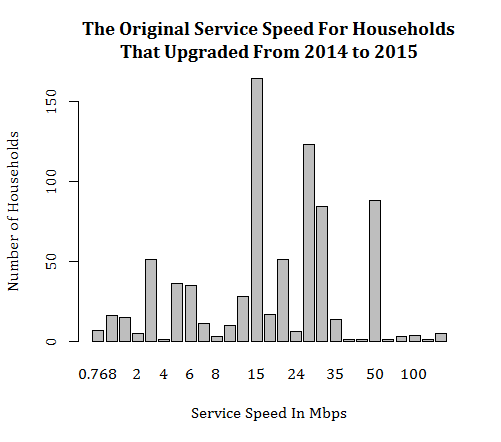
On the other hand, those households that experienced an upgrade from 2014 to 2015 began with slower speeds in 2014. For this group, the median speed was 18 Mbps as compared to the baseline of 20 Mbps, and the average speed where upgraders began was 21 Mbps. As seen below, this group tended to skew towards the lower end before their shift in 2015 to faster service. And in 2015, this upgrade group was at a much higher level than the rest of the sample. The average speed for upgraders in 2015 was 45.3 Mbps with a median of 50 Mbps.
Conclusion
What broad narratives can be gleaned from these data?
For one, the broadband market is not stagnant as many regulatory advocates often suggest. In just one year, the average speed increased by 24 percent, while the median service level increased by 25 percent. Simultaneously, the Consumer Price Index (CPI) during this time period declined for Internet service by 2.5 percent. Since the CPI for Internet is not indexed to quality changes, speeds increased as prices declined.
Second, disparities in broadband are narrowing, so broadband inequality is decreasing. The median service speed for all consumers in 2015 rose quicker than the average service speed while the Gini coefficient declined. This trend alone should be cause for celebration.
Third, our research finds that the households that downgraded their service had faster service in 2014 on average, while those households that upgraded experienced slower broadband speeds. Yet, these actual changes contradict a belief within the broadband advocacy community claim that broadband is supply constrained. These infrastructure supply-siders argue that faster broadband always leads towards higher consumption because there is pent up demand. Yet, actual data firmly plants a more complex story. While the larger trend is towards higher broadband services, there is a sizeable portion of consumers that move both upwards and downwards in service offerings, likely to match their needs. Further analysis of this data in upcoming reports will help to tease out these trends.