Research
November 4, 2025
Housing (Un)Affordability Is the Price of Policy Not Market Concentration
Executive Summary
- President Donald Trump compared the country’s largest homebuilders to the Organisation of the Petroleum Exporting Countries cartel, accusing them of stockpiling land to restrict housing supply similar to how oil producers limit output to drive up prices.
- This research builds upon – and updates parts of – a 2022 study published by the Joint Center for Housing Studies of Harvard University that measured the market share of the top 100 largest home builders.
- This study finds that national tariff and immigration policies and local regulations are likely greater contributors to high home prices and increased market share among the largest firms than are firms with market power sitting on undeveloped lots.
Introduction
President Donald Trump compared the country’s largest homebuilders to the Organisation of the Petroleum Exporting Countries (OPEC) cartel, accusing them of stockpiling land to restrict housing supply similar to the oil producers limiting output to drive up prices.
This research builds upon – and updates parts of – a 2022 study published by the Joint Center for Housing Studies of Harvard University that measured the market share of the top 100 largest home builders.
This study finds that national tariff and immigration policies and local regulations are likely greater contributors to high home prices and increased market share among the largest home builders than are firms with market power hoarding undeveloped lots.
Industry Background and Home Building Headwinds
In a Truth Social post, President Trump compared the country’s largest homebuilders to the OPEC oil cartel. He wrote: “Before I became President, ‘OPEC’ kept Oil prices high,” adding that “It wasn’t right for them to do that but, in a different form, is being done again – This time by the Big Homebuilders of our Nation.” The president appears to be accusing large homebuilders exercising market power to artificially depress housing supply to maintain high home prices the way OPEC limits the production of oil.
OPEC – a group of 12 member countries – collectively produce about 35 percent of the world’s crude oil, and OPEC’s oil exports account for around 50 percent of all the oil traded internationally. Its success relies on controlling the combined supply of its member countries.
The latest available data from the 2022 Economic Census, however, showed the number of new single-family general contractor establishments reached 54,490, up 12 percent from 2017. Unlike OPEC, these data indicate that the industry is very fragmented.
The Economic Census data also showed, however, that the home building industry is continuing to rebuild after suffering a nearly 50-percent drop in the number of establishments – a single physical location where business is conducted or where services or industrial operations are performed – between 2007–2012 resulting from the financial crisis of 2008–2009. According to the Census Bureau’s Business Dynamic Statistics dataset, there were a combined 73,202 establishment deaths between 2008–2010 compared to just 66,394 establishment births of residential building construction firms (a broader category that includes single-family, multifamily, for-sale builders, and residential remodelers). While there has been a noticeable recovery, establishments were still 6.8 percent lower in 2022 than in 2002 (Figure 1). The number of operative-builders establishments – business primarily engaged in building new homes on land that is owned or controlled by the builder rather than the homebuyer or investor – has experienced a much more muted rebound as establishments were still 27.2 percent lower in 2022 compared to 2002.
Together, the total number of homebuilder establishments sank 13.1 percent between 2002–2022.
The number of single-family home completions plummeted 60 percent between 2007–2012. Even more than 15 years after the 2008–2009 financial crisis, the annual pace of home building has not fully recovered, down 16.1 percent between 2007–2022. As a result, the average number of single-family completions per homebuilder fell from 15.7 in 2002 to 13.9 in 2022.
The churn of firms entering and exiting the single-family homebuilding market points to healthy market dynamics. It is possible that the financial crisis, and later the COVID-19 pandemic, provided a necessary market correction to the ramp up in the number of establishments operating in the market. It could be that the market equilibrium consists of fewer establishments, and that other market forces and policy prescriptions are leading to higher home prices.
Figure 1. Number of Homebuilder Establishments Nationally
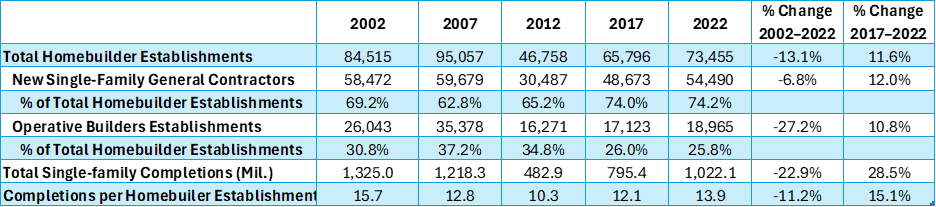
*Source: U.S. Census Bureau, Economic Census; author’s calculations; more recent data showed that single-family completions have fallen further to 1.016 million in 2024.
President Trump claimed that homebuilders were able to maintain high home prices by “sitting on 2 Million empty lots, A RECORD.” Survey data from the National Association of Home Builders (NAHB) and Wells Fargo, however, suggest that builders are struggling to find available lots on which to build. The survey found that “64% of single-family builders reported a shortage of lots, with 38% characterizing the supply as low and 26% saying it was very low.” While this was down from the most recent peak of 76 percent in 2021, it was higher than at any time between 1997 – when NAHB began tracking the number – and 2016.
The increased supply of homebuilders and the lack of available lots suggest other industry headwinds could be responsible for the slowdown in home construction. Recent changes to national tariff and immigration policies and local regulations offer an alternative – and perhaps more plausible – explanation for sustained high home prices. NAHB estimated that the tariffs proposed in April by the Trump Administration on building materials, appliances, and other products would add $10,900 to the cost of building a new home. Moreover, the administration’s crackdown on illegal immigration has contributed to widespread labor shortages in the home building sector. According to NAHB, longer construction times associated with the skilled-labor shortage have produced an annual economic impact of $10.8 billion. The group also found that the labor shortage “has led to a reduction of approximately 19,000 single-family homes not built in 2024, representing an economic loss of $8.143 billion,” and has extended construction times by “1.98 months, with smaller builders experiencing an even greater delay.”
Meanwhile, George Mason University economist Bryan Caplan explained that homebuilders are “constantly running into red tape,” noting that “layers of local zoning rules, discretionary approvals, and overlapping agencies with too much veto power” is the “real bottleneck” in home building. A 2021 NAHB study found that 23.8 percent of the cost of a home’s price was attributable to regulatory costs.
Industry Concentration
Data from Builder magazine’s BUILDER 100 surveys showed a surge in the share of single-family home sales by the nation’s top 100 builders from 49.3 percent in 2020 to 73.4 percent in 2024, which was nearly double the share in 2005 (Figure 2).
Figure 2. Top Homebuilders Share of Single-family Home Sales
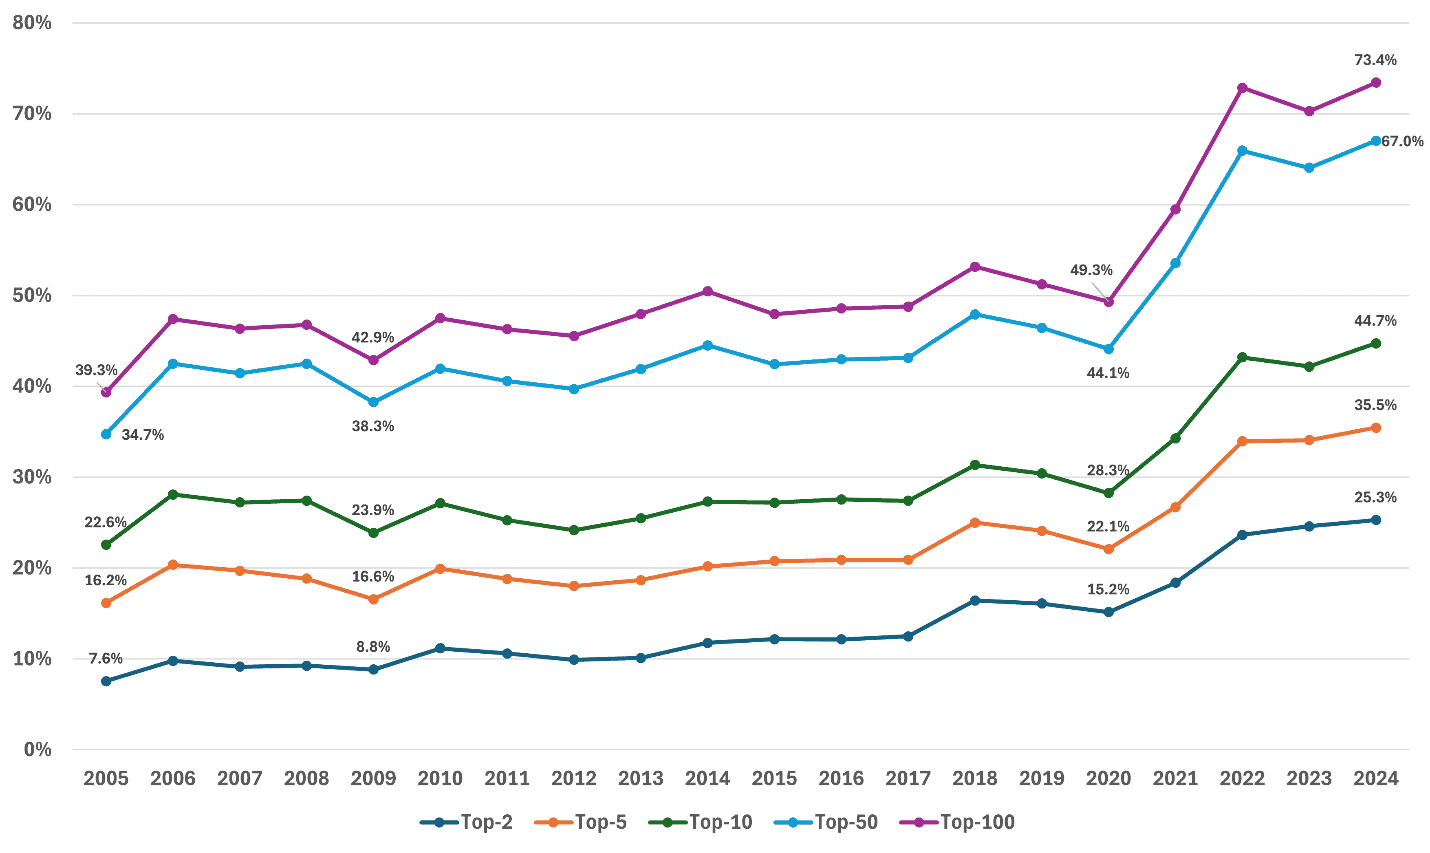
*Source: BUILDER 100 Surveys, U.S. Census Bureau; author’s calculations
The top two firms increased their market share from 15.2 percent to 25.3 percent between 2020–2024, accounting for 42 percent of the increase among top100 firms. According to the Harvard study, D.R. Horton and Lennar, the top two firms, grew their market share by 9 percentage points between 2002–2020, accounting for nearly two-thirds of the gains made by the top 100 builders, and accounting for all the share increases of the top 10 and top 5 builders.
Market concentration measured by the share of closings among the top five firms, however, suggests that the market remained unconcentrated, even with the large post-COVID spike. (Figure 3).
Figure 3. Share of Homes Closed in Top 50 Markets by the Top 10 Builders
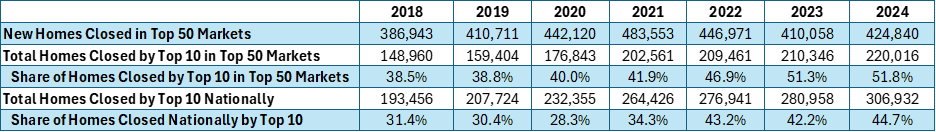
*Source: BUILDER 100 Surveys, U.S. Census Bureau; author’s calculations; companies included in the top 10 are based on the total number of homes closed by year.
The share of homes closed in the top 50 metro areas, however, has been relatively stable between 2018–2024 at just over 60 percent, apart from the steep decline in 2020 (53.8 percent) due to the COVID-19 pandemic and subsequent rebound in 2022 (69.7 percent).
Figure 4. New Homes Closed in Top 50 Metro Areas

*Source: BUILDER 100 Surveys, U.S. Census Bureau; author’s calculations
Nationally, the top two homebuilders, Lennar Corp. and D.R. Horton, accounted for just over 25 percent of the homes closed in 2024, up from a 16.4-percent share in 2018 (Figure 5).
Figure 5. Share of Homes Closed in Top 50 Metro Areas and Nationally by Top 2 Builders
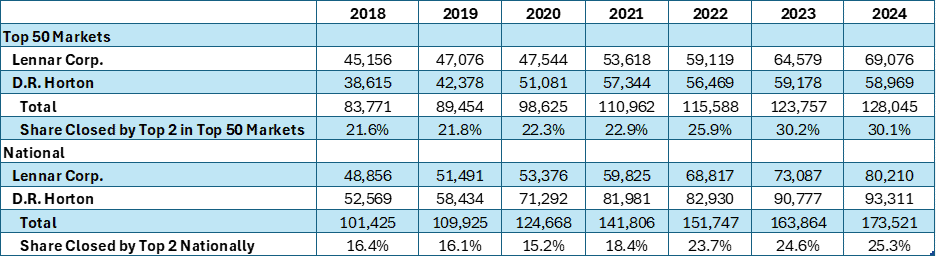
*Source: BUILDER 100 Surveys, U.S. Census Bureau; author’s calculations.
The market share of these two firms was even greater in the top 50 metro areas, reaching 30.1 percent in 2024.
Narrowing geography to the MSA level, however, is more indicative of competition as home building is almost exclusively done locally. In 2024, 25 companies were among the top two builders in each of the top 50 MSAs. Lennar and D.R. Horton led the count, making the top two, 33 and 28 times, respectively. NVR was third with six appearances (Figure 6).
Figure 6. Count of Top 10 Rank in Top 50 MSAs in 2024
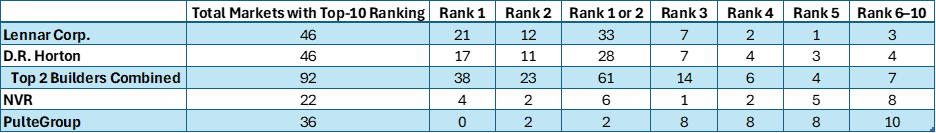
*Source: BUILDER 100 Surveys; author’s calculations
The firm with the greatest market share in each MSA ranged from 11.1 percent (D.R. Horton in Seattle-Tacoma-Bellevue, WA) to 41.9 percent (Lennar in Cape Coral-Fort Myers, FL). The average market share of the top firm in each MSA was 22.6 percent. The market share of the top two firms in each MSA ranged from 16.9 percent to 58.9 percent, averaging 36.5 percent. The difference in market share between the top two firms averaged 8.8-percentage points and ranged from 0.3-percentage points to 28.7-percentage points. The chart below shows the distribution of market share of the top two firms in the top 50 MSAs in 2024 (Figure 7).
Figure 7. Distribution of Market Share of Top 2 Firms in Top 50 MSAs in 2024
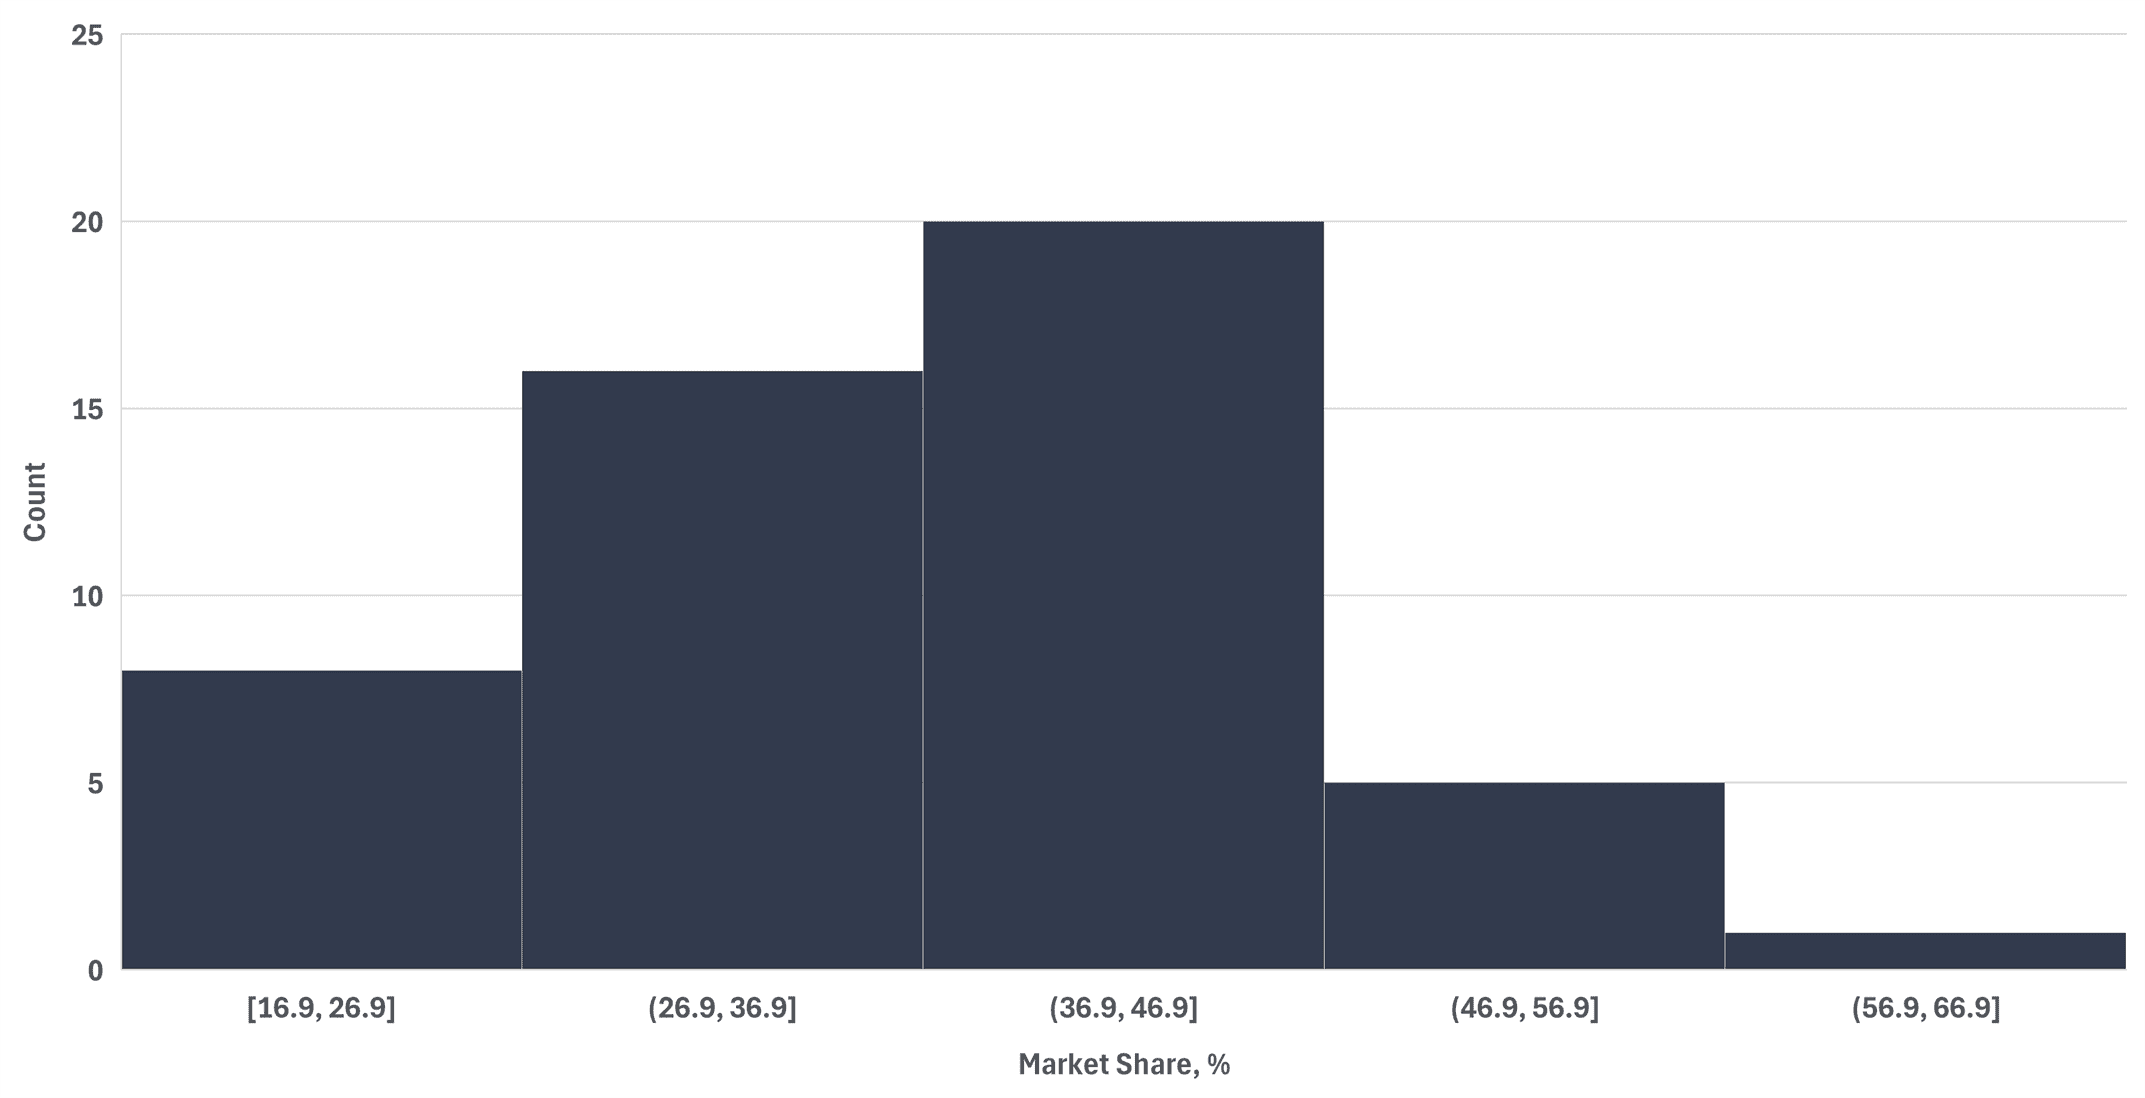
*Source: BUILDER 100 Surveys; author’s calculations
Expanding this metric to include the top five firms revealed an average market share at the MSA level of 60.3 percent, more concentrated than in 2020 when the market share of the top five firms averaged 51.0 percent.
Barriers to Lower Home Prices
The U.S. national home price index increased 55 percent between January 2020 and August 2025, according to recent data from S&P Case-Shiller (Figure 8).
Figure 8. S&P CoreLogic Case-Shiller U.S. National Home Price Index, Jan–00=100
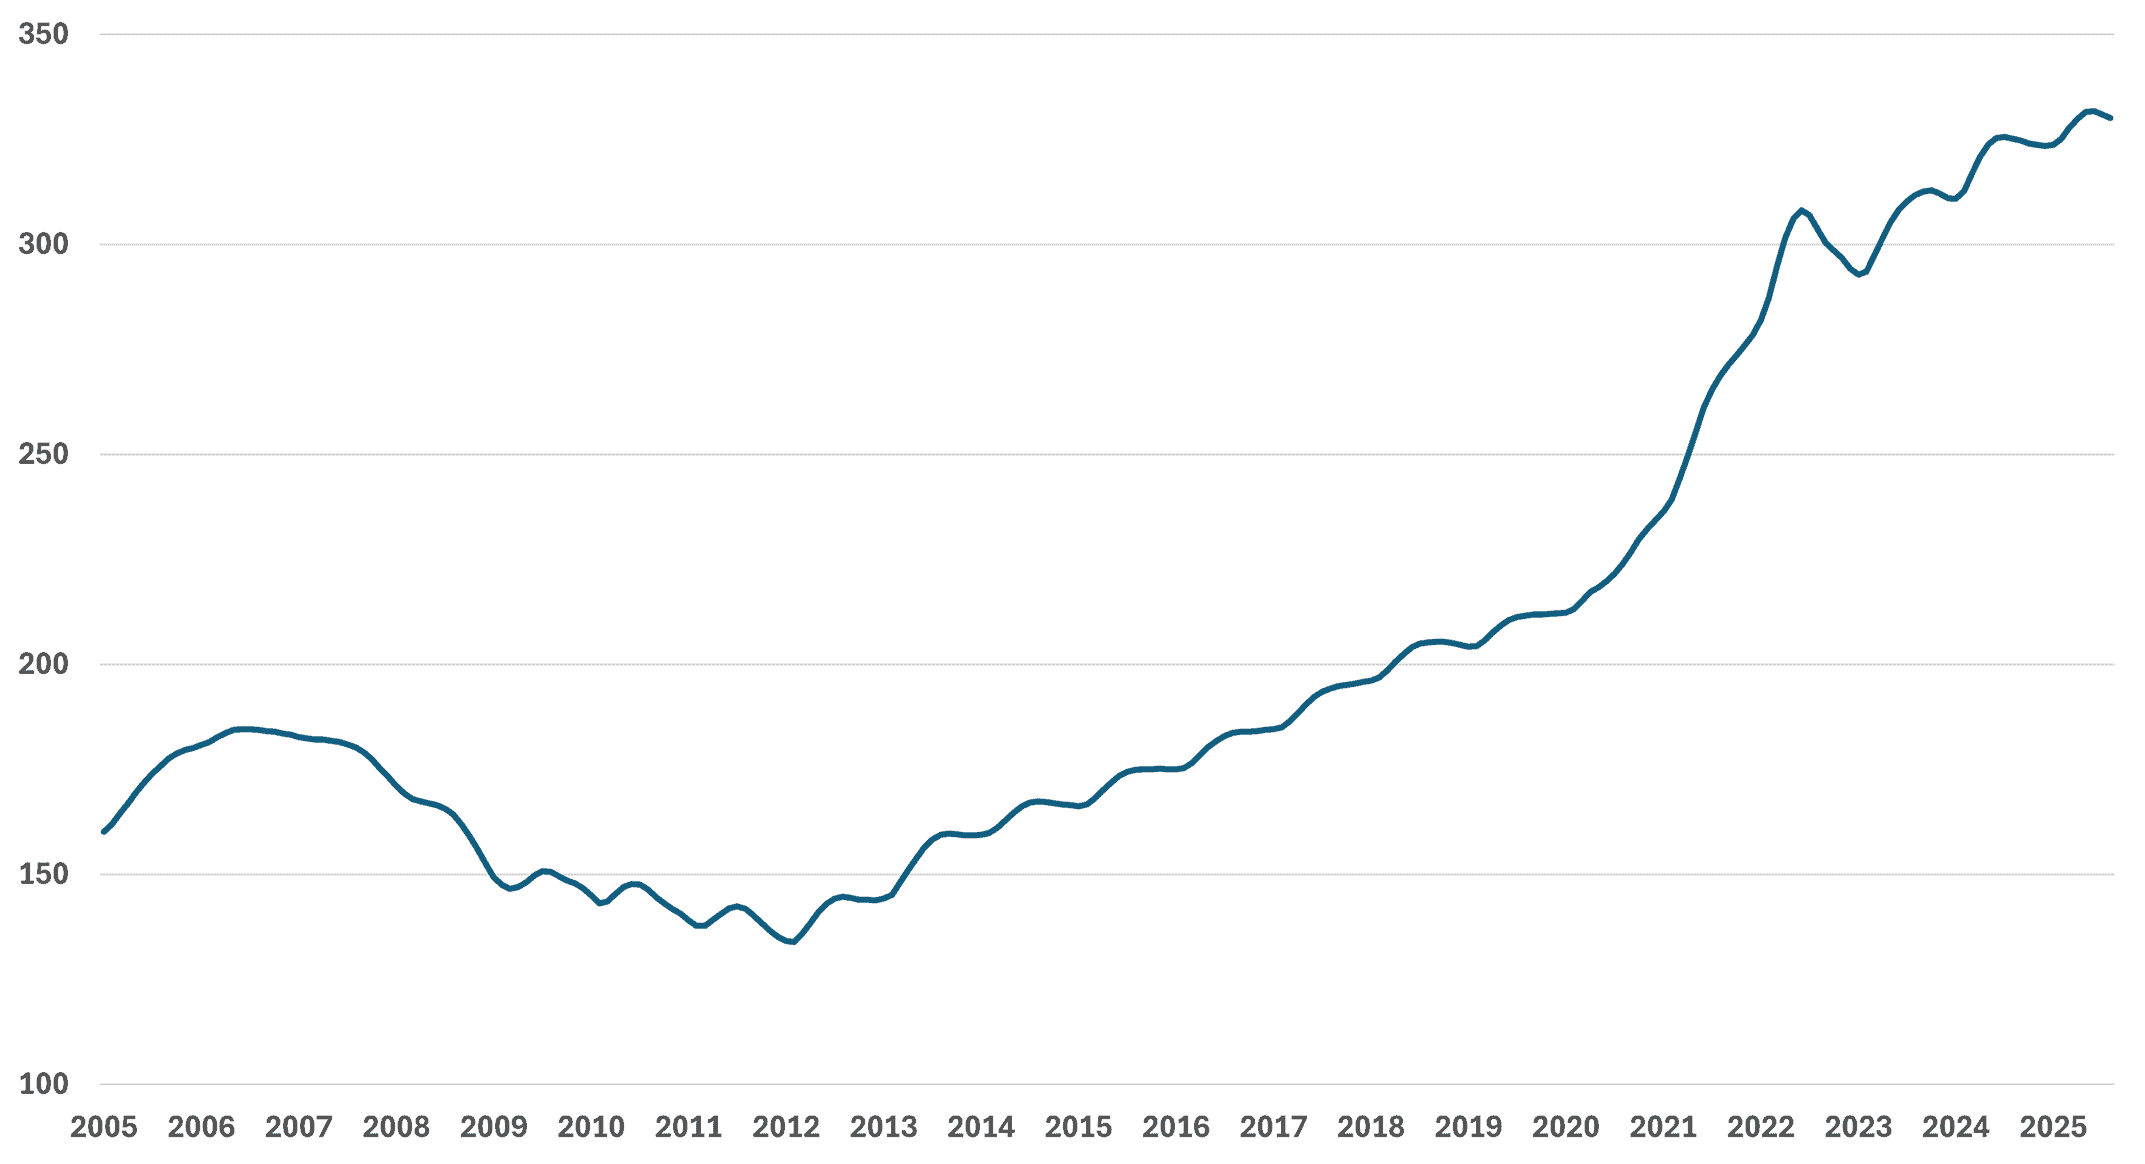
*Source: S&P CoreLogic Case-Shiller, FRED
While there is likely a supply-and-demand imbalance that is causing much of the spike in home prices, the effects of national tariff and immigration policies and local zoning restrictions have led to increased input costs for single-family residential construction that have also contributed to soaring home prices.
Producer price index (PPI) measuring inputs to single-family residential construction, excluding capital investment, labor, and imports soared 52.5 percent from January 2015 to August 2025 while overall PPI increased nearly 37 percent over the same period (Figure 9).
Figure 9. Inputs to Single-family Residential Construction, Dec-14=100
*Source: Bureau of Labor Statistics, FRED.
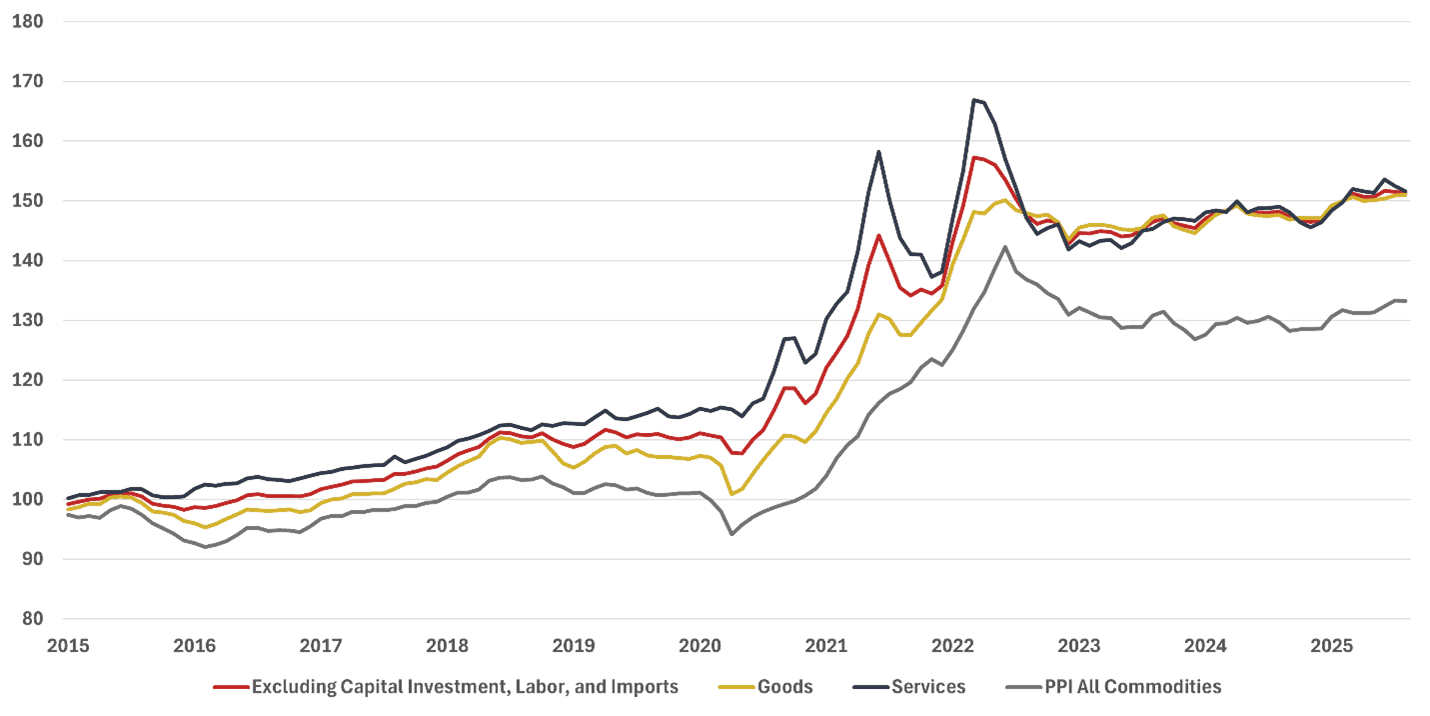
New, experimental price data from the Bureau of Labor Statistics separates prices paid for domestic goods and services from imported inputs. The data show that the price of inputs to new construction of domestically produced goods and services outpaced imported goods. But like the inputs to single-family residential construction, the overall index – which excludes capital investment and labor – outpaced overall PPI (Figure 10).
Figure 10. Inputs to New Construction Prices, Dec-18=100

*Source: Bureau of Labor Statistics.
Recent changes to tariff policies, however, could send the price of key inputs of imported goods higher. Effective October 14, 2025, the tariff rate on lumber and timber was set at 10 percent while cabinets and vanities have a 25-percent levy that will increase to 50 percent on January 1, 2026; both tariffs will likely adding costs to new home construction.
It is possible that some of the rising input costs could be offset by gains in productivity. Yet data from the Bureau of Labor Statistics showed that single-family residential construction labor productivity has been stagnant since 1987 (Figure 11).
Figure 11. Productivity for Single-family Residential Construction, 1987=100
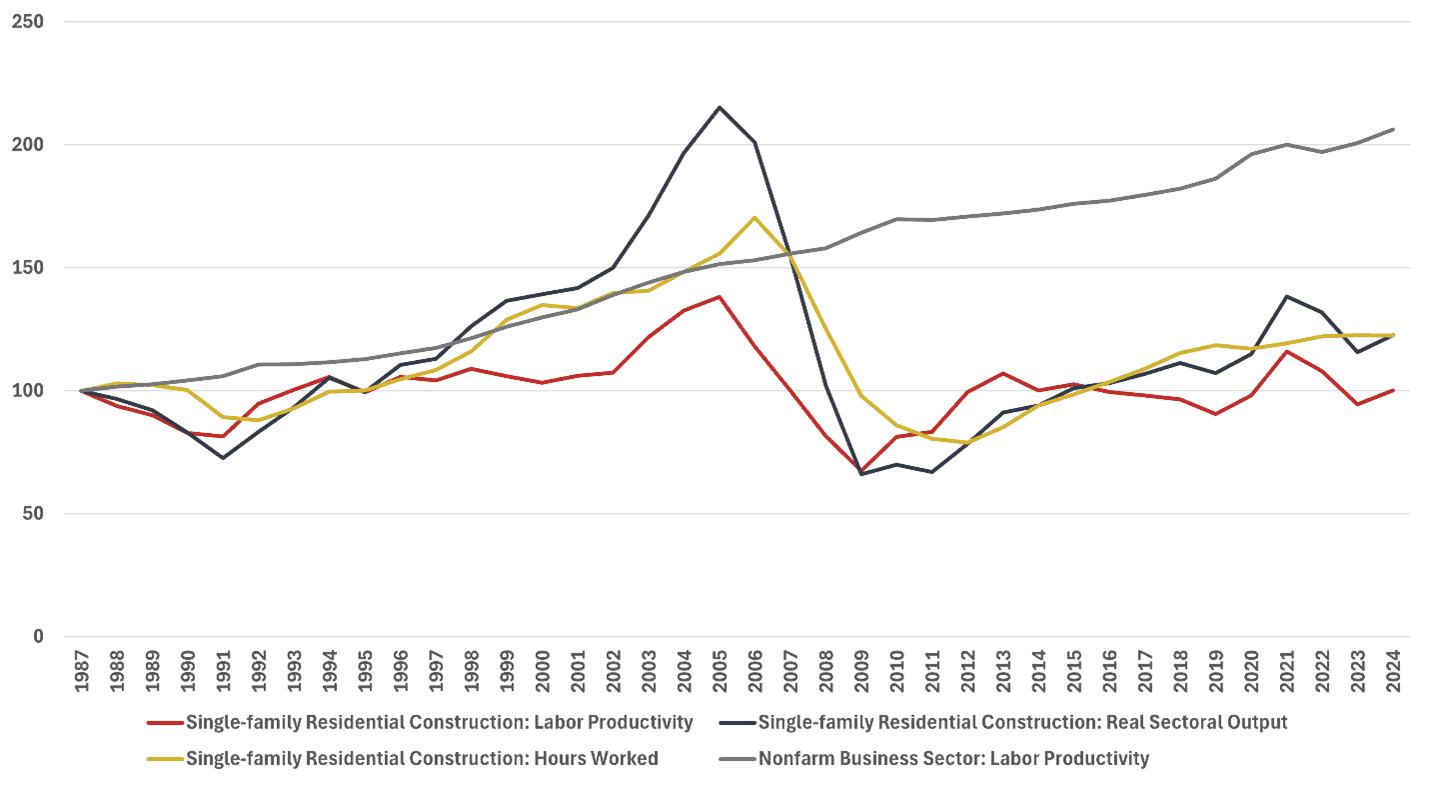
*Source: Bureau of Labor Statistics.
Research from the Federal Reserve Bank of Richmond found that construction labor productivity fell by more than 30 percent from 1970–2020, while overall U.S. productivity doubled. The study also pointed to another body of research that found no “noticeable trend” in labor productivity between 1900–1940, a boom after WWII and then a sharp decline after 1970. The report concluded that “technological progress in construction is not inherently impossible” and sought to explain why there was such a decline after 1970. The study found that the “timing of this productivity reversal roughly coincides with America’s embrace of increasingly restrictive land-use controls and building regulations.”
The Fed report further concluded that “project-level building regulations systematically reduce the size of individual construction projects by making larger developments more difficult to approve through lengthy permitting processes and community opposition.” With a low probability of approval for large projects, it “is optimal for these construction firms to pursue smaller developments,” the research explained.
These findings help explain two industry dynamics: 1) Why the industry is mostly comprised of small firms, and 2) Why the market share of the two largest firms accounts for such a large share of the top 100. The report explained that the permitting process “leads to smaller construction companies since these firms cannot efficiently manage numerous small projects scattered across different locations.” In turn, small firms reduce investment in technology and process improvements because they cannot be spread across projects. Put another way, local zoning restrictions limit firms’ ability to scale operations, giving large firms a distinct advantage over their smaller rivals. This could help explain why the market share of the top two firms made up such a large share of the increased market share among the top 100 following the COVID-19 pandemic.
What Can Be Done?
Much of the onus in lowering home prices falls on state and local authorities. Permitting and land-use reform can reduce costs for home builders and, based on the conclusions reached by the Federal Reserve Bank of Richmond, create a more competitive environment between small and large firms.
President Trump’s social media post suggested that government-sponsored enterprises Fannie Mae and Freddie Mac could play a role by expanding loans made to builders. The Senate Banking, Housing, and Urban Affairs Committee, meanwhile, unanimously passed out of committee the Renewing Opportunity in the American Dream (ROAD) to Housing Act of 2025. The bill marked the first bipartisan housing markup in over a decade, according to a committee press release, and seeks to expand housing supply.
While there are more ideas being debated at all levels of government, it is clear that the president and Congress are feeling the pressure to address rising home prices.
Conclusion
The calls to address skyrocketing home prices have intensified amid a 55-percent jump since January 2020.
While President Trump claims the problem lies with the country’s largest homebuilders stockpiling land to restrict housing supply, this research finds this is not the case. Instead, the evidence points to federal tariff and immigration policies and local regulations as the main drivers of high home prices and increased market share among the largest firms.