Research
July 30, 2025
Steel and Aluminum Tariffs: Impact on Canned Food
Executive Summary
- President Trump has doubled down on the steel and aluminum tariffs imposed during his first term, increasing the rate from 25 percent established in March to 50 percent as of June 4, and ending the company exclusion process, general product exemptions, and country-specific agreements.
- As was the case during President Trump’s first term, these tariffs will likely have a minimal impact on reversing the downward trend in steel and tinplate production, which has declined significantly since 2018.
- This research considers the likely outcome of these tariffs on the canned food industry, which occupies a market position directly downstream of steel and aluminum producers and nearby individual end consumers; if the 50-percent tariff remains in place, can manufacturers’ total costs could increase by up to 12 percent, although the price of canned food may increase to a greater extent as higher input costs work their way throughout the supply chain to the end consumer.
Introduction
President Trump has doubled down on the steel and aluminum tariffs imposed during his first term, increasing the rate from 25 percent in March to 50 percent as of June 4. A key difference from Trump’s first term, aside from higher tariff rates, is the lack of company, product, or country exemptions, which would otherwise significantly reduce overall costs. Yet as was the case during President Trump’s first term, this policy, intended to support the U.S. steel and aluminum industries, will substantially increase input costs for industries whose core inputs are steel and aluminum. Tariffs will have a minimal impact on reversing the downward trend in steel and tinplate production, which currently lacks the technical capability to create the tinplate needed for cans, and would take years to develop such a capability.
This research considers a case study of the likely outcome of these tariffs on the U.S. canned food industry, which occupies a significant market position downstream of steel and aluminum production and close to end consumers. While the full cost of tariffs may not be immediately felt due to manufacturers’ prior contracts, many producers anticipate higher consumer prices in the coming year, as they will be unable to fully absorb costs by cutting margins or negotiating with foreign producers. If the 50-percent tariff remains in place, tariffs may end up accounting for up to 12 percent of can manufacturers’ total costs, which will undoubtedly be passed along to U.S. consumers. Canned food products may see an even higher price increase as these input costs ripple throughout the supply chain, negatively impacting the purchasing power of U.S. consumers going forward.
Tariffs on Steel and Aluminum
The use of tariffs to protect the domestic steel and aluminum industries is not a new policy. Such tariffs have been implemented in the name of national security or with the hope of preserving jobs. In 2002, the Bush Administration imposed tariffs of up to 30 percent on various steel products for about two years. In 2018, the first Trump Administration implemented a 25-percent tariff on steel and a 10-percent tariff on aluminum, with exemptions, exclusions, and quotas that reduced the impact. The Biden Administration maintained this tariff regime with the addition of a few deals related to quota expansions.
Figure 1: Previous Steel and Aluminum Tariff Exemptions (Reversed March 2025)
|
Country |
2024 Combined Import Value ($ billions) | Steel |
Aluminum |
| Argentina |
$0.6 |
Quota |
Quota |
| Australia |
$0.5 |
Exempt |
Exempt |
| Brazil |
$3.2 |
Quota |
N/A |
| Canada |
$16.8 |
Exempt |
Exempt |
| European Union |
$8.6 |
Quota |
Quota |
| Japan |
$1.9 |
Quota |
N/A |
| Mexico |
$4.0 |
Exempt |
Exempt |
| South Korea |
$3.7 |
Quota |
N/A |
| Ukraine |
$0.2 |
Exempt |
N/A |
| United Kingdom |
$0.5 |
Quota |
Quota |
| Total |
$39.9 |
Source: Dataweb; Congressional Research Service
On February 10, 2025, President Trump issued an executive order that expanded the 2018 steel and aluminum tariffs, raising the rate on aluminum to 25 percent and removing all prior exemptions. He did so using Section 232 of the Trade Expansion Act of 1962, which allows the president to impose tariffs and other trade restrictions on imports with national security implications. This updated tariff policy took effect March 12, increasing imports subject to tariffs substantially compared to 2024. All told, these measures amount to a little over $6 billion in additional annualized costs for end consumers in the United States, according to American Action Forum calculations.
On June 4, steel and aluminum tariffs were raised to 50 percent to ensure, as President Trump put it during a speech to steelworkers, that imported steel “can no longer get over the fence.” This most recent tariff escalation ostensibly serves as a multipurpose tool for the administration to erect a large enough barrier to spur domestic investment, as well as provide new negotiating leverage for ongoing trade talks. Such tariffs hold historical precedent and national security rationales but have so far not achieved the intended results of revitalizing domestic investment in manufacturing, especially for tin mills.
Past Economic Impact
Past steel and aluminum tariffs have generally harmed the steel-consuming sector in exchange for only marginal benefits to the steel-producing sector. At the beginning of the Bush-era steel tariffs, there were roughly 190,000 workers within the steel industry. The result of the tariffs was lower overall economic growth and a loss of 200,000 jobs in industries reliant on steel as an input. With no significant job growth in the steel-producing sector or noticeable positive economic impact broadly, this steel tariff did not accomplish its proponents’ stated objectives.
The 2018 steel and aluminum tariffs are estimated to have had similar results for the U.S. economy. The Bureau of Labor Statistics predicted that these measures may have reduced gross domestic product (GDP) by 0.25 percent over the long term. As many as 8,700 jobs were created within the steel industry but at the expense of roughly 75,000 manufacturing jobs. This is because, for every one steelworker, there are more than 140 jobs directly reliant on steel as an input, with many more indirectly affected throughout the supply chain. The impact of past tariff policy can, at best, be summarized as maintaining a mostly stagnant level of employment in the steel- and aluminum-producing industries. The economic cost of each job created during this period was roughly $650,000 and does not factor in lost manufacturing employment due to higher input costs. The U.S. International Trade Commission estimates that between 2018 and 2021 imports of steel declined 24 percent and imports of aluminum declined 31 percent. At the same time, prices for certain steel products rose by 2.4 percent and 3.6 percent for aluminum products.
Figure 2: Capacity Utilization Rate for Iron and Steel Products
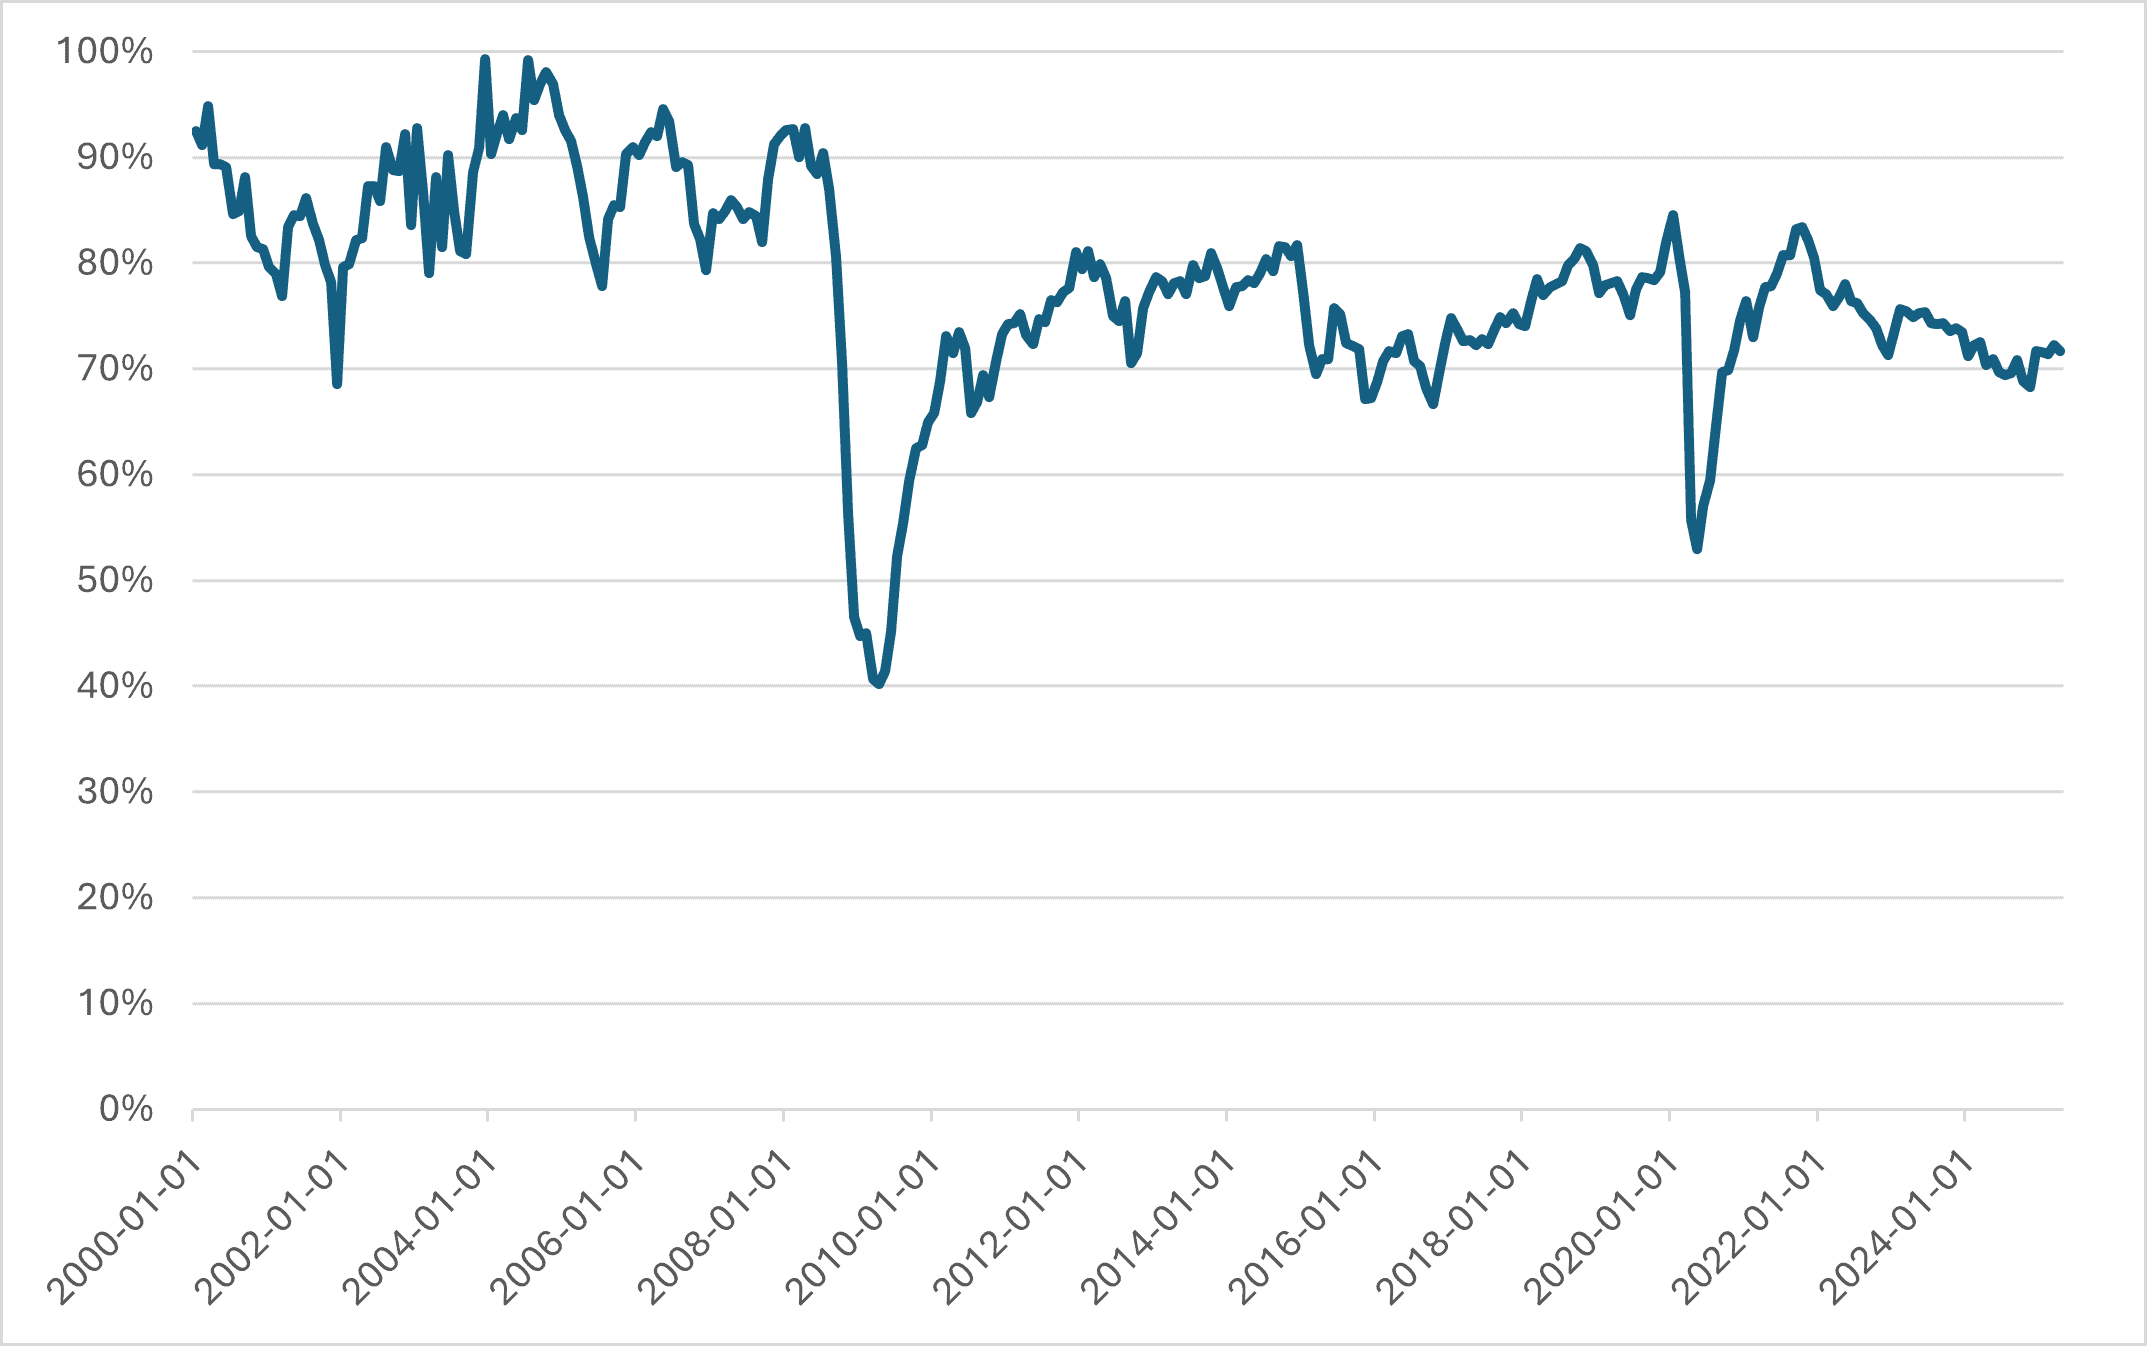
Source: Federal Reserve Economic Data
Figure 3: Employment in Steel and Aluminum Production
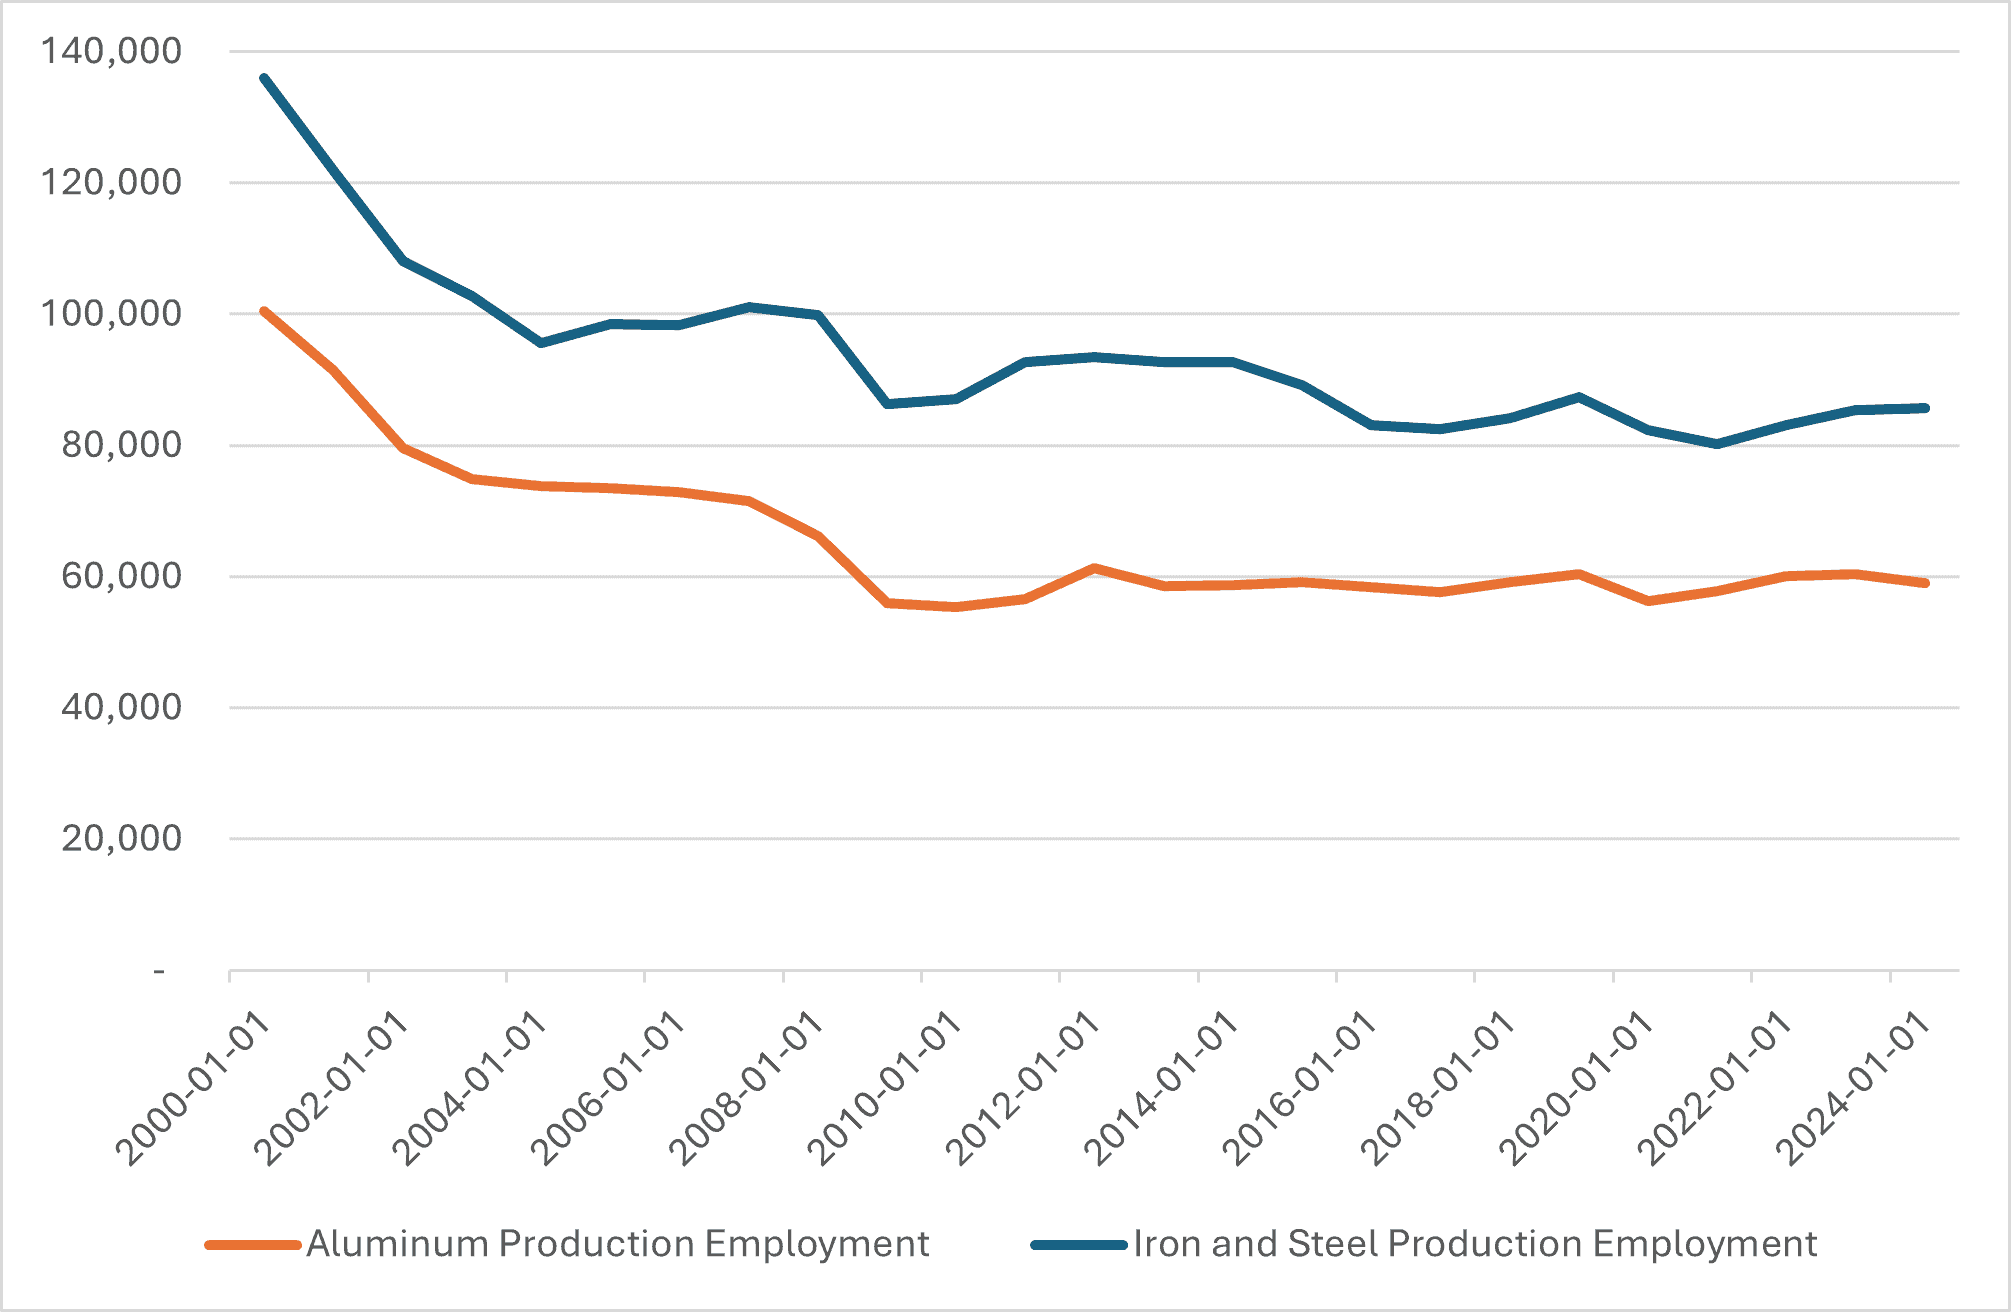
Source: Federal Reserve Economic Data; Federal Reserve Economic Data
The achievement of national security – the metric of success for which is greater domestic productive capacity – and employment goals from the 2018 steel and aluminum tariffs were mixed, at best. At first glance, the capacity utilization rate (defined as the actual output divided by maximum potential output) for iron and steel products rose slightly in the immediate aftermath of the tariffs, increasing from about 78 percent to 80 percent by the end of 2018 (see Figure 2). This rise followed an existing upward trend in the utilization rate that began at the tail end of 2015. Any progress was quickly reversed during the COVID-19 pandemic, which has muddied the waters in determining the true impact of tariffs compared to other economic factors. As of April 2025, the capacity utilization rate sits at 72 percent, despite tariffs remaining in place since 2018. Over the same period, total crude steel production in the United States fell from 90 million tons to about 81 million tons, meaning U.S. production fell from 11 percent to 4 percent of global production. Specialized tinplate capacity, used in the production of food cans, has experienced a similar lack of development, with fewer domestic producers operating now than two decades ago. In fact, nine tinplate production lines have shut down since 2018, which represents a 75-percent decline despite the imposition of protective tariffs.
Tariff Impact on Can Manufacturers and Food Cans
U.S. can manufacturers and distributors are in a unique position when it comes to steel and aluminum tariffs, as they are an intermediary between steel producers and retailers/ grocery stores that serve U.S. consumers. Like other packaging and container industries, they operate in a low-margin, price-sensitive environment that has a direct impact on everyday consumer purchases, such as canned fruits, vegetables, and numerous other household consumables. Therefore, any tariff has a large impact on the competitiveness of these U.S. firms as it eats into margins and forces some degree of added cost sharing with customers. The size of the U.S. market and the premium foreign suppliers receive compared to other markets allow for some negotiating leverage, although this does not negate the majority of additional tariff costs.
The 2018 steel tariff case may prove instructive for determining what may happen in 2025. These past tariffs impacted a variety of inputs for food can manufacturers. The Harmonized Tariff Schedule (HTS) codes of four of the primary imports are used in Figure 4, which shows the monthly tariff costs on these goods between January 2017 and May 2025. The recent wave of tariff measures on steel and aluminum have had a significant impact, with tariff costs being nearly six times higher than May of last year and more than 12 times higher than May 2018. Costs have increased in recent months due to both higher effective tariff rates as well as higher import volumes over time. In 2024, effective tariff rates on the imports used in Figure 4 ranged from an average of 3 to 7 percent while the average rates in 2025 range from 10 to 15 percent so far. Country exemptions and quotas are the main reason why each import did not face a full 25-percent tariff, as well as why the effective tariff rates declined over the years. Exact tariff costs for individual manufacturers differ depending on their supplier.
Figure 4: Monthly Tariff Costs for Certain Can Manufacturer Inputs (Through May 2025)
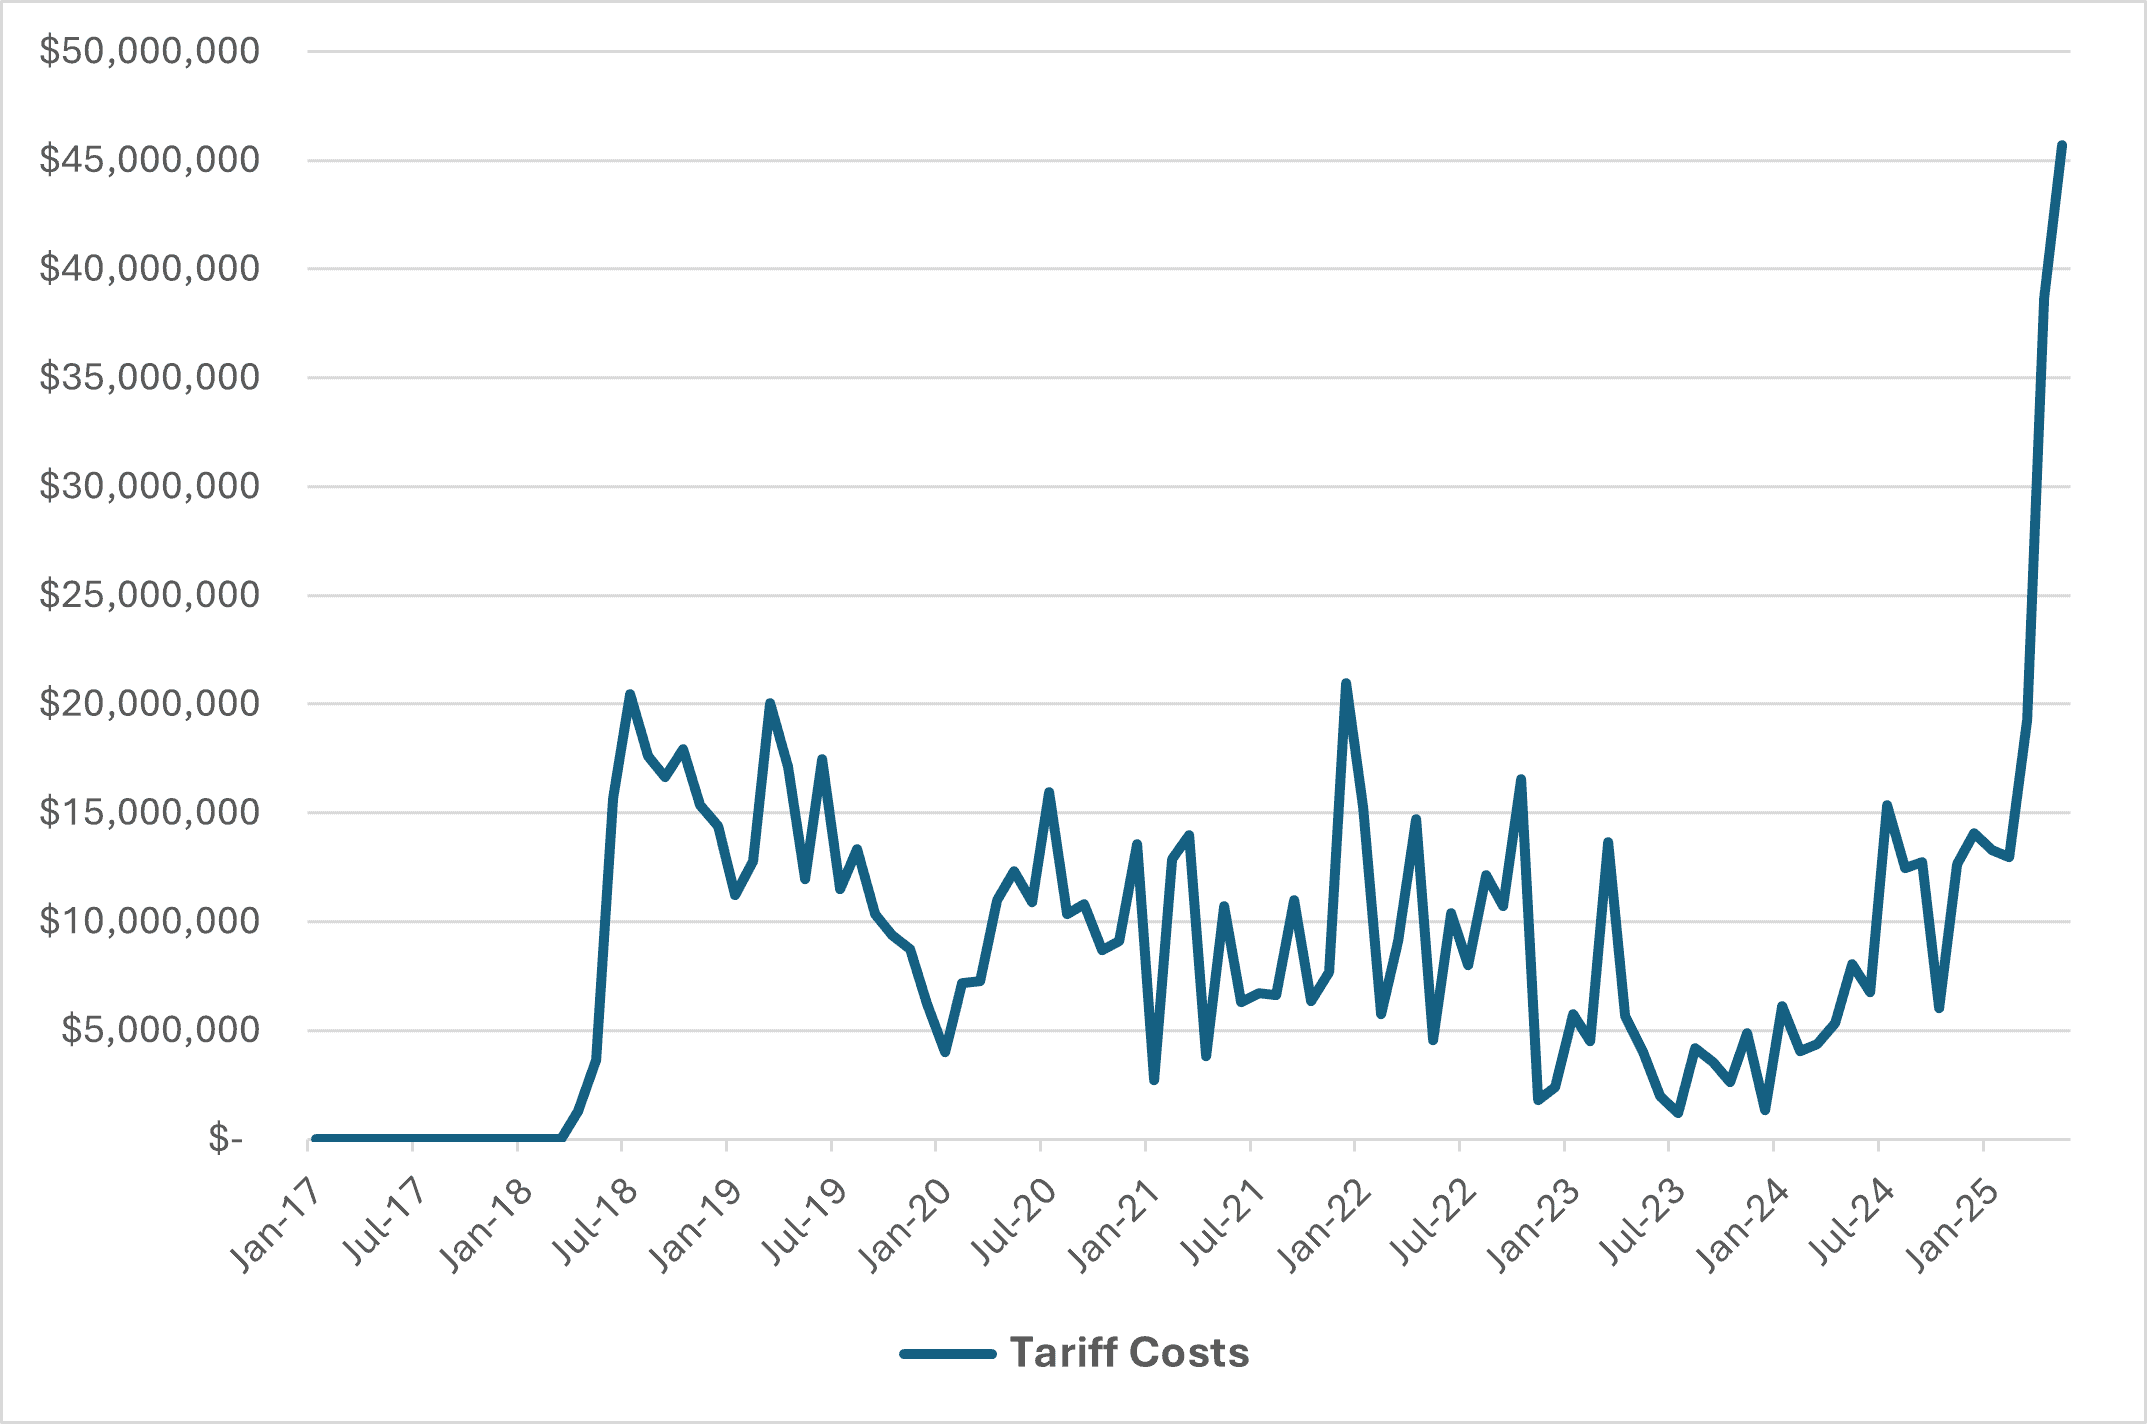
Source: Dataweb
The added tariff rates in Figure 4 and subsequent tens of millions of dollars in additional import taxes account, in part, for the overall cost increases food can manufacturers faced during this period. Assuming steel accounted for roughly 40 percent of a firm’s costs in 2018 based on industry data, tariffs may have accounted for between 1–5 percent of total costs. At the high-end estimate, tariffs would have nearly erased profit margins if manufacturers had not passed along costs to consumers. This range is dependent on the proportion of steel a firm received from foreign suppliers as well as the type of steel input imported. Using the same assumptions in 2019, tariffs accounted for between 1–6 percent of total costs for the typical food can manufacturer. This finding is further supported when examining data on the price increase of a select group of canned vegetables in 2018 and 2019. The year-over-year average price increase of this group of canned products was 1.4 percent in 2018 and 5.2 percent in 2019, demonstrating that the 2018 tariffs did not immediately impact consumer prices until a year or so later. It takes time for tariff costs to pass through to U.S. consumers.
Looking Ahead at 2025 Tariffs
While it is difficult to determine exact dollar costs to manufacturers and consumers, it is possible to use a formula to estimate the maximum share of a firm’s costs that can come from importing before that firm becomes unprofitable as a result of tariffs. While specifics on margins within food can manufacturing are not uniform or available, similar sectors are listed in Figure 5, with the closest proxy being the packaging and container industry, which has a net margin of 6.8 percent. This means that a 25-percent tariff on impacted inputs would force steel can manufacturers to limit import costs to 29.3 percent of total costs, in order to maintain profitability. A 50-percent tariff lowers this threshold to 14.6 percent of total costs.
Figure 5: Maximum Percent of Costs From Imports for Select U.S. Industries to Maintain Profitability
|
Industry |
Net Margin | Max Percent of Costs From Imports With 25% Tariff |
Max Percent of Costs From Imports With 50% Tariff |
| Steel |
5.3% |
22.2% |
11.1% |
| Packaging & Container |
6.8% |
29.3% |
14.6% |
| Total Market |
8.7% |
38.0% |
19.0% |
Source: New York University Stern School of Business
Building from the information from Figure 5, it is possible to provide a range of estimates of the impact on can manufacturer profitability given a few scenarios. Figure 6 displays the percentage point difference from a firm’s break-even point based on the level of steel imported, the tariff level, and the percentage of total costs associated with tinplate. For example, a can manufacturer that imports 90 percent of its steel will be unprofitable given a 25-percent tariff and tinplate being a low percentage of its total costs. That firm is unprofitable because its total costs from imports are 12.3 percentage points above the maximum (see Figure 6). Given that can manufacturers rely heavily on imported steel products as a result of a lack of domestic capacity, a 50-percent tariff will require price hikes that trickle downstream to U.S. consumers to maintain their profit margins. Even the original 25-percent steel tariff would require substantial price increases to maintain operations.
Figure 6: Percentage Point Difference From Break-even for the U.S. Packaging and Container Industry
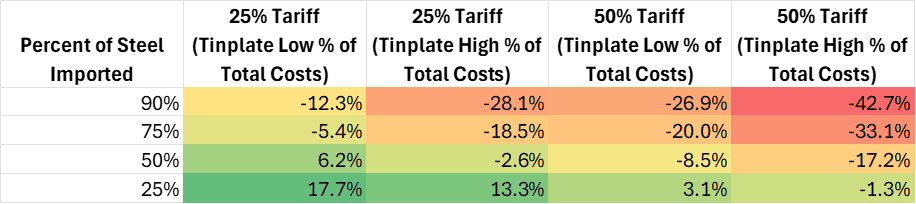
Source: Industry Data; New York University Stern School of Business
Assuming steel and other materials account for just over 40 percent of a firm’s costs as of 2024, tariffs may currently account for anywhere between 0.5 percent and 5 percent of total costs. This range is dependent on the proportion of steel a firm receives from foreign suppliers as well as the type of steel input imported. Assuming the current 50-percent tariff policy remains in place, tariffs may eventually account for between 3 percent and 12 percent of total costs for the average food can manufacturer. This takes into account various offsets that are likely to occur that lower the overall effective tariff rate.
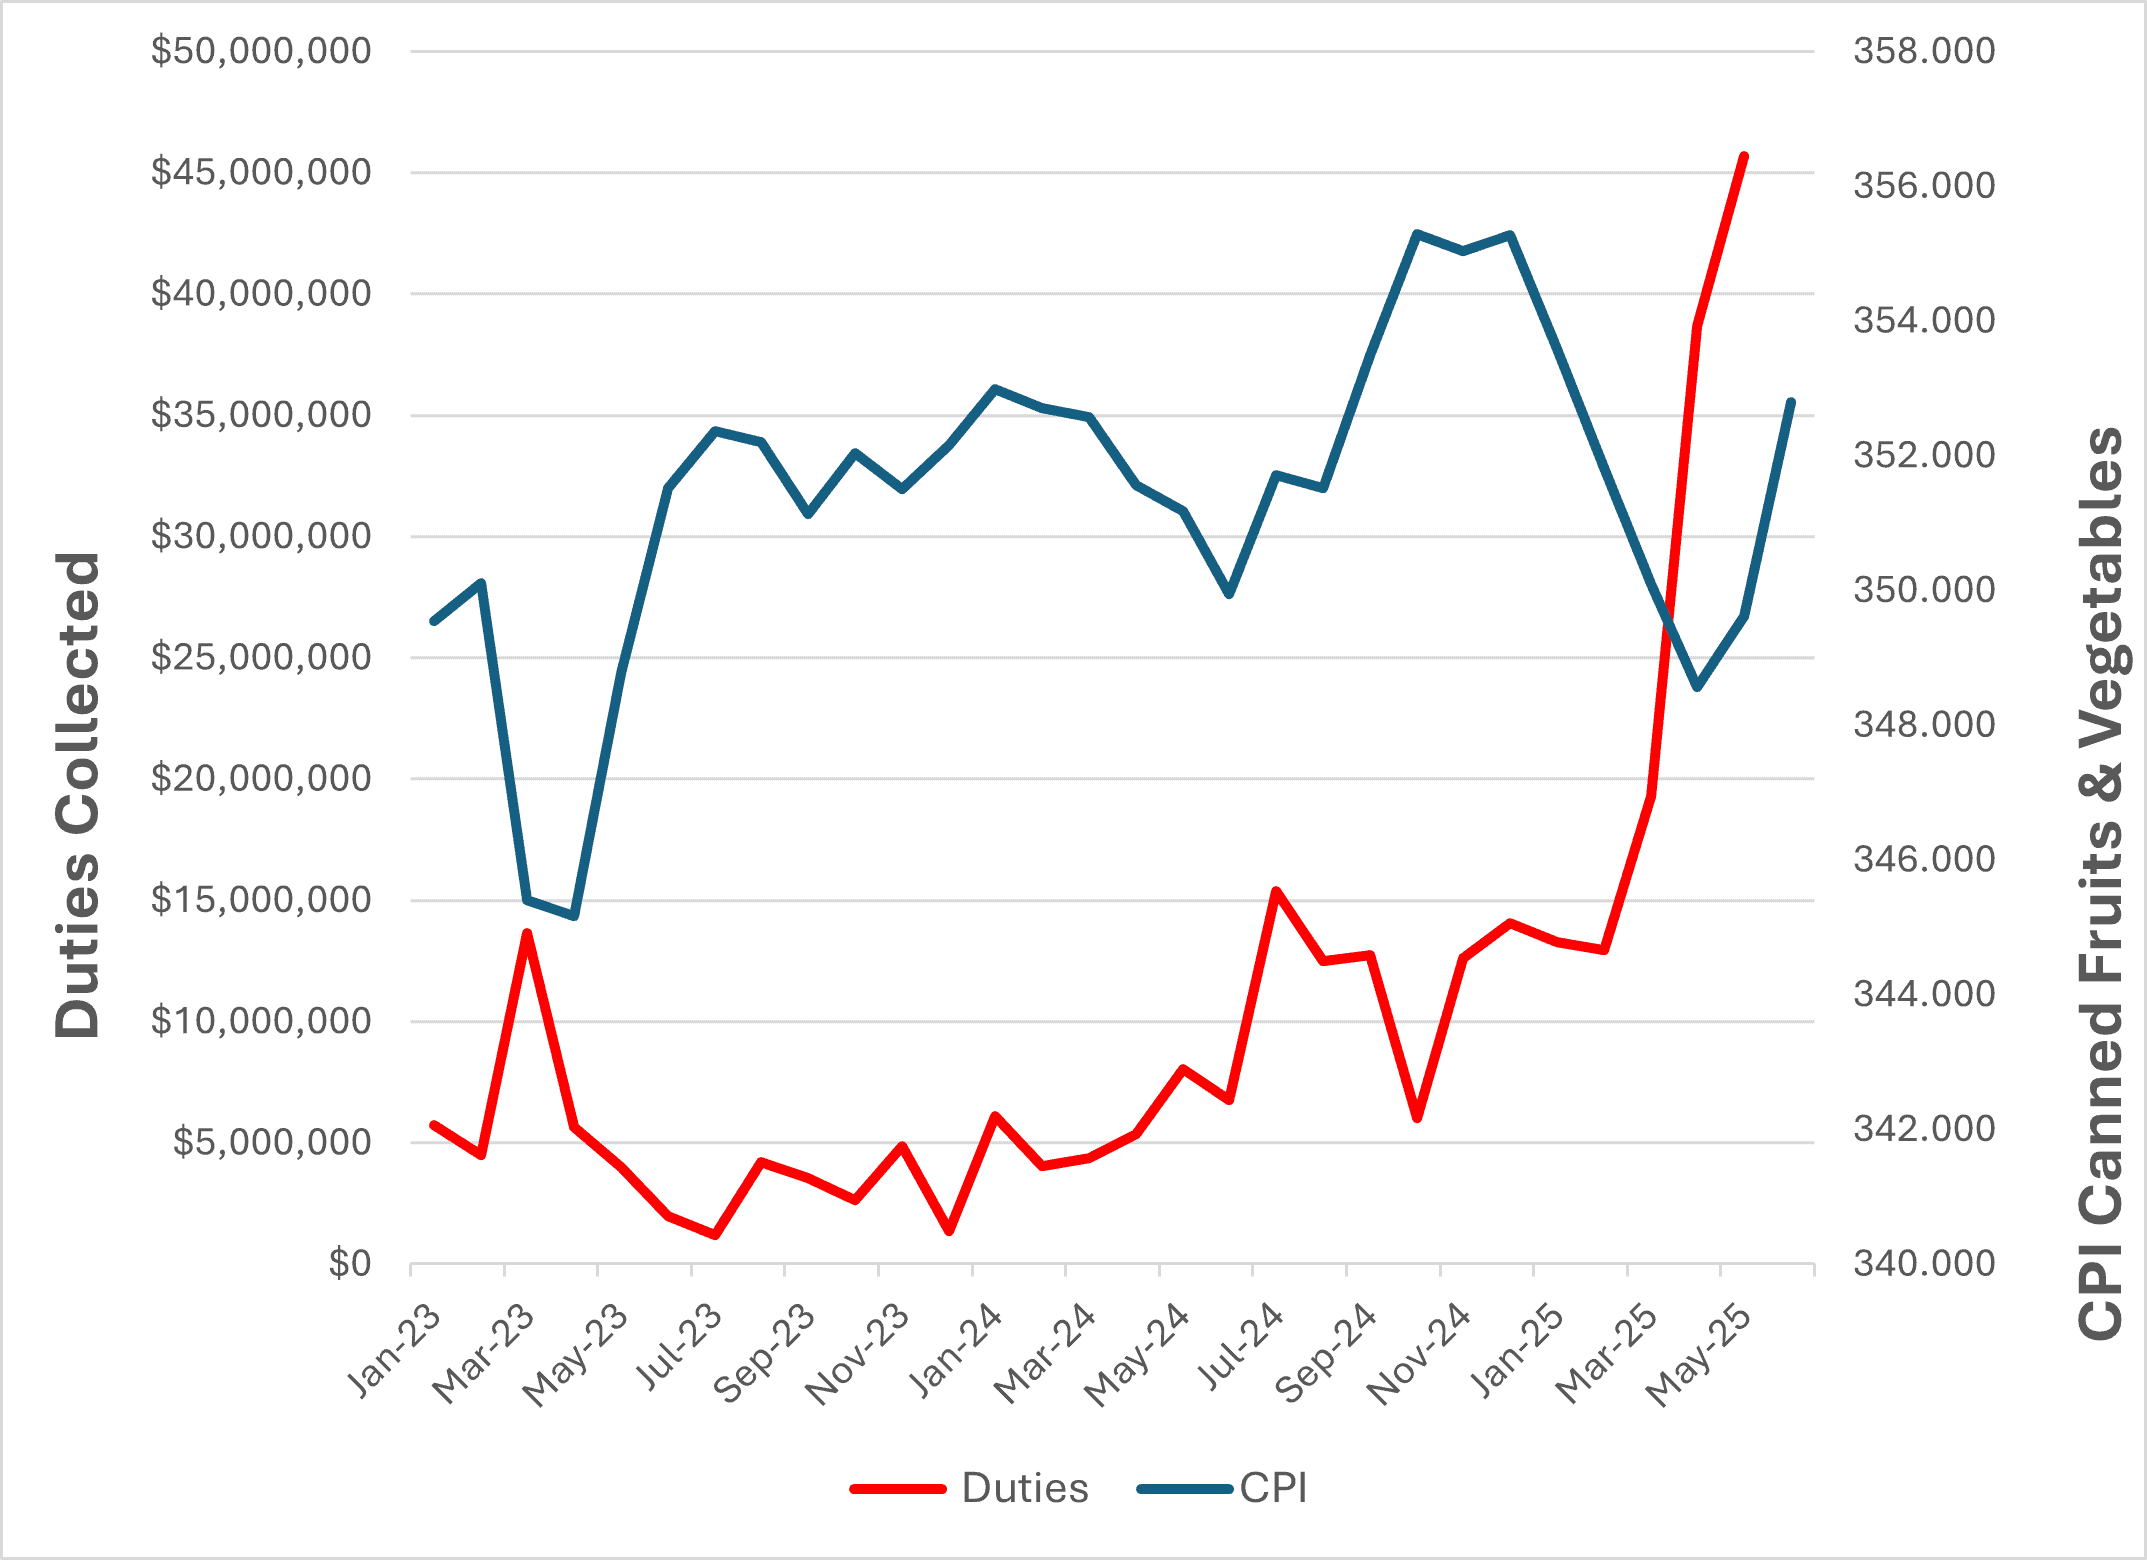
This increase in total costs for can manufacturers is likely just the tip of the iceberg for the downstream impact on store shelf prices for canned food products. Each step of the supply chain will experience similar price hikes, which will augment the increase in prices paid by U.S. consumers. Looking at consumer price inflation (CPI) data, the seasonally adjusted change in the price of canned vegetables was 2.6 percent from April to May and 0.6 percent from May to June, showing tariff pressures may already be working their way to U.S. consumers. Figure 7 displays the recent relationship between duties collected on tinplate and CPI for canned fruits and vegetables. The data indicates that there is a correlation between the two, with a lag period between tariff hikes and a subsequent increase in CPI. This suggests that there is likely to be even greater canned food inflation throughout the remainder of 2025 if current tariff levels are maintained. While tariffs may account for 12 percent of total costs, certain canned food prices could rise well beyond that level.
Figure 7: Duties Collected vs CPI Canned Fruits and Vegetables
Source: Dataweb; Federal Reserve Economic Data
Food Can Manufacturer Reaction
The American Action Forum was able to speak with and interview multiple steel can manufacturers and distributors to better understand how tariffs will impact operations. Shortly after the 25-percent tariff and exemption revocations were announced, discussions began between manufacturers and suppliers on how to share the added costs in the short term. Contracts are typically negotiated on an annual basis starting around the October-December timeframe, meaning many manufacturers expect further price hikes to hit store shelves between 2026 and 2027. All the steel tariff exclusions will be fully expired by this time. The expectations are quite similar to the 2018 steel tariffs, where tariff costs were eventually passed onto retailers and consumers while manufacturers looked into cost-cutting measures. Manufacturers repeatedly emphasized the fact that there is currently not enough capacity available in the United States or technical capability to create the type of tinplate needed for cans. This means that any increase in domestic production is years away, making the significant addition to input costs almost unavoidable and necessary to pass along to consumers.