Research
September 23, 2025
Tariff Fraud or Data Flawed?
Executive Summary
- Earlier this month, appliance manufacturing company Whirlpool claimed that some of its competitors are unfairly devaluing U.S. imports at the point of entry to avoid paying high tariff costs while maintaining prices at the point of retail sale.
- Whirlpool alleges that tariff evasion is taking place after noticing a roughly 50–90 percent drop in the per-unit import value of garbage disposals from China, gas ranges from Thailand, and front-load washers from South Korea; others suggest the discrepancy may be due to data-entry errors.
- While there may be evidence pointing to tariff evasion, the data also suggest other anomalies are taking place that are not unique to the highlighted countries, which may point to a broader data-entry concern that deserves further attention.
Introduction
Earlier this month, appliance manufacturing company Whirlpool claimed that some of its competitors are unfairly devaluing U.S. imports at the point of entry to avoid paying high tariff costs while maintaining prices at the point of retail sale. Whirlpool alleges that this tariff evasion is taking place after noticing a roughly 50–90 percent drop in the per-unit import value of garbage disposals from China, gas ranges from Thailand, and front-load washers from South Korea. Others suggest the discrepancy may be due to data-entry errors or “double counting” of imports due to the added complexity of the current trade environment. Washing machine data may support this perspective, as there was a 600-percent year-over-year increase in imported units and 860-percent increase compared to the January-May average, an unprecedented and impractical surge.
While there may be evidence pointing to tariff evasion, the data also suggest that other anomalies are taking place that are not unique to the countries and products highlighted by Whirlpool. This may suggest that there is more widespread tariff evasion taking place or it may point to a broader data-entry concern that will negatively impact the ability of policymakers and economic analysts to accurately make decisions. This research analyzes the import data for garbage disposals, gas ranges, and washing machines, as well as other appliances, to weigh the credibility of Whirlpool’s tariff evasion claim against the possibility of a widespread data-entry issue.
The Whirlpool Claim
As reported by The Wall Street Journal (WSJ), domestic appliance manufacturer Whirlpool is claiming its competitors – Samsung, LG, and GE Appliances – are evading U.S. tariffs. Specifically, Whirlpool is accusing these companies of undervaluing imports at U.S. points of entry to reduce the tariff placed on these goods. Since many tariffs are calculated as a percentage of a product’s import value, a smaller declared value will result in a smaller tariff paid by an importer (see more in Appendix). At the same time, Whirlpool notes that these items’ retail prices have not seen a similar drop. The WSJ highlights three products: garbage disposals from China, gas ranges from Thailand, and front-load washing machines from South Korea.
The import data the WSJ reviewed show the import value per unit dropping substantially between January and July: 60 percent for garbage disposals, over 50 percent for gas ranges, and 90 percent for front-load washing machines. While Whirlpool has expressed its concerns to the Trump Administration, it has not filed a formal complaint. Samsung has declined to comment, LG has stated it is committed to U.S. laws, and GE Appliances has said the claims are inaccurate.
Presumably, Whirlpool and the WSJ calculated the price per unit using the simple equation shown below to examine whether appliance manufacturers are undervaluing imports.

This equation holds that the price per unit can decrease either by lowering the value of imported goods or by increasing the number of imported units, all else being equal. In this case, an observed decline in the calculated price per unit may be a result of a firm lowering the reported value per unit when entering the United States. The per-unit price could also appear lower due to a data-collection issue that may be caused by firms filling out duplicative forms or other errors that lead to a “double count” of the number of reported units, thereby artificially lowering the price per unit calculation. As an example, if a firm were to fill in a form to address a “Liberation Day” tariff, and another form to address a steel tariff, both forms could be counted as pertaining to separate products rather than two forms for the same good. An executive at CargoTrans – a logistics company and customs broker – suggests that new, complex steel tariffs may have caused a “double-counting,” while Whirlpool maintains that its competitors “are very large and sophisticated companies that know how to declare their imports.”
Figure 1: Per-unit Value of Imported Products Facing Tariff Evasion Allegations (WSJ)
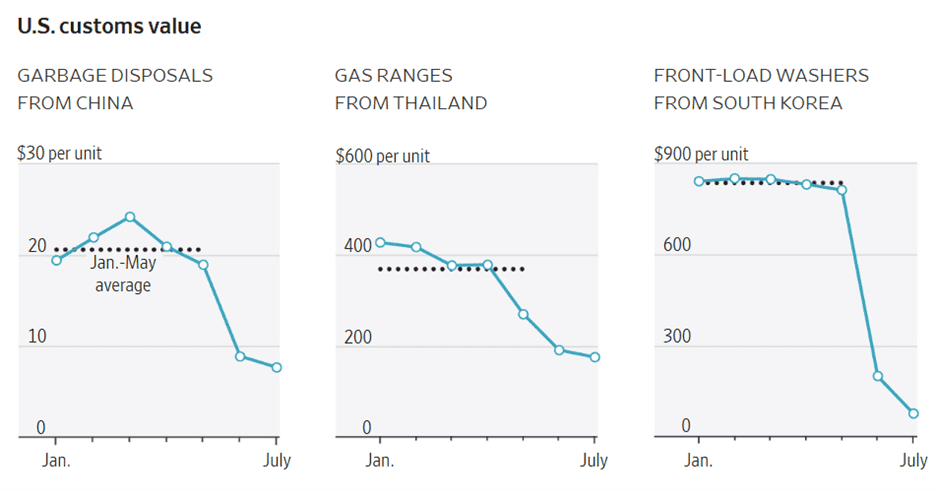
Source: From the WSJ; U.S. Census Bureau
At first glance, Figure 1 clearly shows dramatic declines in the per-unit import price for each product. The question remains, however, whether this drop is due to intentional tariff evasion or some sort of date-entry error.
Garbage Disposal Imports
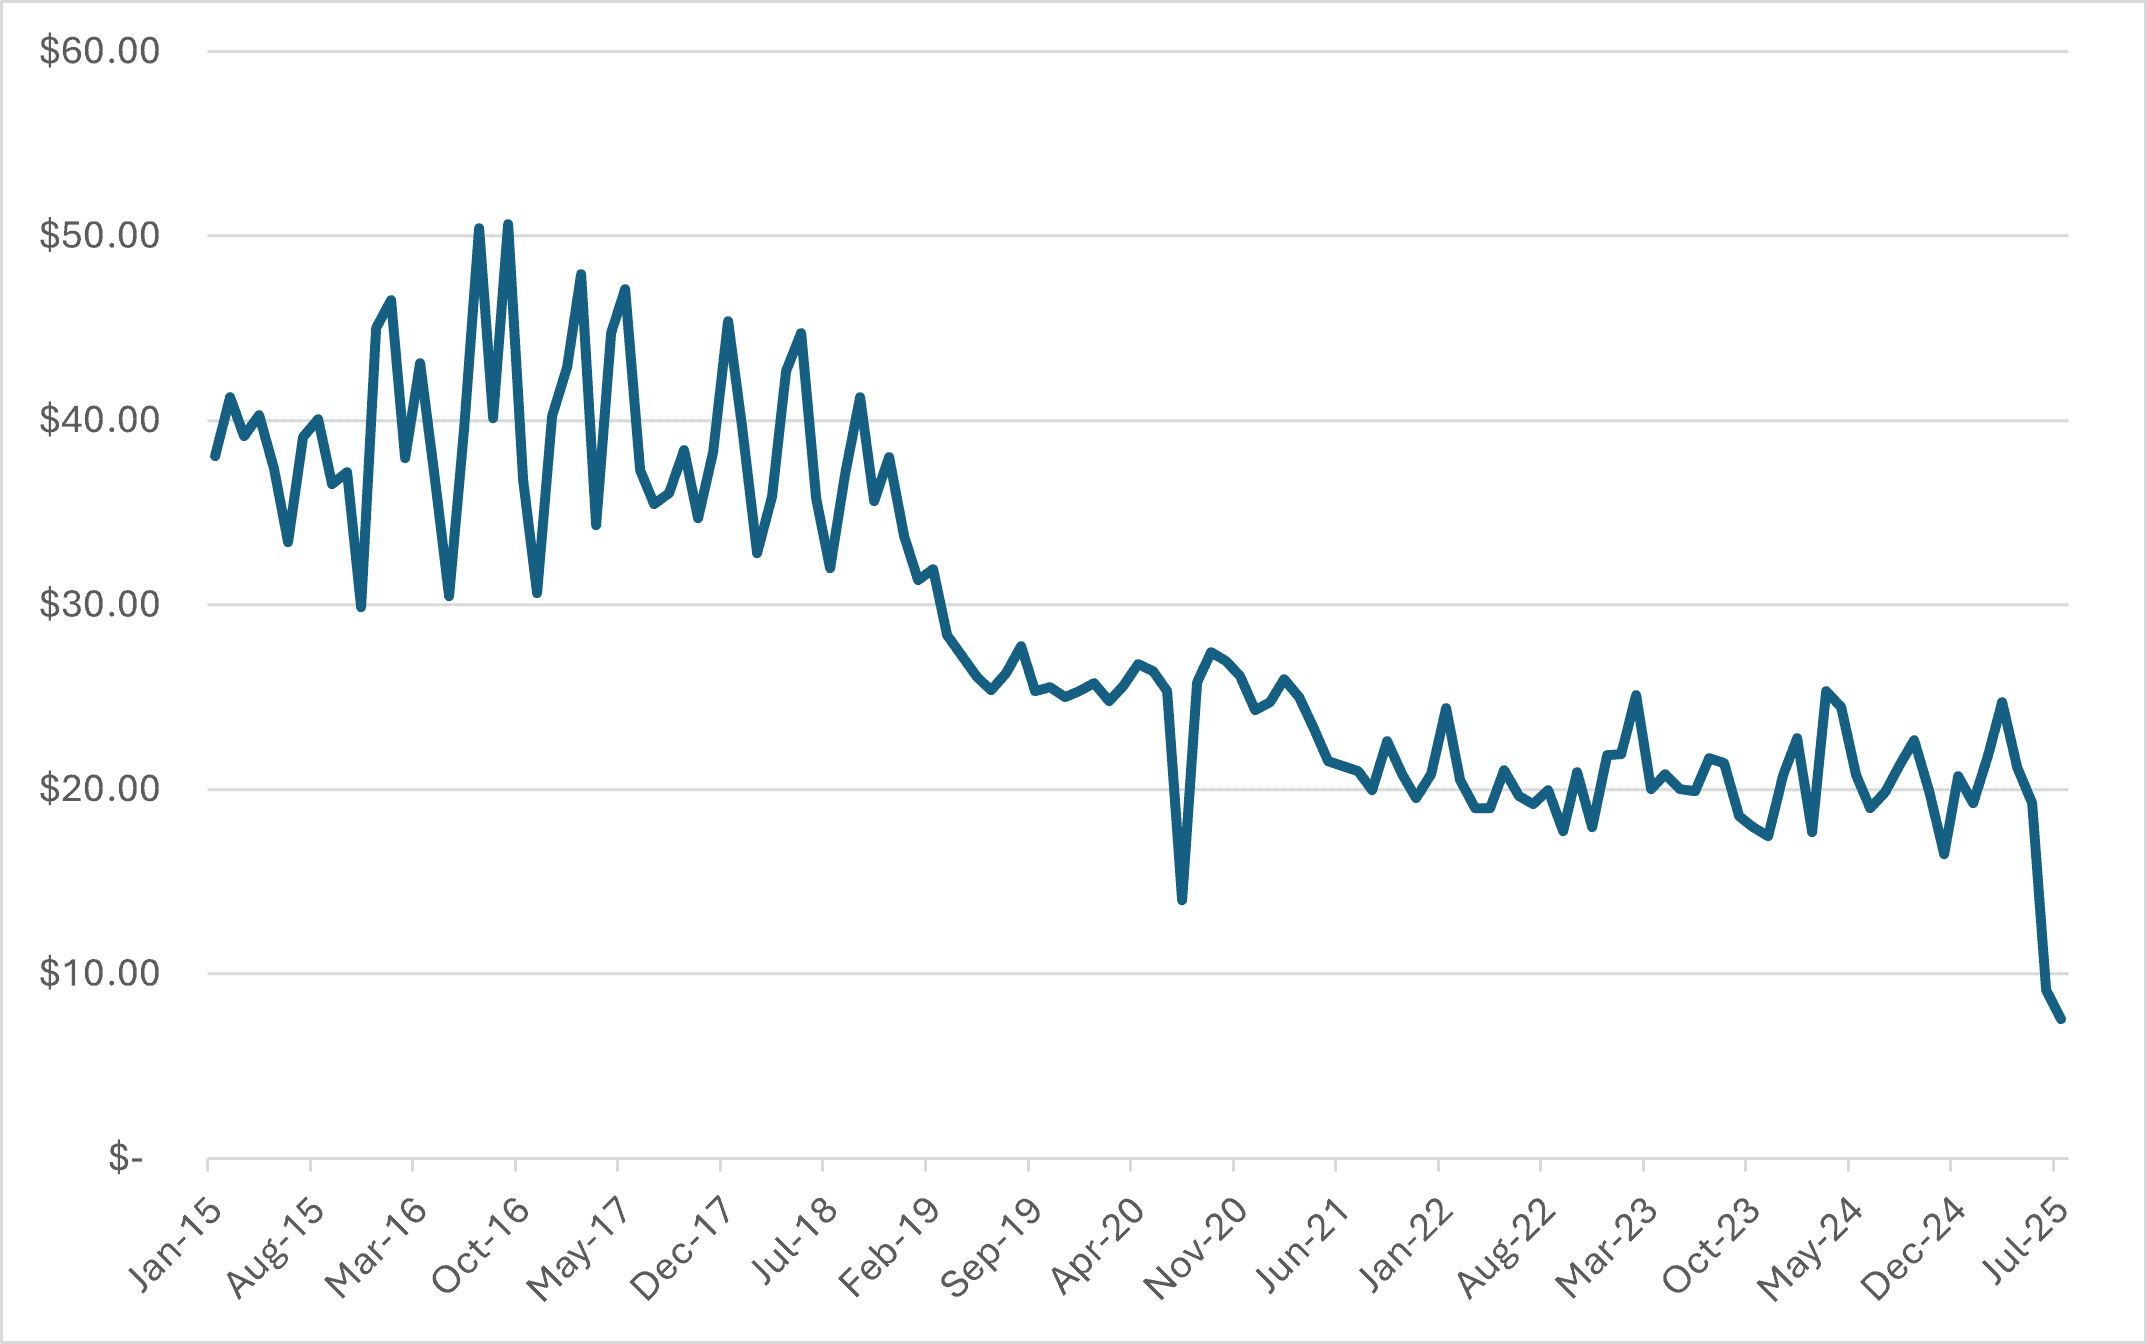
The specific garbage disposal imports referenced in the WSJ article are electric kitchen waste disposals (HTS 8509802000) from China. In 2024, roughly 45 percent of these garbage disposal imports came from China. Between January and May of 2025, the average value per unit was $21.27 and has since fallen to $9.10 in June and $7.54 in July (Figure 2). While the price of garbage disposals from China has been trending down since 2015, there has never been a price drop of this magnitude and the last major decline was during the COVID-19 pandemic.
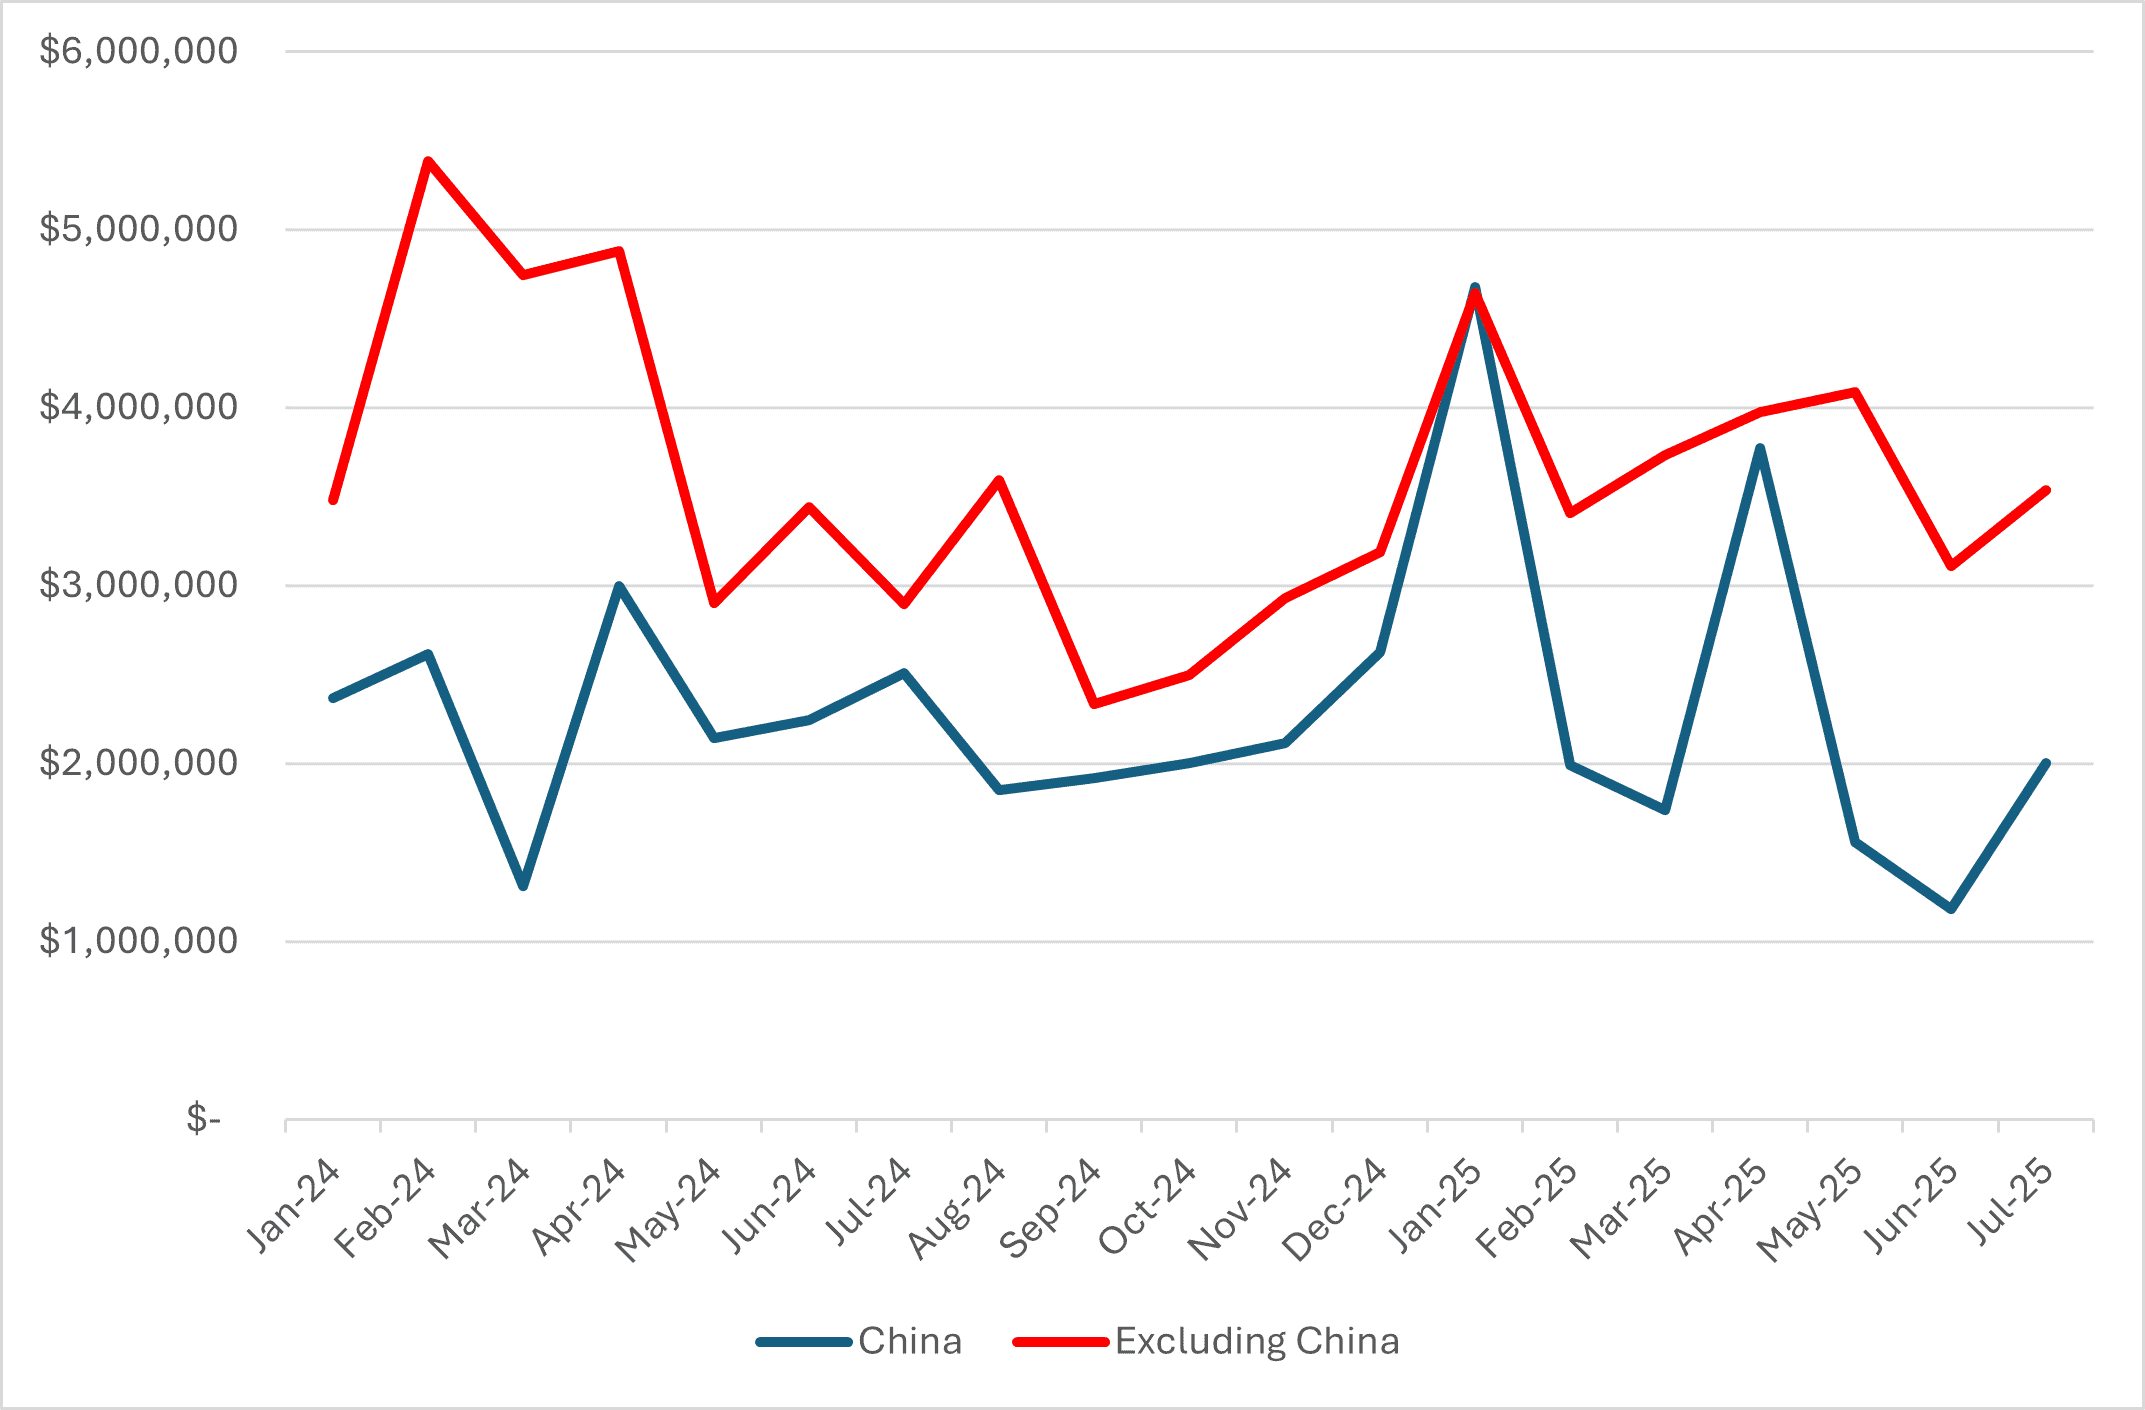
The primary driver behind the recent decline in the unit value of garbage disposals from China is a large increase in the number of units imported (Figure 3). The total number of imports reportedly increased 100 percent year over year in July while total import value decreased by 20 percent during the same period. Excluding China, the per-unit value has stayed relatively flat in 2025, indicating that this is a China-specific phenomenon.
Figure 2: Per-unit Value of Imported Garbage Disposals
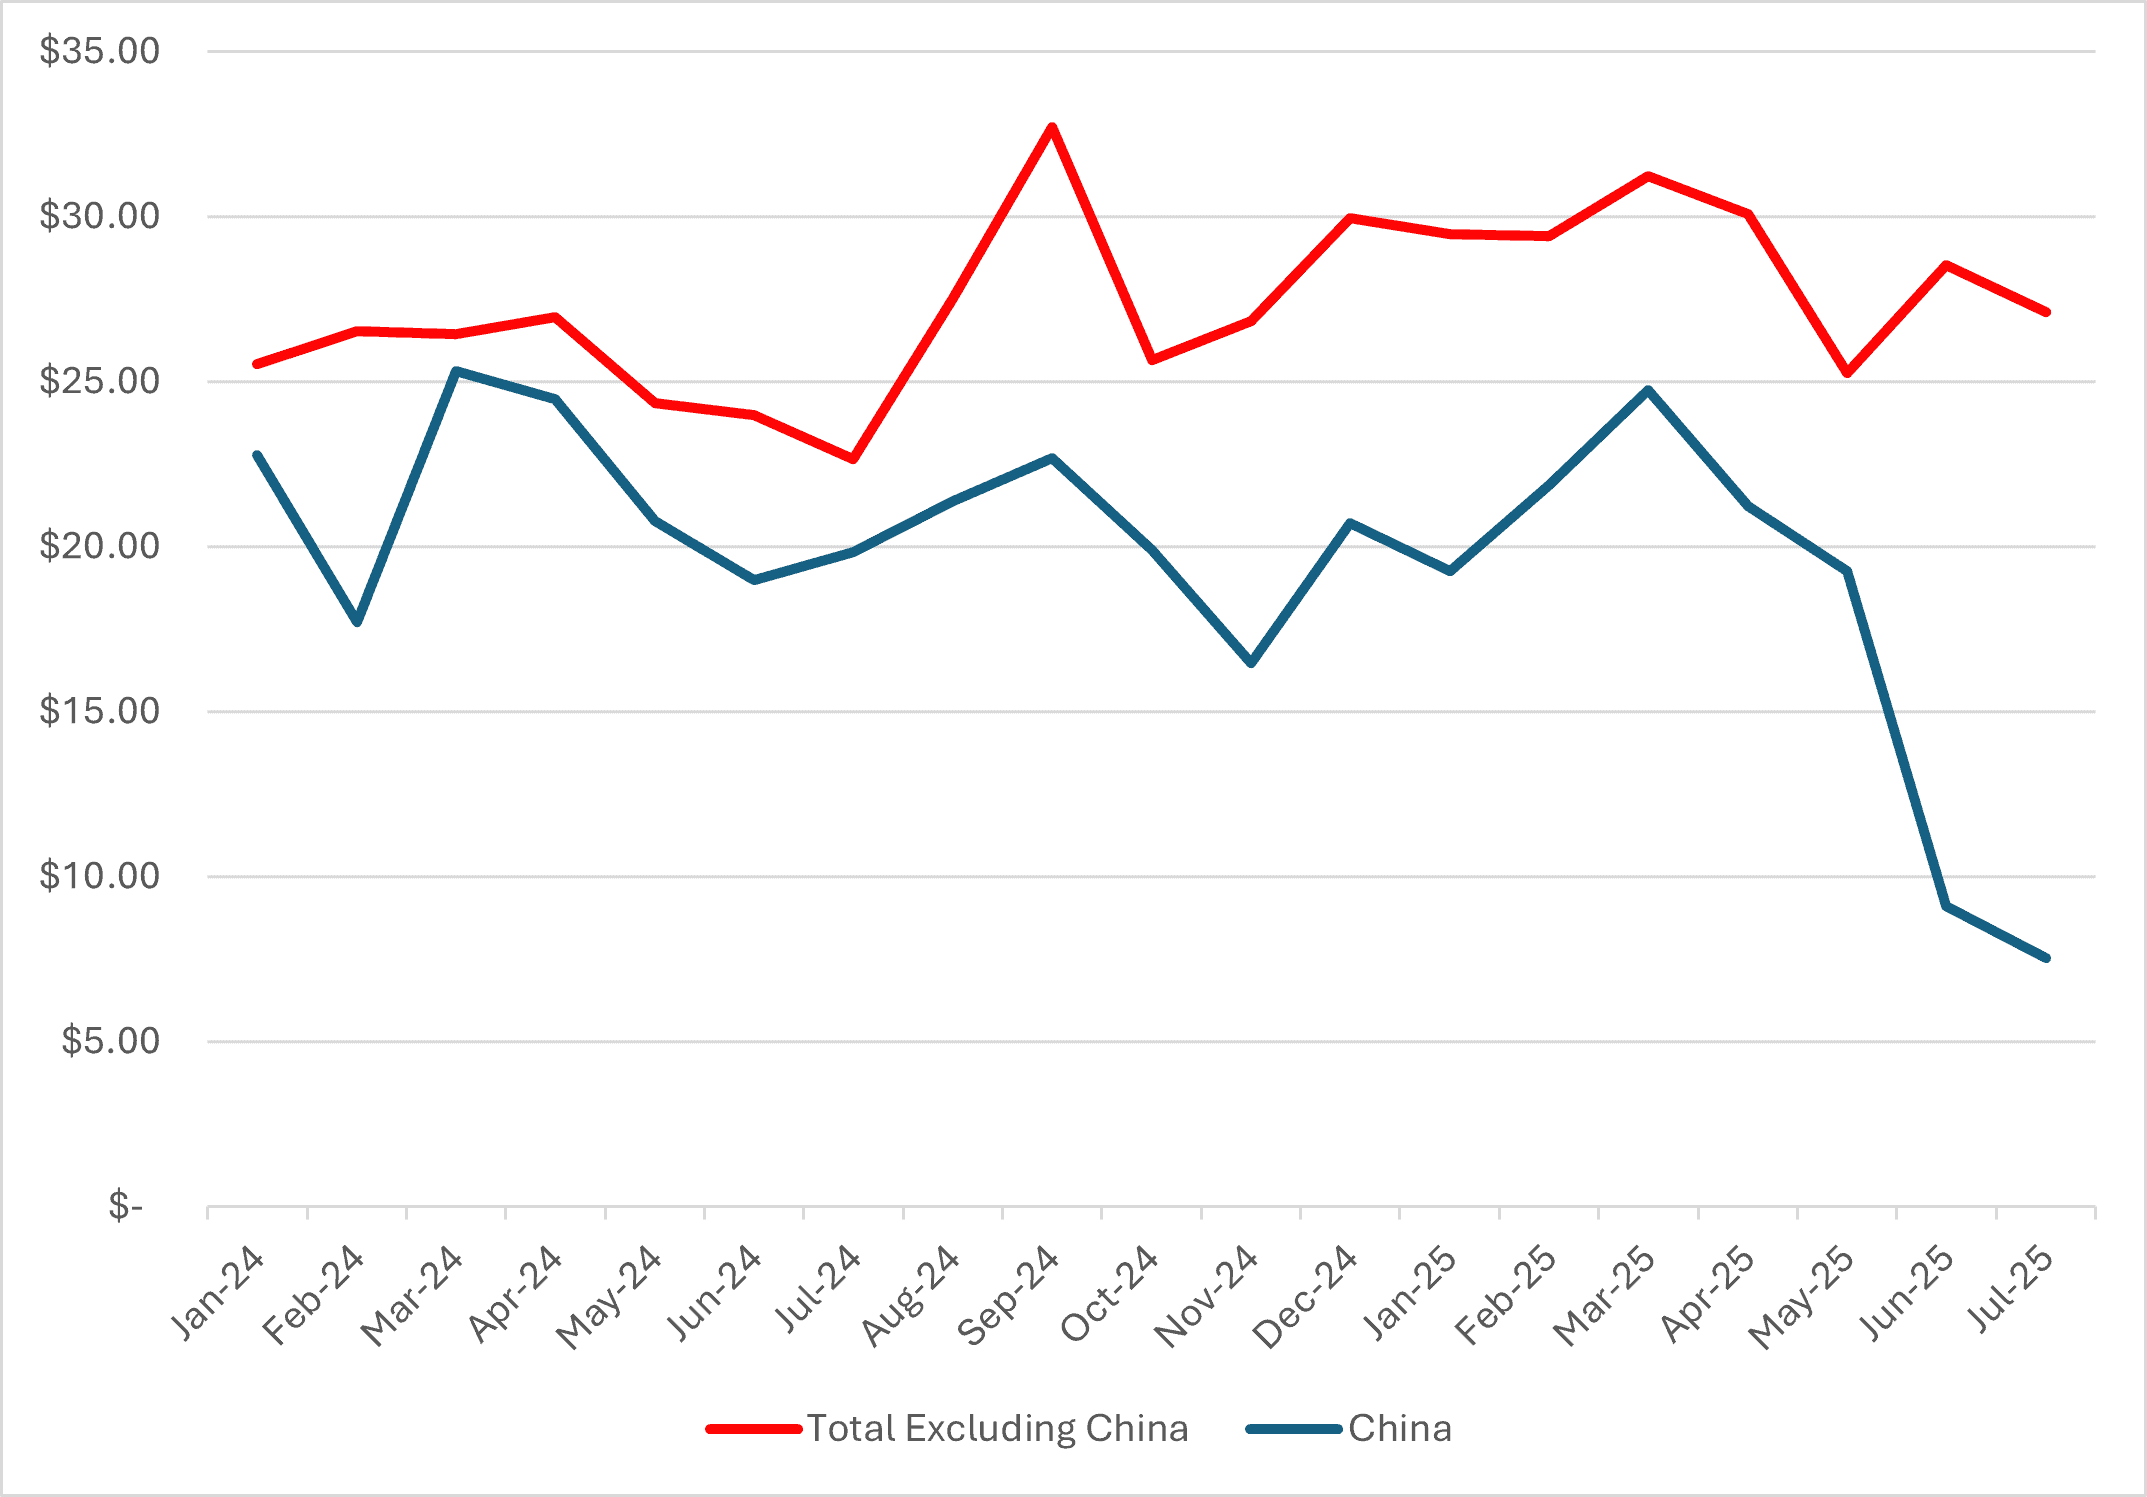
Source: Dataweb, The United States International Trade Commission
Figure 3: China Garbage Disposal Import Value and Imported Units
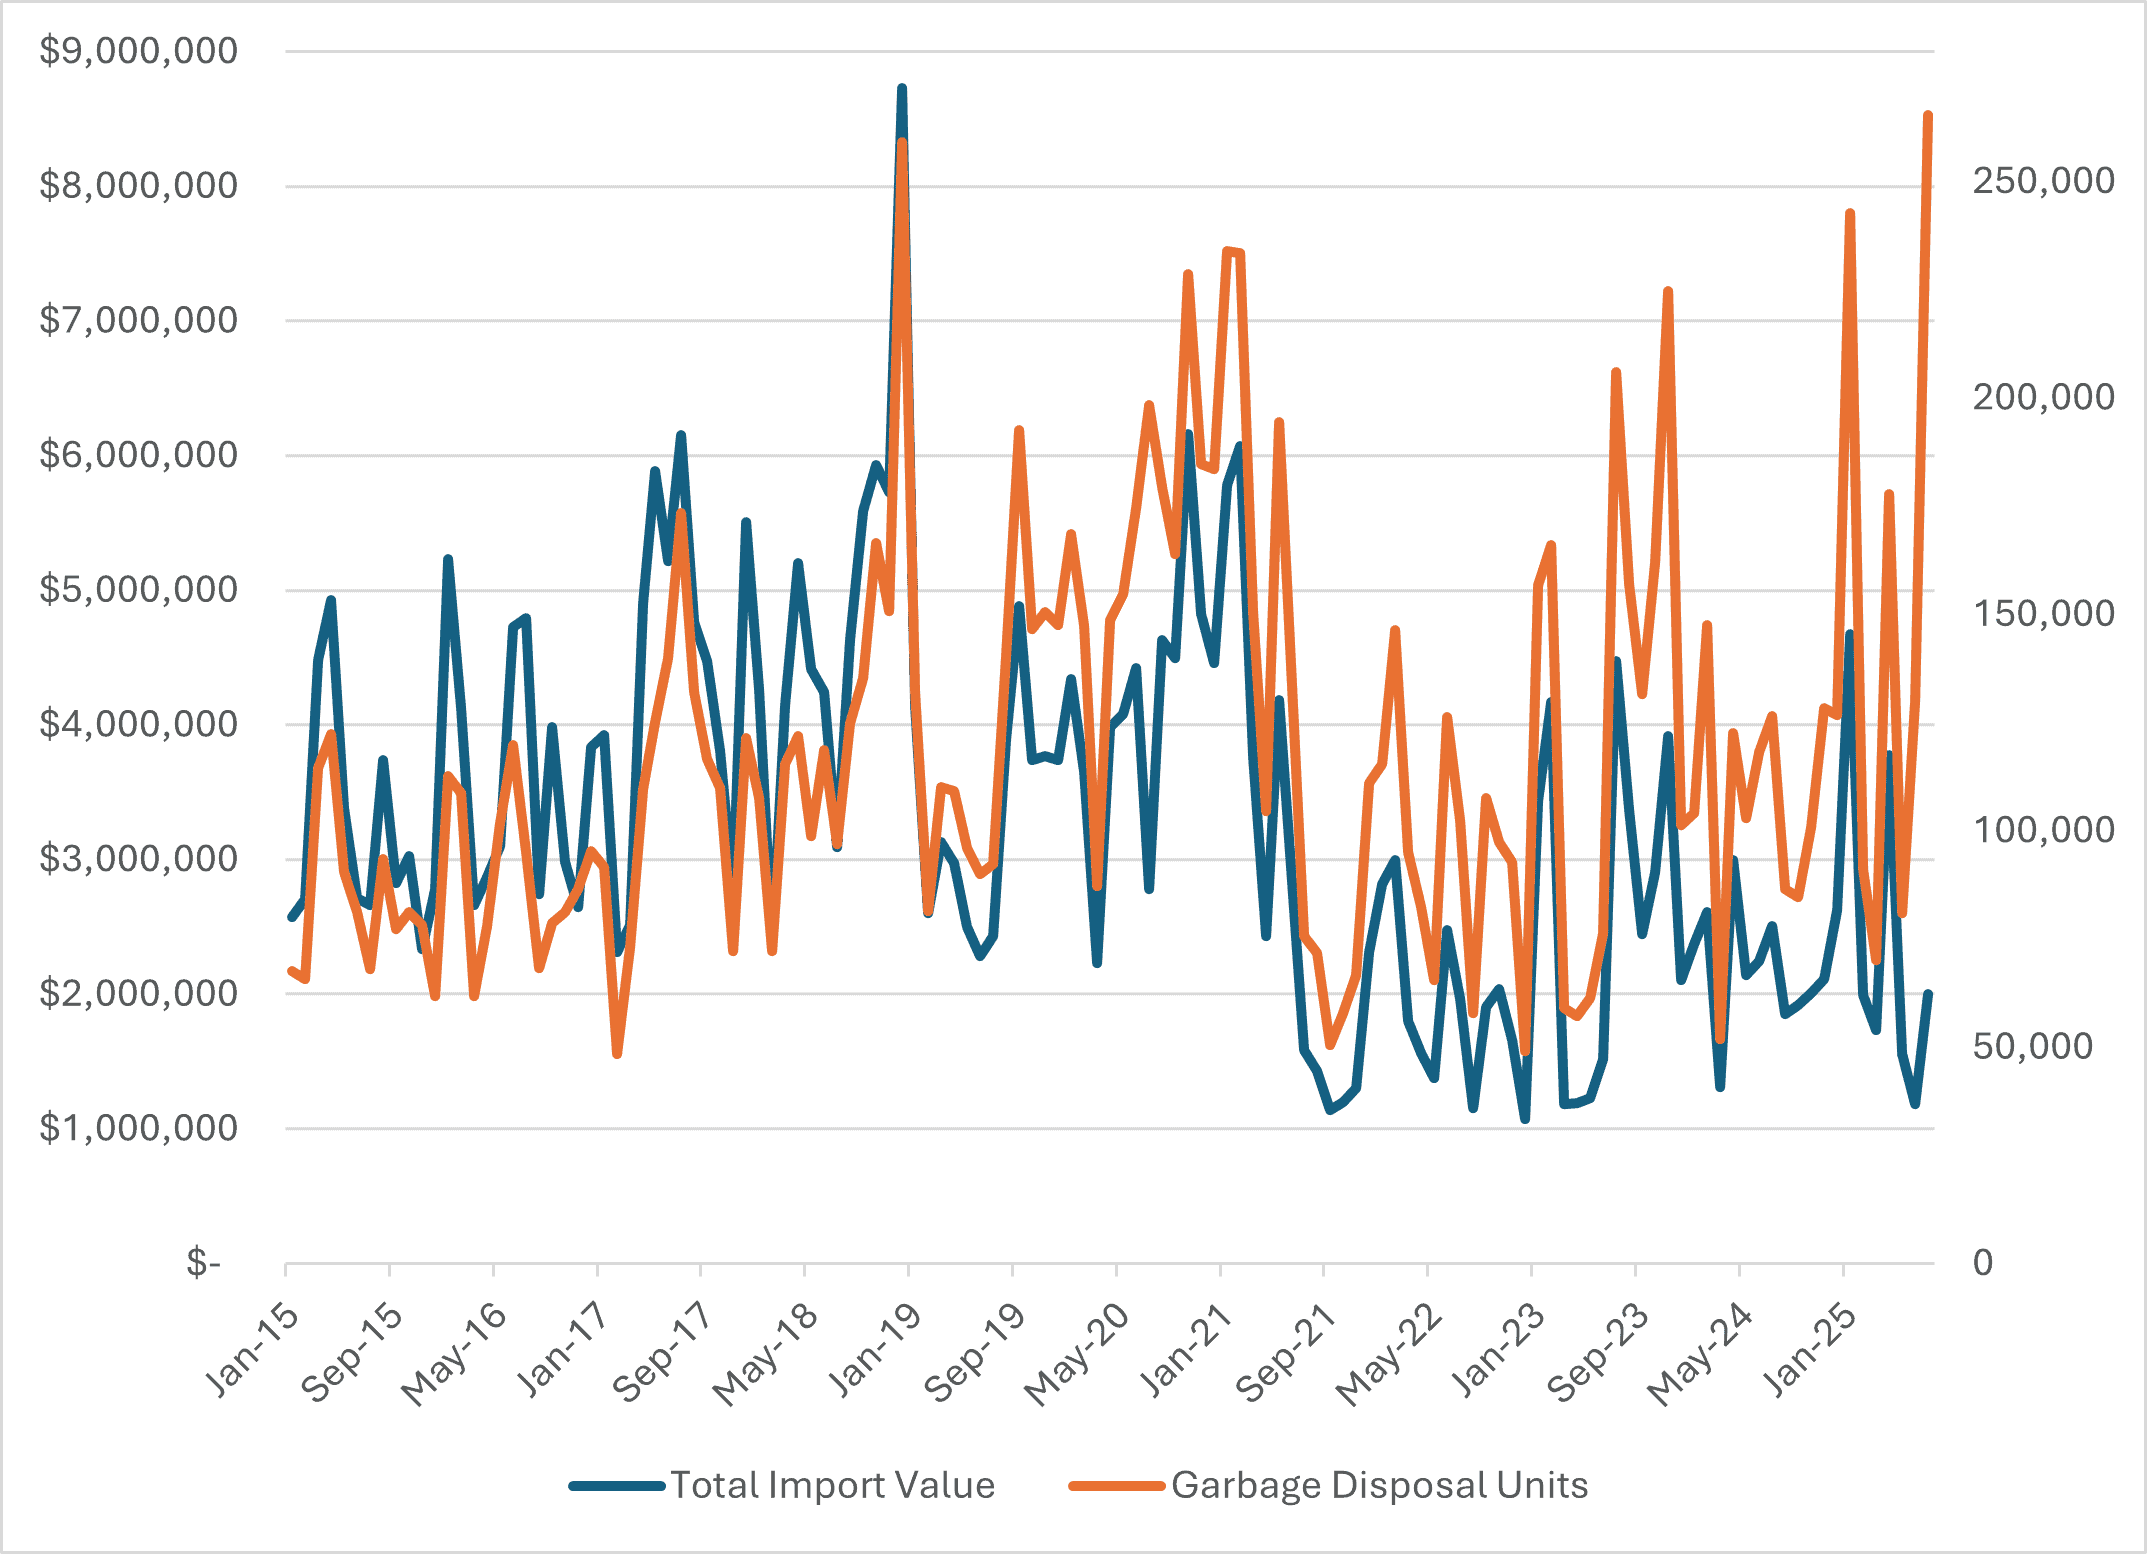
Source: Dataweb, The United States International Trade Commission
Given that only garbage disposals from China are experiencing this significant drop in per-unit import value, it is possible that importers are undervaluing their goods. The large spike in the total number of units imported could also suggest a “double counting” of imports; however, the quantity of imports is not unrealistic when looking at past data. The fact that this undervaluing and sudden surge in imported units is occurring solely in China also points to the fact that there is not a widespread data-entry issue for garbage disposals, as one would expect abnormalities across the board. The only possible explanation for a unique China data-entry issue is that imports from China face “Liberation Day” tariffs, steel tariffs, fentanyl-related tariffs, and Section 301 tariffs, while other countries from which the United States imports are subject primarily to two sets of tariffs.
Gas Range Imports
The specific gas range imports referenced in the WSJ article are a specific type of non-portable cooking stove for gas fuel (HTS 7321113020) coming from Thailand. In 2024, Thailand represented 24 percent of the total U.S. import value of gas ranges, with Mexico and South Korea being large trade partners as of 2025. Between January and May of 2025, the average value per unit from Thailand was $374.18 but has since fallen to $190.24 in June and $174.70 in July (Figure 4). While there has been a sharp drop off in the value per unit, the price of gas ranges from Thailand has been trending downward for well over a year, with every month of 2025 except for April experiencing a reduction in value per unit.
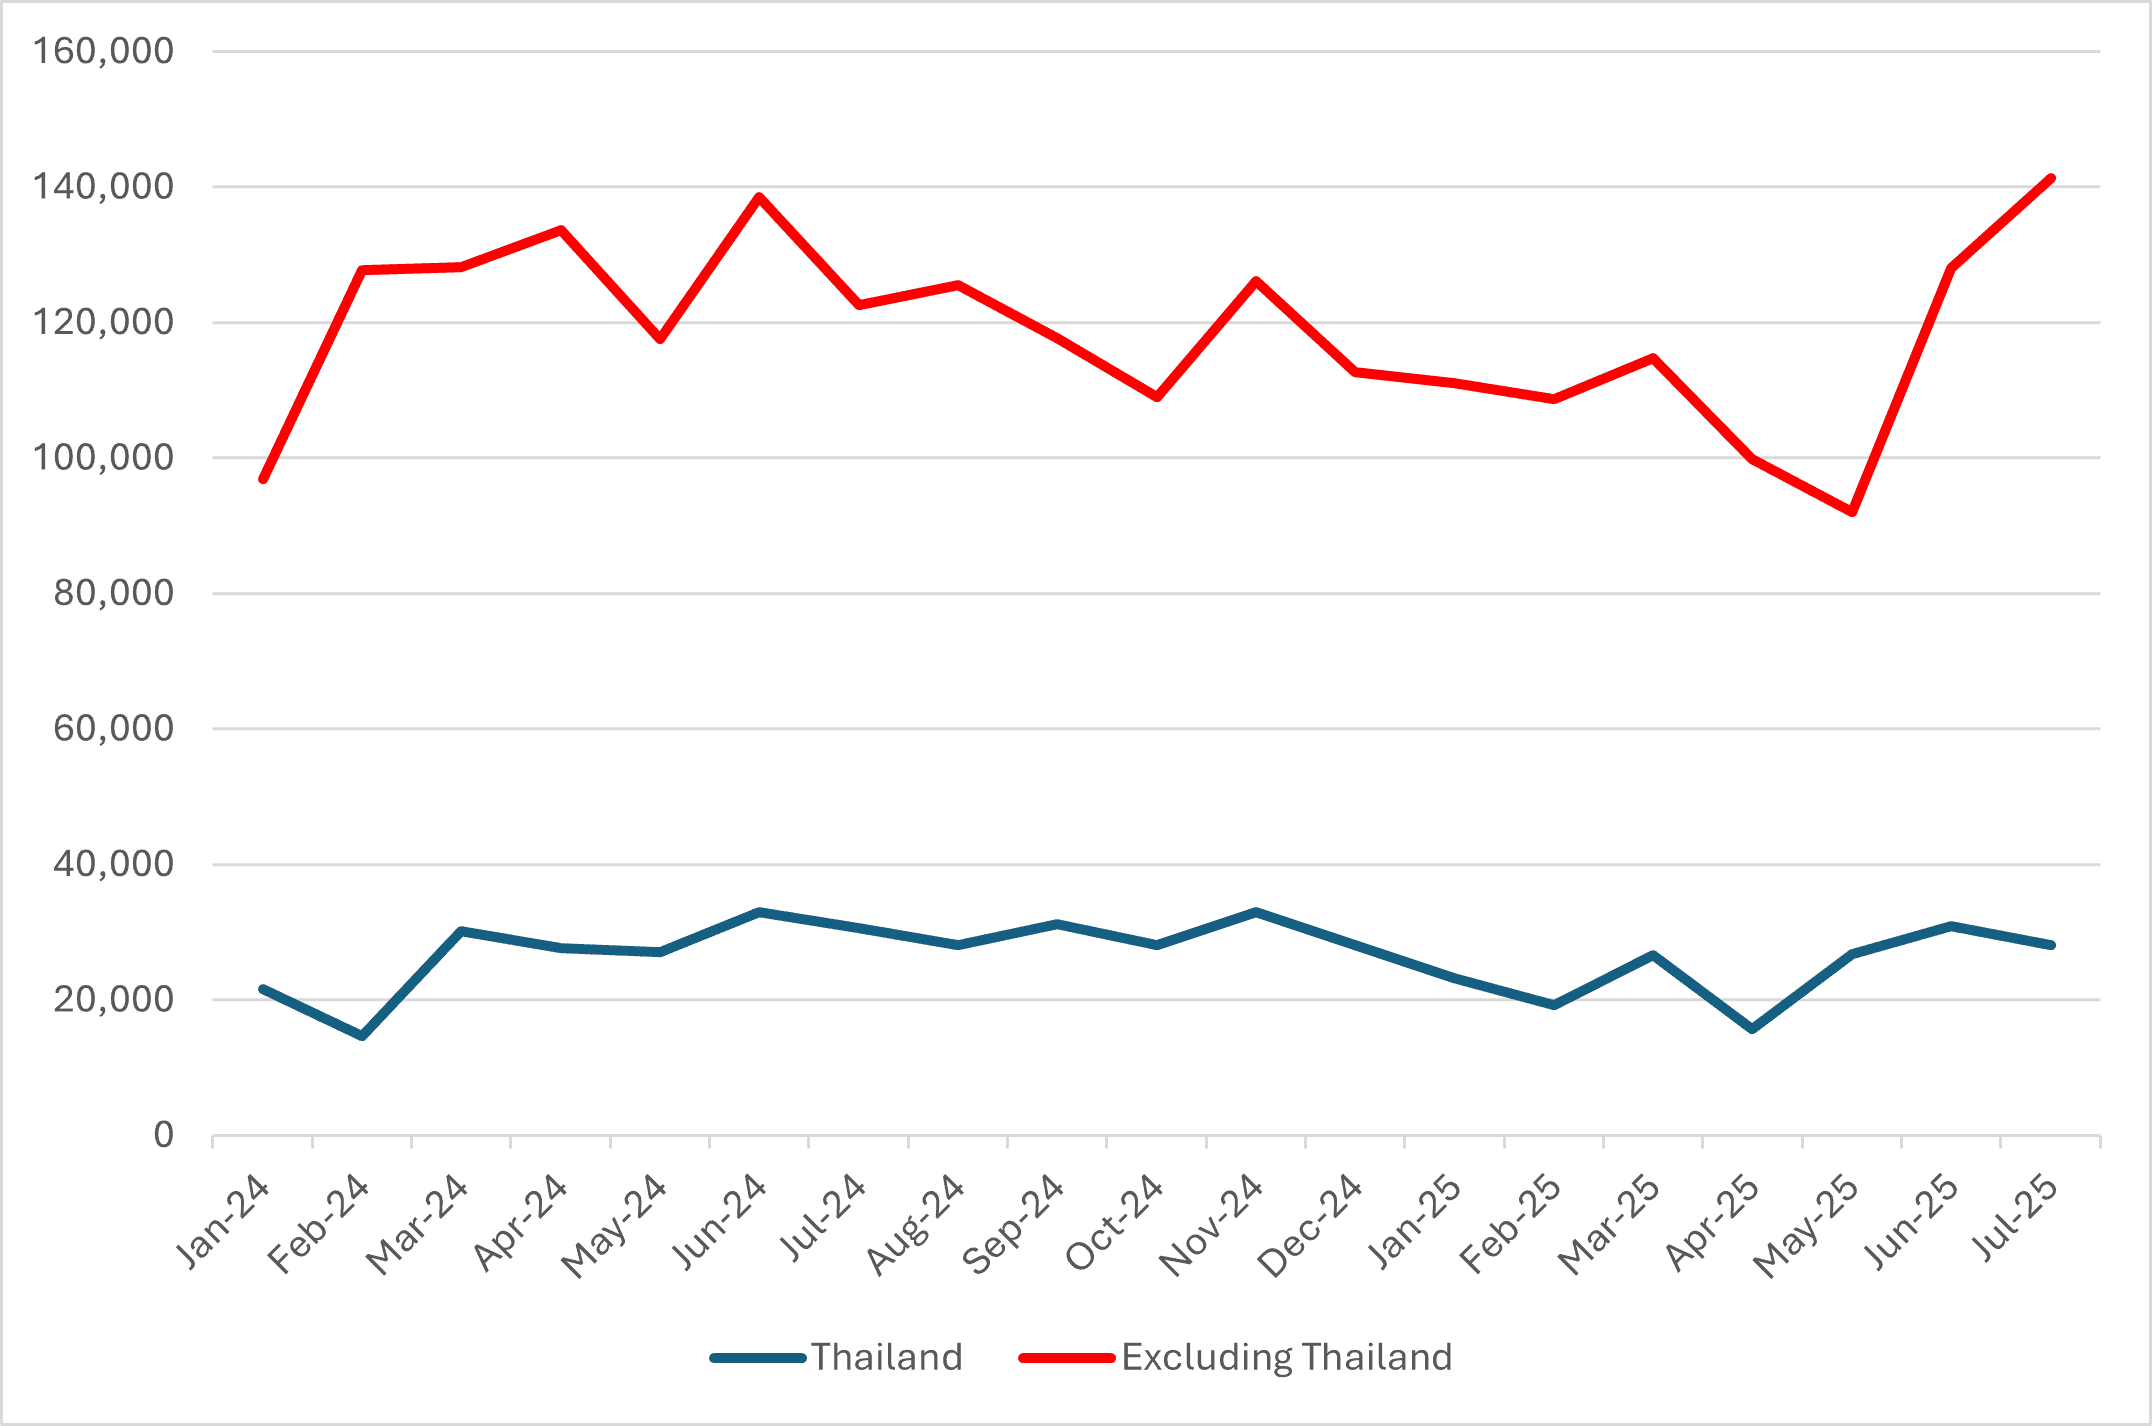
Excluding Thailand, the import value per gas range unit remained relatively constant throughout 2024 and most of 2025 but experienced a sudden drop between May and July. This general drop in unit value comes one month after gas ranges from Thailand began to experience a rapid value drop, as seen in Figure 4. The fall in unit value of Thai gas ranges is mainly due to a continuous drop in the total import value of gas ranges rather than an abnormal surge in the total number of imported units (Figure 5). Total imports from Thailand saw a 70-percent year-over-year decline in July but only an 8-percent drop in total imported units. By contrast, the decline in unit value for other countries was driven primarily by a noticeable uptick in the total number of units imported. For instance, there was a large spike in the number of units reportedly imported from China and Mexico, while the total import value stayed constant or fell.
Figure 4: Per-unit Value of Imported Gas Ranges

Source: Dataweb, The United States International Trade Commission
Figure 5: Thailand Gas Range Import Value and Imported Units
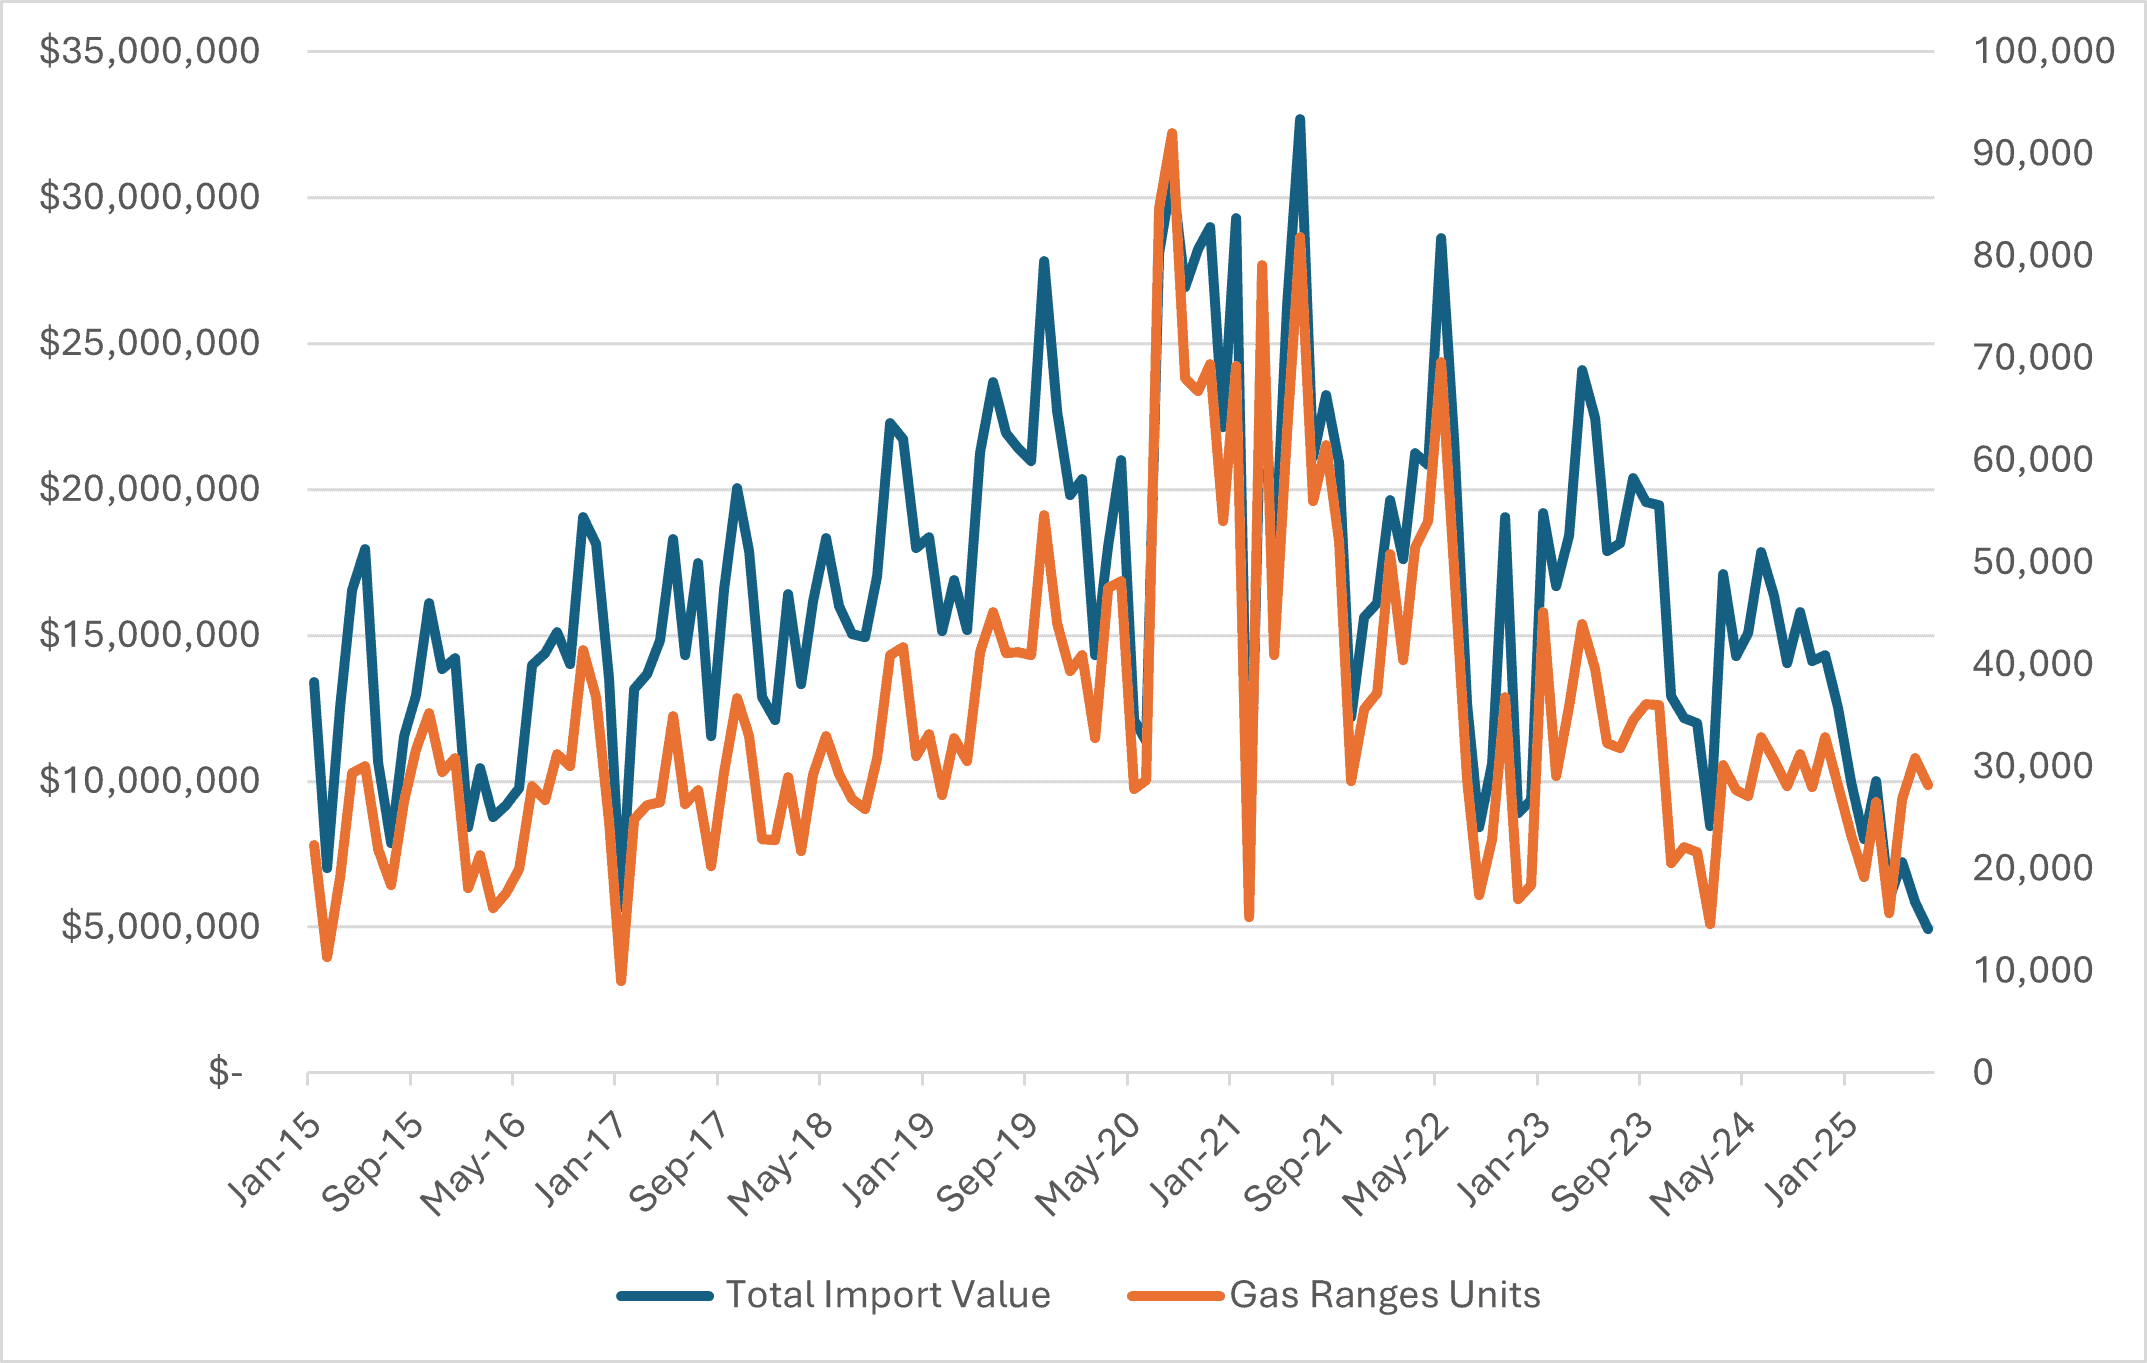
Source: Dataweb, The United States International Trade Commission
In the case of Thai gas ranges, it is unclear whether the drop in unit value is due to evasion, a data-entry issue, or a general fall in the price of this appliance. Singling out imports from Thailand, however, leaves out important details. Unit prices across the board fell – particularly for China and Mexico – driven by an increase in the number of imported units while the total import value stayed constant or fell. If tariff evasion is taking place, it is not unique to gas ranges from Thailand. If there is “double counting” going on, then gas ranges from China and Mexico deserve to be looked at more closely.
Washing Machine Imports
The specific washing machine imports referenced in the WSJ article are those with dry-linen capacity exceeding 10 kilograms (HTS 8450200080) from South Korea, which can be household or commercial washers. In 2024, South Korea made up 29 percent of the U.S. import value of washing machines. Other major trade partners included Mexico, Vietnam, and China. Between January and May of 2025, the average value per unit from South Korea was $838.62 and has since fallen to $196.89 in June and $73.45 in July (Figure 6).
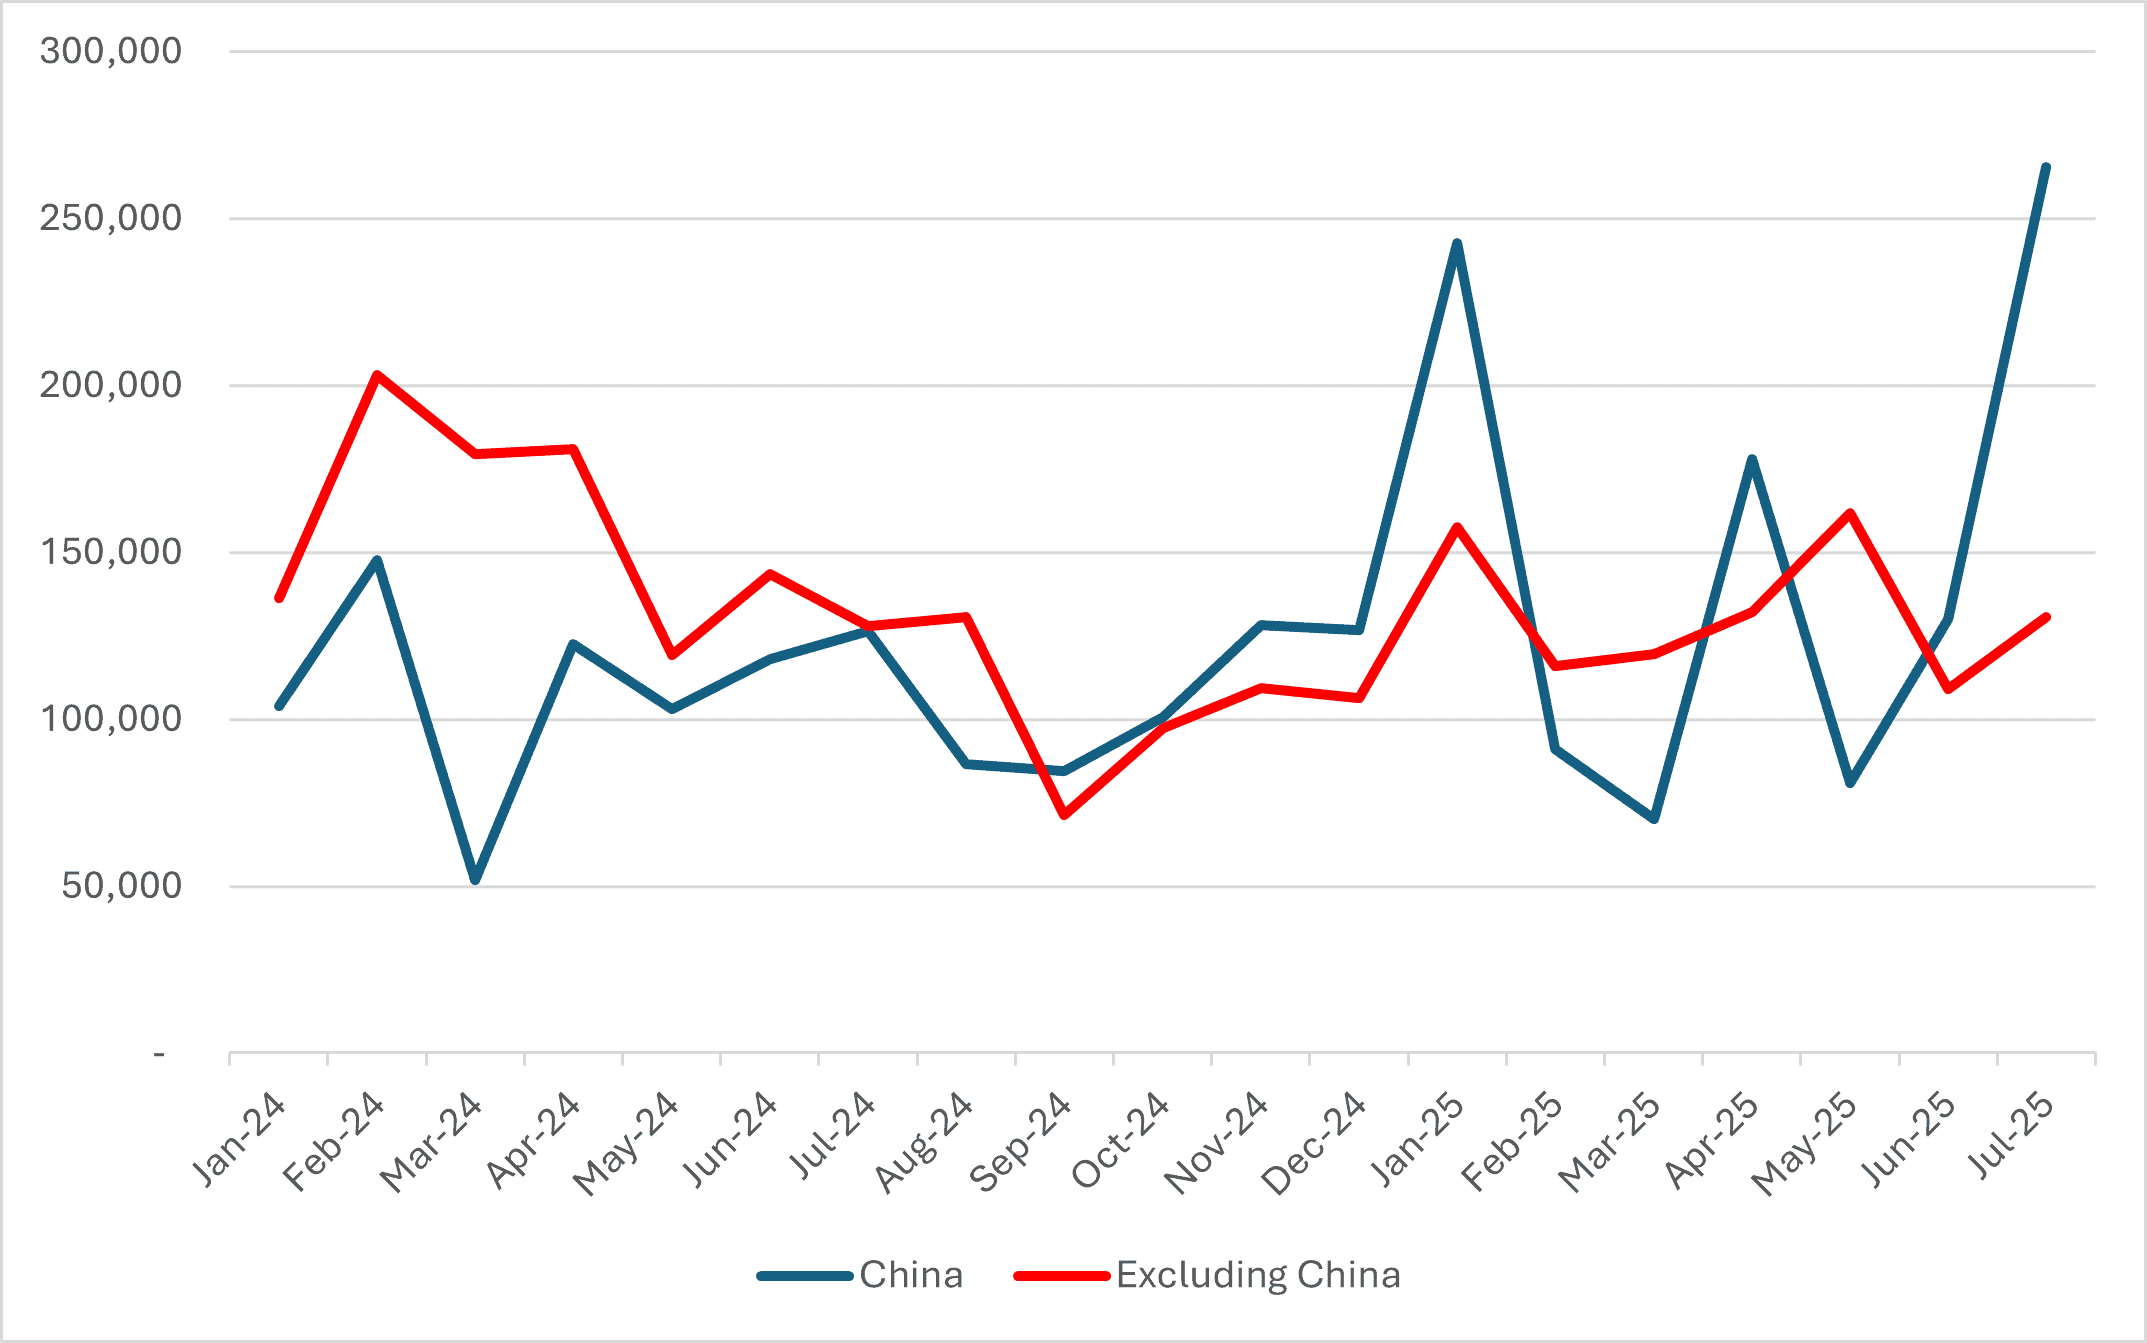
The data show an unprecedented surge in total units imported, which spiked from an average of 28,100 monthly units between January and May to 124,000 in June and 271,000 in July (Figure 7). The reported monthly import value, however, stayed relatively stable as the average was $23.5 million in the first part of the year, $24.4 million in June, and $19.9 million in July. This indicates that the primary reason the value per unit fell is because total units imported skyrocketed rather than total import value decreasing.
Figure 6: Per-unit Value of Imported Washing Machines
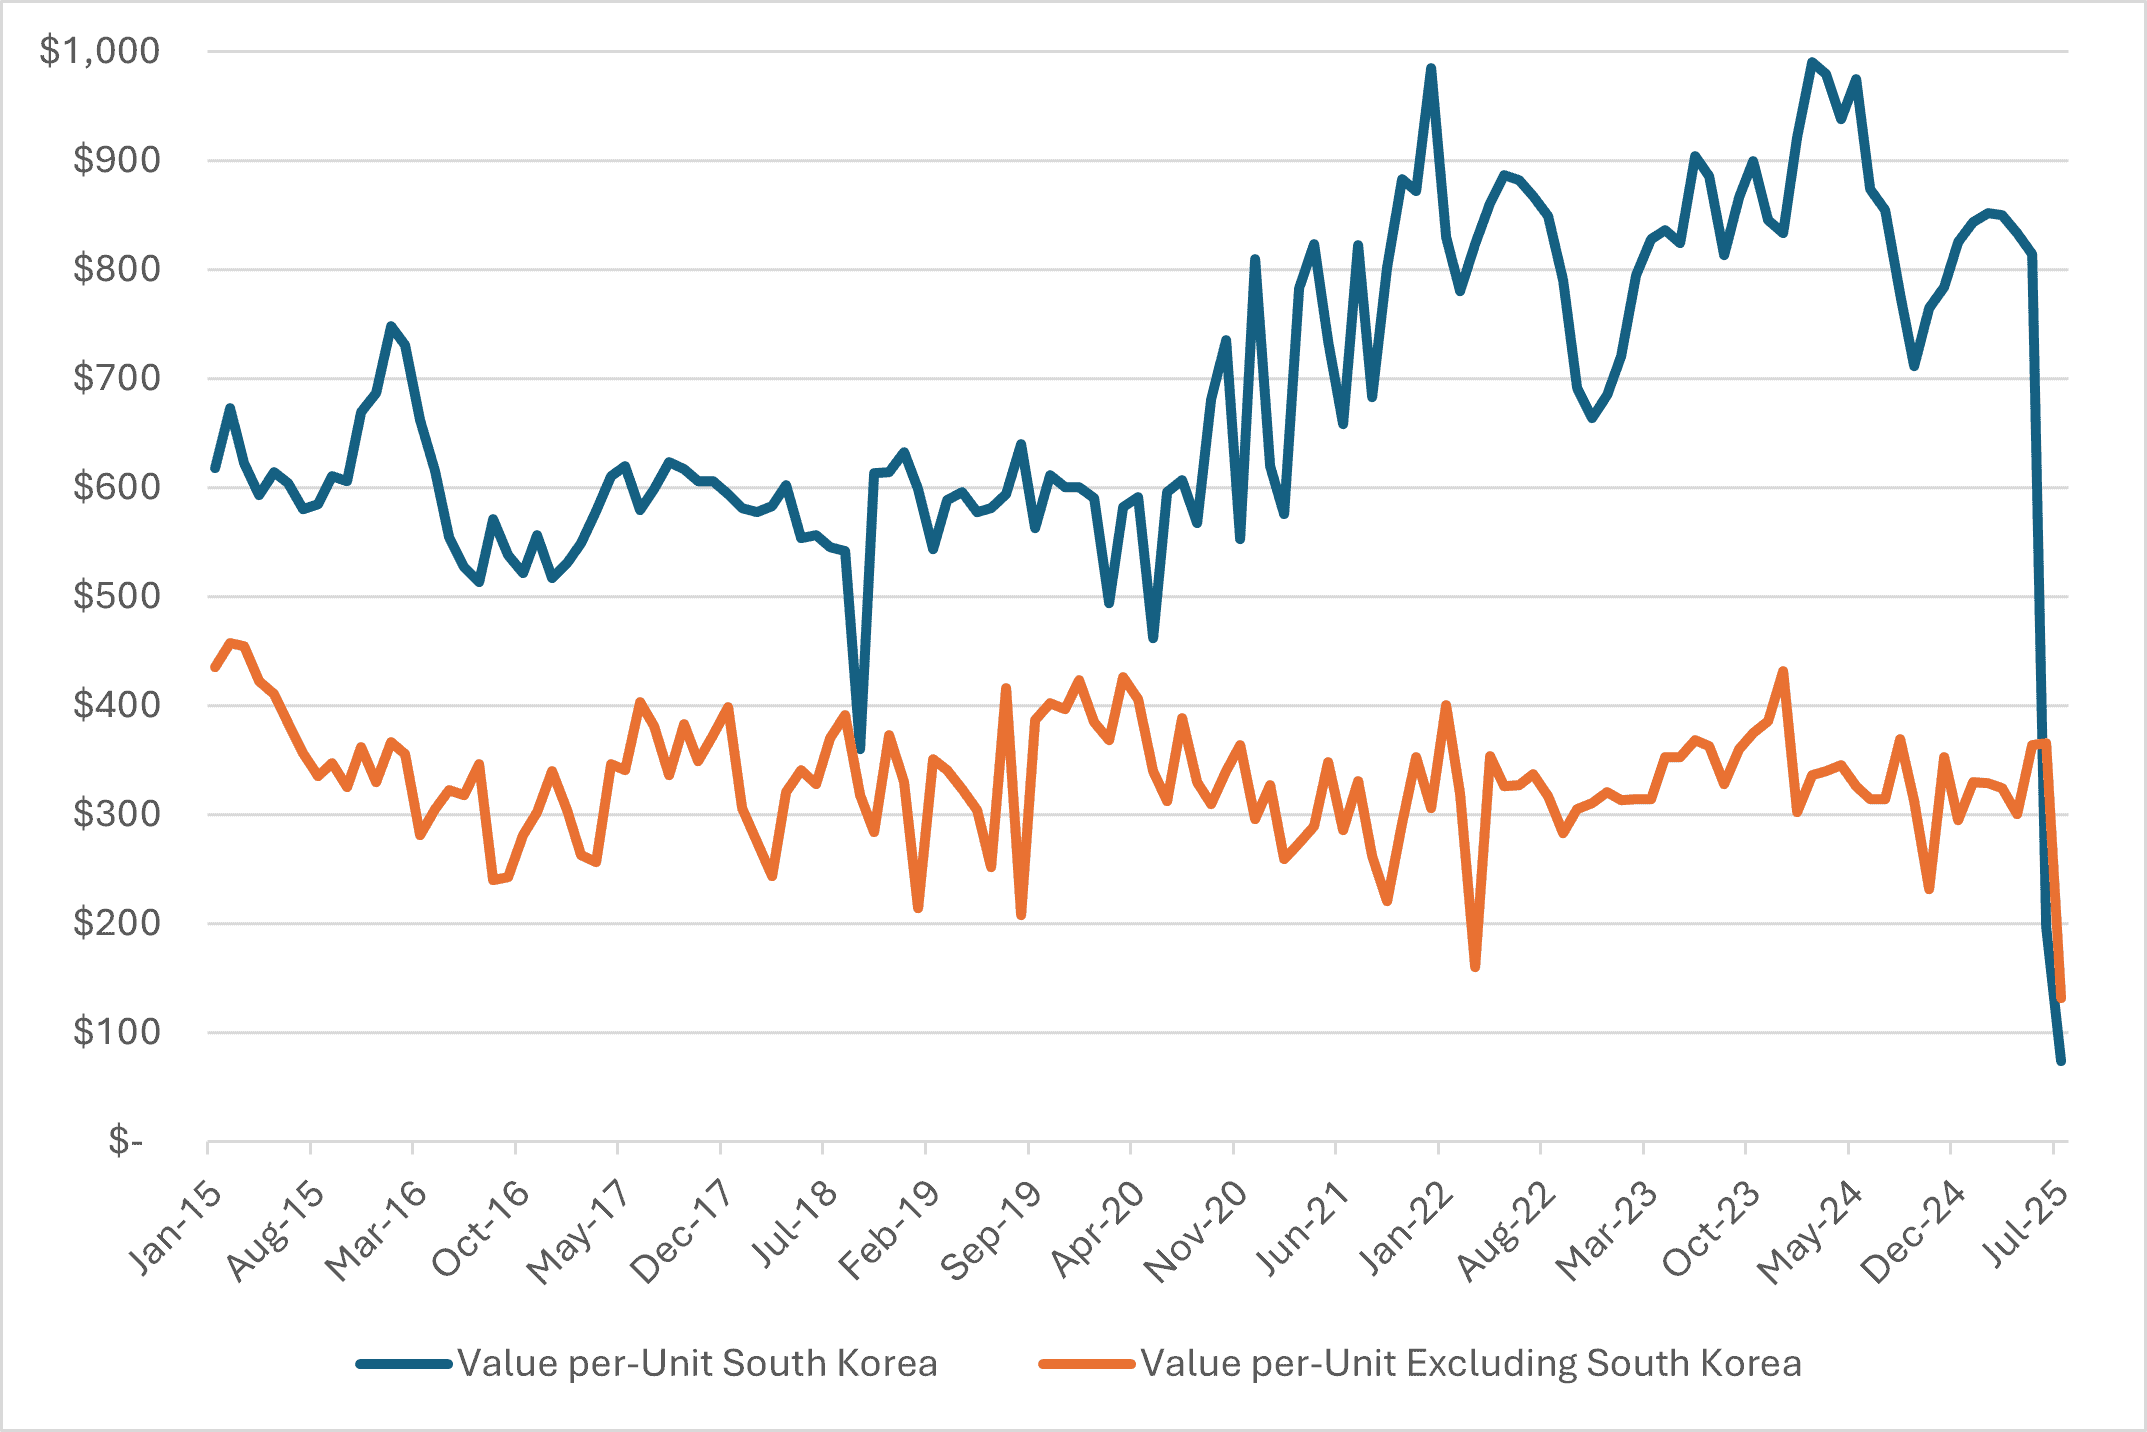
Source: Dataweb, The United States International Trade Commission
An additional fact worth noting is that the drop in per-unit value occurred not only in washing machines from South Korea but from nearly every country the United States imported these products. As an example, the per-unit value of front-load washing machines from Canada fell from an average of $31,000 between January and May to $1,128 in July, a 96-percent drop. The reason the unit value was high to begin with is likely due to washing machine imports from Canada being primarily commercial washing machines rather than cheaper household washers, both of which are included in the same product code, according to DataWeb. Furthermore, the value per unit of washing machines from Vietnam dropped 56 percent between June and July. There was a 65-percent drop in unit value from Mexico during the same period.
Figure 7: South Korea Import Value and Imported Units

Source: Dataweb, The United States International Trade Commission
There are two possibilities that might explain the large-scale unit value drop. The first option is that companies importing from South Korea purchased 600 percent more washing machine units in July 2025 compared to July 2024, and at the same time undervalued those goods. This is also an 860-percent increase in imported units compared to the first part of 2025, an impractical surge detached from consumer demand and exceeding past tariff-frontloading. The increased storage capacity and costs alone would significantly counteract tariff cost savings. The second option is that there is a data-entry issue that resulted in an overcounting of the number of imported washing machines. This would artificially lower the calculated per-unit value and may result from the overlap of “Liberation Day” tariffs, steel tariffs, and historical tariffs on appliances, creating a confusing environment in which businesses are filling out multiple forms for separate tariffs. Regardless of which possibility is correct, washing machines from South Korea should not be singled out for a major decline in the import value per unit; this is happening in other countries as well.
Looking at Other Appliances
Despite examples of per-unit import value drops outside of South Korean washing machines and Thai gas ranges, Whirlpool has not claimed tariff fraud and the WSJ article did not mention these cases. To further broaden the scope of examined products and perhaps shed more light on whether this is an appliance-wide trend, this research looks at refrigerators, dryers, and dishwashers.
After examining 14 separate refrigerator HTS codes, it is clear that there was an across-the-board drop in unit values, with most cases experiencing a substantial increase in the total number of imported units without a commensurate increase in total import value. Looking specifically at a French door refrigerator/freezer combo (HTS 8418100055), July saw a 38-percent year-over-year increase in the number of imported units but a 20-percent decline in total import value. Similarly, there was a 54-percent increase in the number of imported refrigerators in July compared to the average between January and May. At the same time, there was a 7-percent drop in the total import value. Imported units from Mexico saw a large increase, but even excluding Mexico, the story remains the same.
Figure 8: Refrigerator Total Import Value and Imported Units
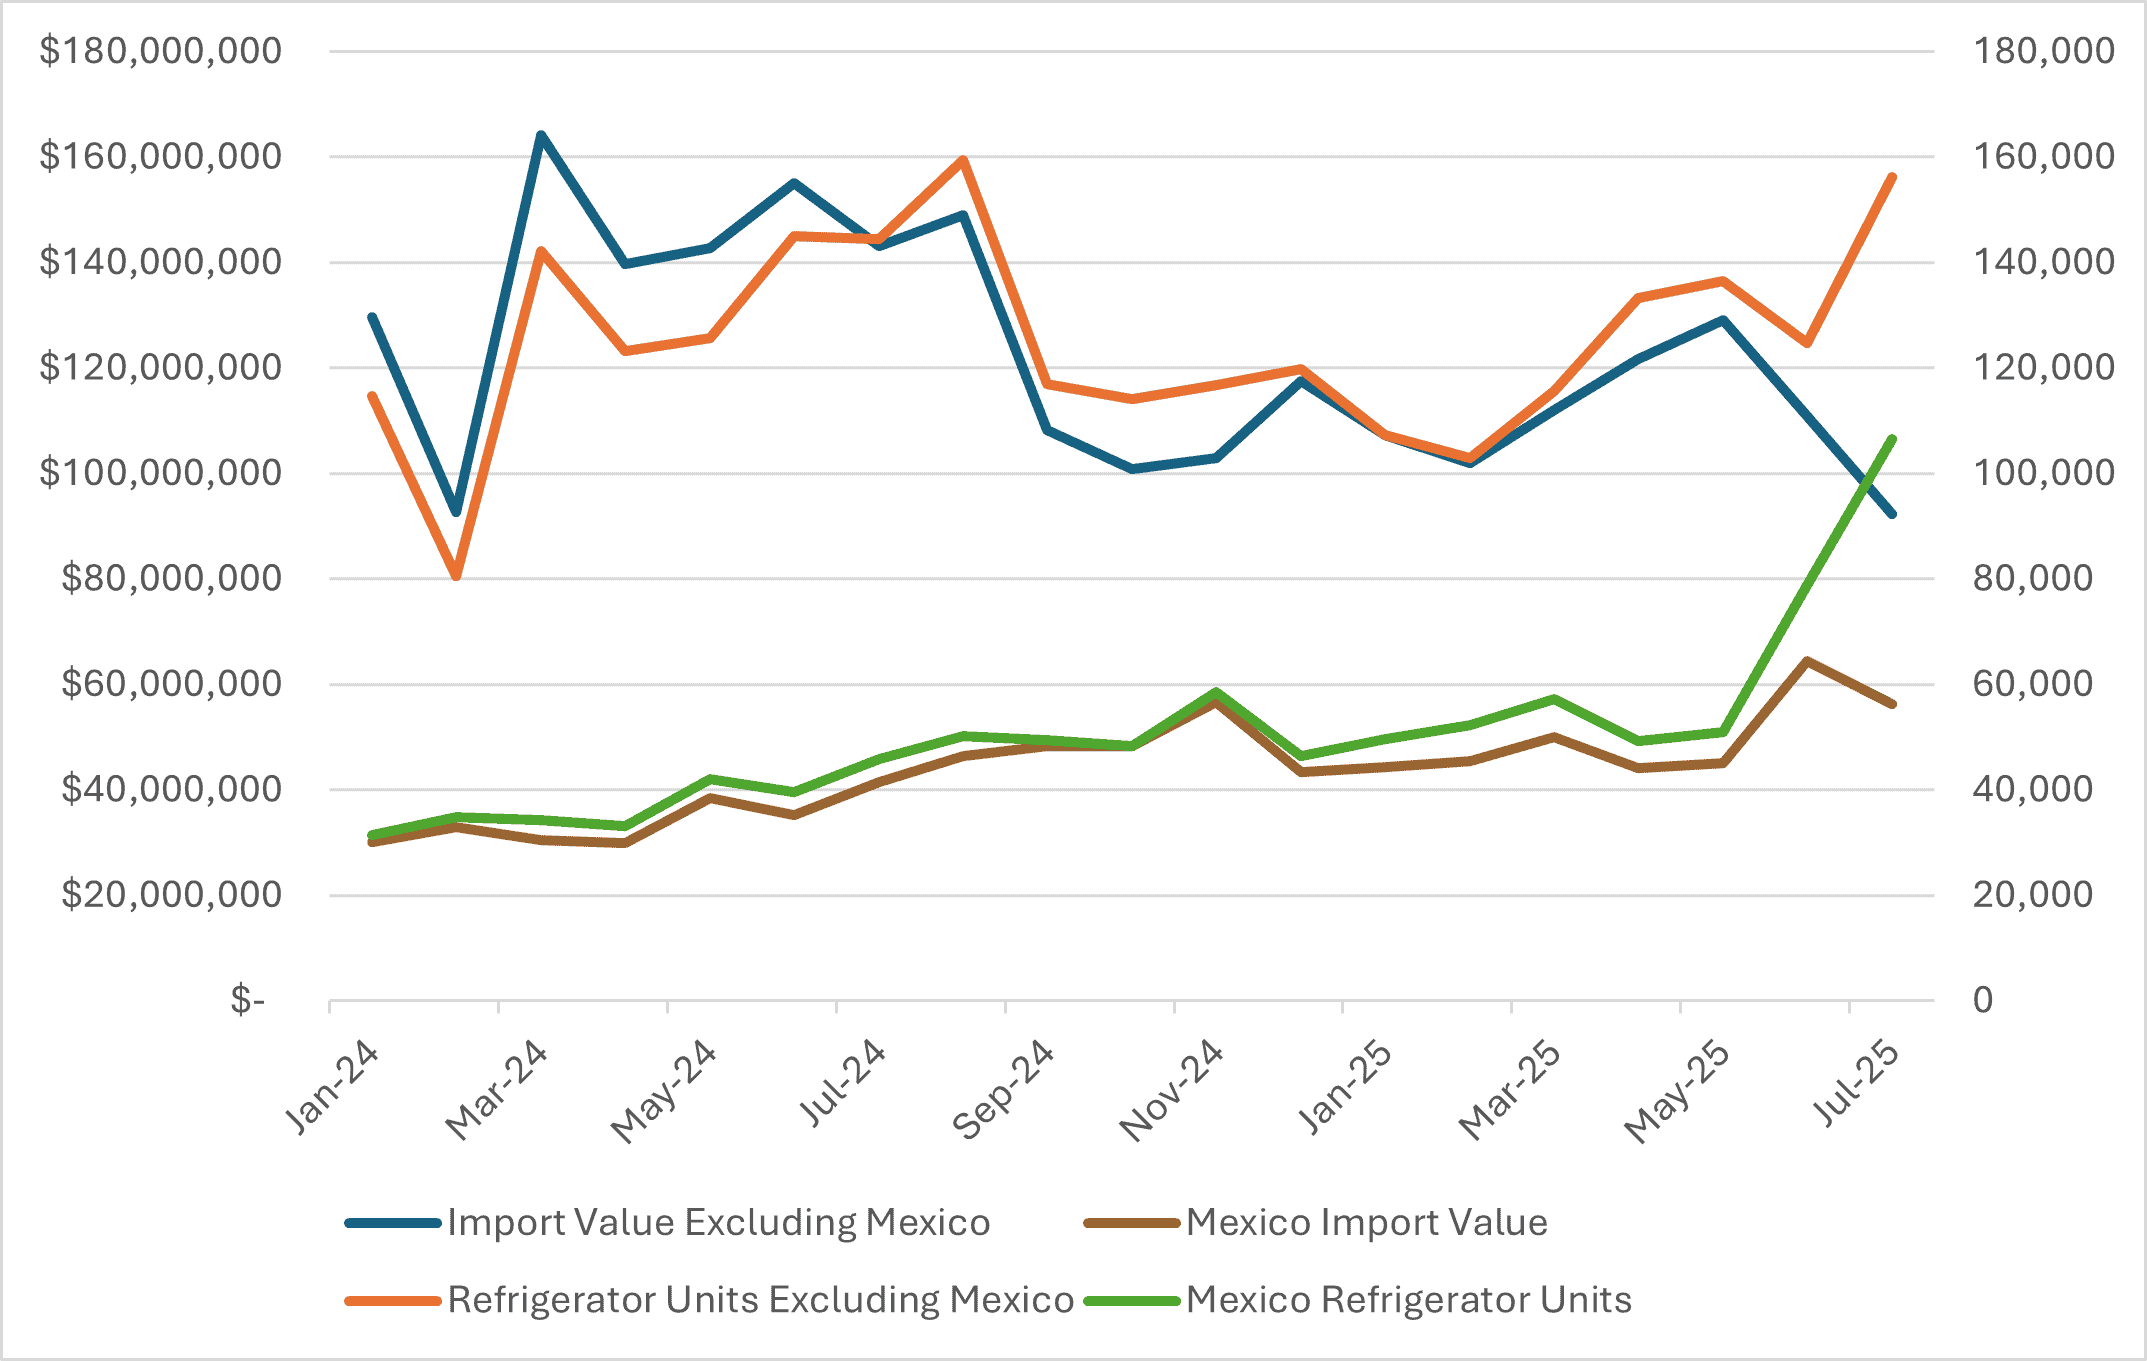
Source: Dataweb, The United States International Trade Commission
The import value per unit for certain dryers (HTS 8421190000) increased throughout 2025. In January, the unit value was $77.50 and shot up to $406.17 in July due to a large increase in the total import value and a continued decrease in the total number of units. Dryers from France and China experienced an increase in the import value per unit while dryers from Switzerland and South Korea plummeted in unit value. Indeed, the unit value from France ballooned by almost 5,000 percent in July compared to the January-through-May average, with China’s unit value increasing by 125 percent during the same period. Meanwhile, there was a 78-percent drop in Switzerland’s unit value and a 97-percent drop in South Korea’s unit value. A likely explanation for these drastic declines is that expensive commercial dryers were imported less while cheaper household dryers were imported more, lowering the calculated unit price.
Figure 9: Dryers Total Import Value and Imported Units
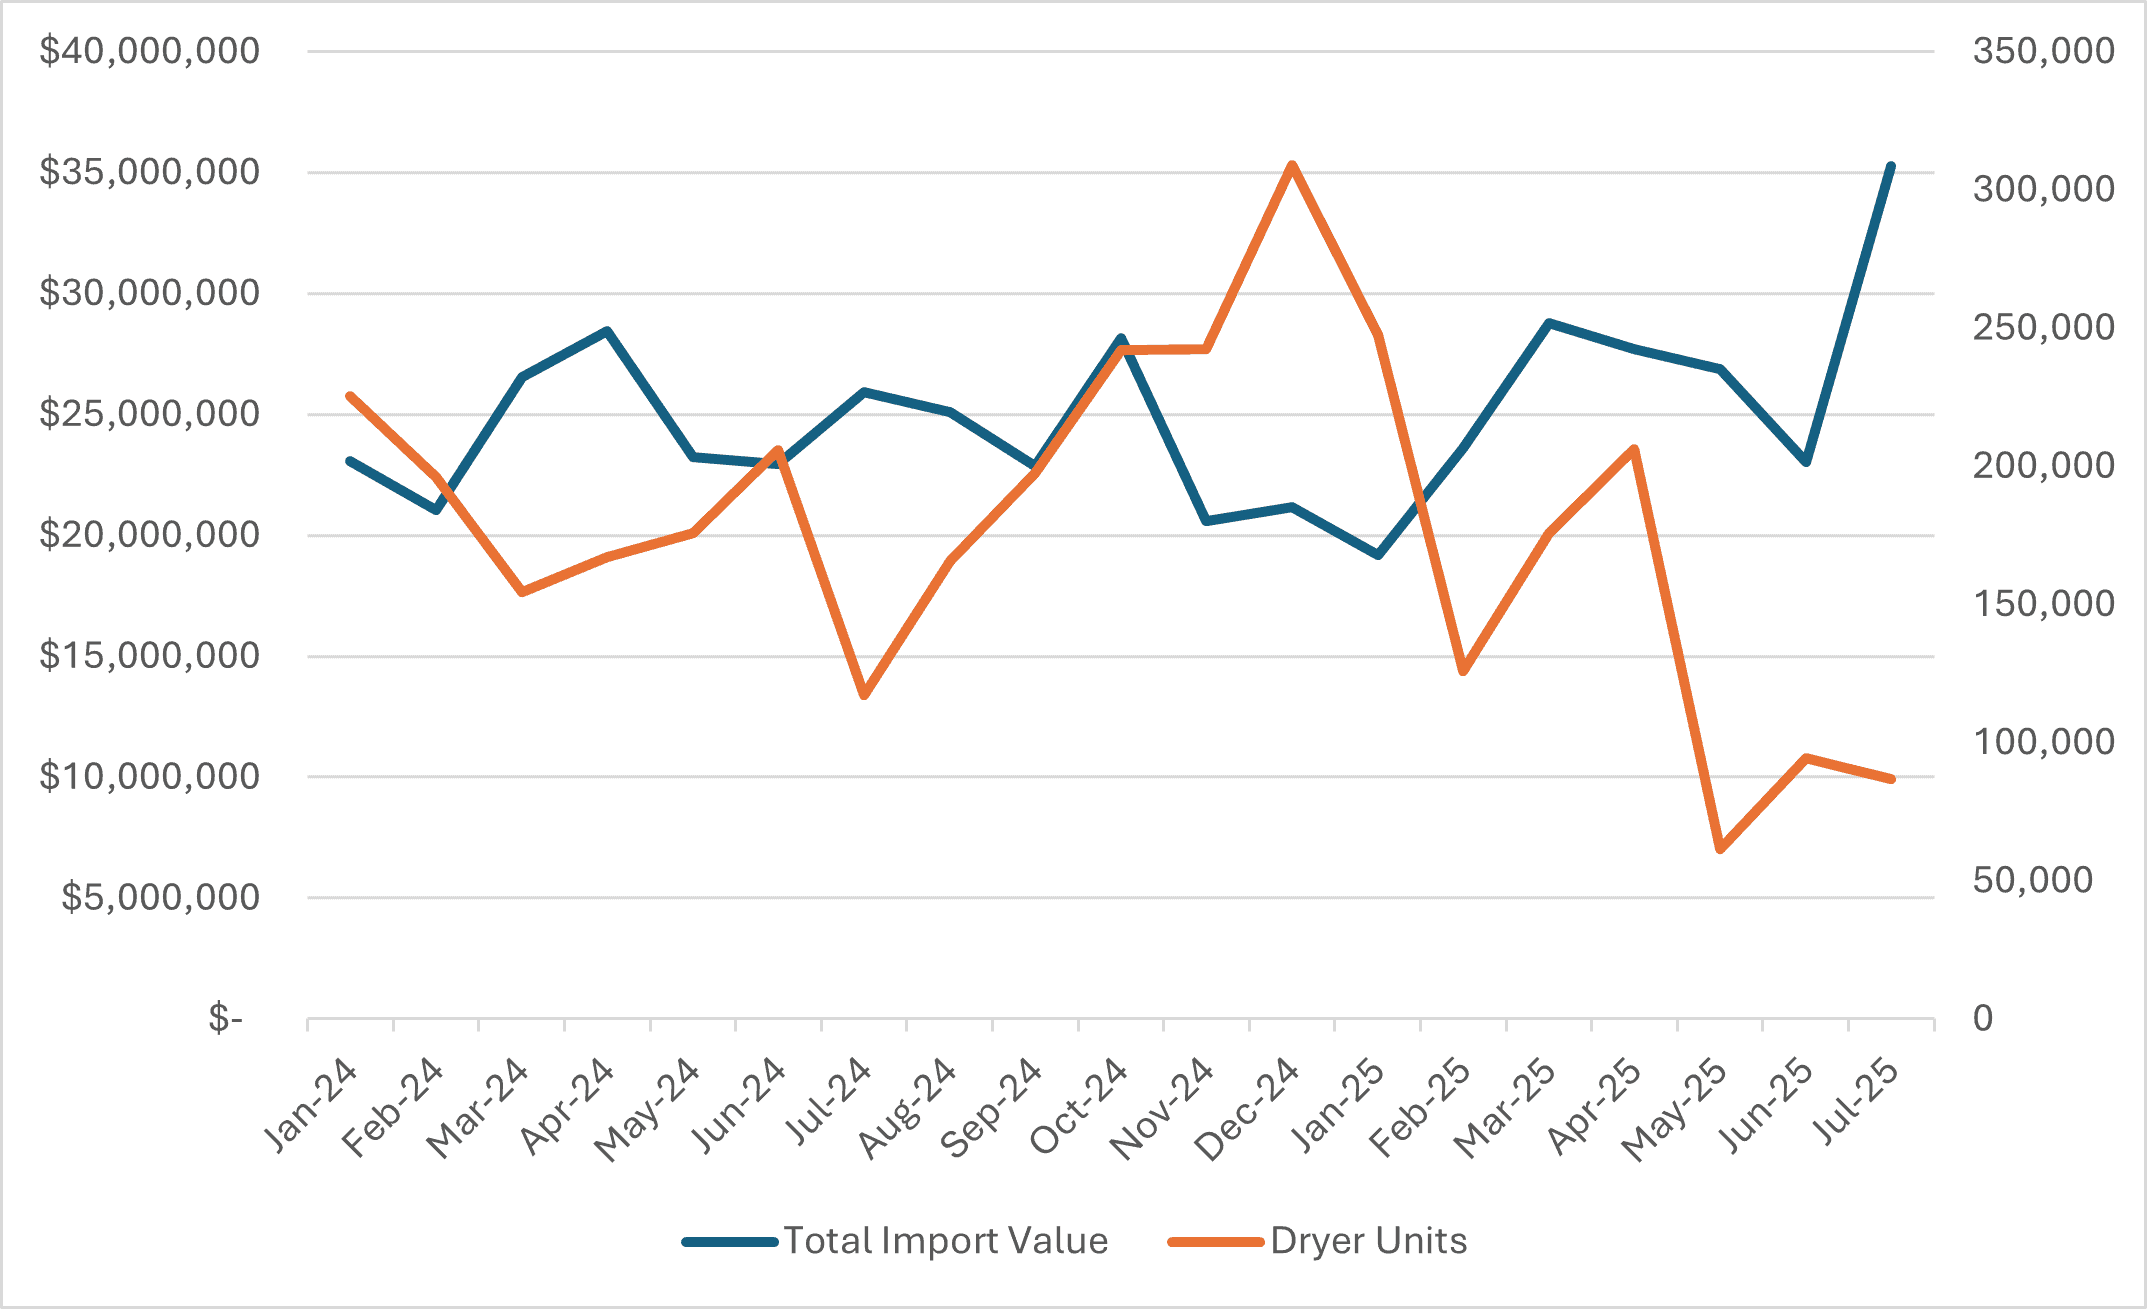
Source: Dataweb, The United States International Trade Commission
Dishwashers – both household and otherwise – (HTS 8422110000, 8422190000) show mixed results. Household dishwashers remained relatively stable in terms of the import value per unit, increasing slightly in July compared to January but decreasing slightly compared to the average unit value between January and May. Non-household dishwasher unit values increased in July by nearly 40 percent compared to the January-through-May average.
Conclusion
The import data for garbage disposals, gas ranges, and washing machines suggest that there may be tariff evasion, data-entry issues, or a combination of both taking place. Of particular note is that the data anomalies are not unique to the countries and products highlighted by Whirlpool and the WSJ, pointing to a more widespread tariff evasion or data collection concern that deserves further attention. Each product and country should be treated on a case-by-case basis that not only examines if the unit price is undervalued but what is causing the unit price to decline and if it is unique to one company. A significant surge in total imported units may suggest a data collection problem while an unusual drop in total import value may point to tariff evasion. In either case, policymakers should carefully study the issue to determine the best course of action and ensure accurate data reporting.
Appendix
What Is Tariff Evasion?
Tariff evasion, or customs fraud, is the act of intentionally circumventing tariffs. There are numerous ways this can be achieved for imported goods, but there are three main categories: undervaluing, misclassifying, and transshipping.
Undervaluing Imported Goods: This involves submitting a lower value at a point of entry in order to obtain a smaller tariff cost. Since many tariffs are calculated as a percentage of a product’s import value, a smaller declared value will result in a smaller tariff paid by an importer. It is important not to confuse foreign manufacturers undervaluing goods to reduce tariff costs with foreign manufactures “eating” tariff costs by lowering their prices. “Eating” a tariff involves either splitting the costs with a U.S. counterpart or absorbing part of the added costs themselves to reduce the price increase for customers.
Misclassifying Imported Goods: This involves categorizing a product with a designated Harmonized Tariff Schedule (HTS) code under a separate HTS code to obtain a lower tariff rate. For example, the importer of a chicken egg with a 20-percent tariff could misclassify it as a duck egg with a 10-percent tariff. There are dozens of 2-digit HTS code categories and thousands of more detailed 10-digit HTS codes that represent most products.
Transshipment of Imported Goods: This involves an importer shipping a product from the country of origin to a third country before being shipped to the final destination. For example, a Chinese exporter may ship a good to Vietnam or Mexico where it is then transported to the United States. Since countries have varying tariff rates, this approach reduces the overall tariff applied to U.S. imports. Alternatively, this could be considered country-of-origin fraud where an importer purposefully changes the documents that specify where certain items are coming from.
Tariff Evasion Penalties
In the United States, tariff evasion is investigated by both the Department of Justice and the Customs and Border Protection (CBP). In August 2025, the DOJ set up the Trade Fraud Task Force to coordinate DOJ enforcement against importers evading tariffs. Previously, tariff enforcement occurred primarily through the CBP, with civil penalties imposed under 19 U.S.C. § 1952 and the Enforce and Protect Act. Under § 1952, violators found guilty of gross negligence and duty loss could be ordered to pay up to four times the duties owed. The DOJ prosecution focuses on criminal penalties, with enforcement falling under the False Claims Act, among other laws. Under the False Claims Act, violators can face required monetary restitution of up to three times the amount of unpaid tariffs as well as penalties of up to $28,619 per false claim. Under 8 U.S.C. § 541, 542, entry of goods falsely classified or entry of goods by false statements is punishable by up to two years of imprisonment. Moreover, whistleblowers are encouraged under both the Corporate Whistleblower Wards Pilot Program and the False Claims Act, offering percentage of the net proceeds forfeited from a successful prosecution.
Figure 10: Per-unit Import Value of Garbage Disposals From China
Source: Dataweb, The United States International Trade Commission
Figure 11: Total Import Value of Garbage Disposals
Source: Dataweb, The United States International Trade Commission
Figure 12: Total Number of Imported Garbage Disposal Units
Source: Dataweb, The United States International Trade Commission
Figure 13: Total Import Value of Gas Ranges

Source: Dataweb, The United States International Trade Commission
Figure 14: Total Number of Imported Gas Ranges
Source: Dataweb, The United States International Trade Commission