Research
September 24, 2021
The Right Road? Cost-Benefit Issues Raised by Recent Fuel Efficiency Standards
EXECUTIVE SUMMARY
- In recent weeks, the Environmental Protection Agency and National Highway Traffic Safety Administration proposed the latest, more stringent round of fuel efficiency standards for passenger vehicles produced in model years 2023-2026.
- While past iterations of these rulemakings have been fully joint ventures, this version involves separate proposals that, due to differing statutory directives, produce somewhat diverging analyses.
- A further examination of these analytical frameworks, however, calls into question some of the underlying assumptions and cost-benefit calculations made by the agencies in justifying their actions against the current backdrop of market trends.
INTRODUCTION
Last month, the Environmental Protection Agency (EPA) and National Highway Traffic Safety Administration (NHTSA) each released its own proposal seeking to update fuel efficiency standards for the next few model years (MY) of light-duty vehicles. This latest stage of fuel efficiency standards is peculiar in that, largely due to differences in statutory authority, the agencies published separate rulemakings as opposed to a joint action (as has been recent precedent). Despite this divergence, this latest round continues the recent trend of fuel efficiency rules being among the most economically significant promulgated by any agency. A deeper examination of these proposals’ analyses, however, raises serious questions about why the agencies decided upon their current paths and how their analytical frameworks interact with real-life market trends.
CORE DISTINCTIONS OF RECENT PROPOSALS
The two proposals come in the form of EPA’s proposed rule entitled “Revised 2023 and Later Model Year Light-Duty Vehicle Greenhouse Gas [GHG] Emissions Standards” and NHTSA’s proposed rule entitled “Corporate Average Fuel Economy [CAFE] Standards for Model Years 2024-2026 Passenger Cars and Light Trucks.” In the past two administrations, these rules took the form of a joint rulemaking between the agencies – both with an estimated economic impact in the hundreds of billions of dollars. In this instance, however, the agencies contend that their different statutory mandates mean it is more practicable to publish separate rules. Nevertheless, the economic magnitude remains similar.
The EPA proposal seeks to reverse the Trump-era “Safer Affordable Fuel-Efficient (SAFE) Vehicles” rule framework in order “to increase the stringency of the standards from the average roughly 1.5 percent year-over-year stringency increase of the relaxed SAFE standards to a nearly 10 percent proposed stringency increase in MY 2023, followed by a nearly 5 percent proposed stringency increase in each MY from 2024 through 2026.” EPA estimates that these increases in stringency across each MY will result in a “real world” (the figure “comparable to what a consumer would see on a fuel economy label) miles-per-gallon (MPG) value of 38.2 MPG. The agency also estimates in its Regulatory Impact Analysis (RIA) the following economic impact over the next 30 years:
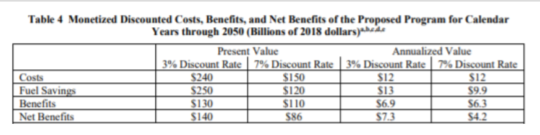
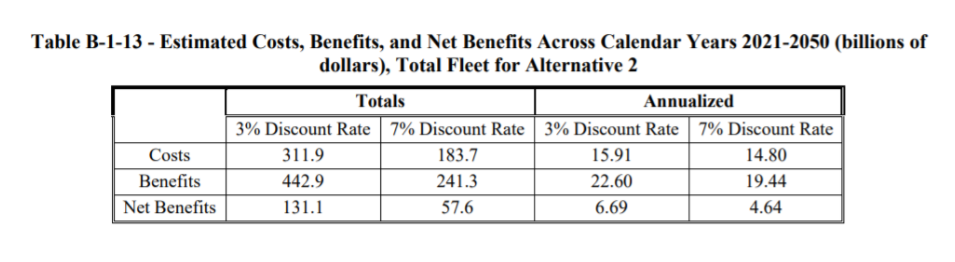
The primary aim of the NHTSA proposal is to have CAFE standards that “would increase in stringency from MY 2023 levels by 8 percent per year, for both passenger cars and light trucks over MYs 2024-2026.” The agency “currently projects that the proposed standards would require, on an average industry fleet-wide basis, roughly 48 mpg in MY 2026.” It also “notes both that real-world fuel economy is generally 20-30 percent lower than the estimated required CAFE level stated above,” which would put it roughly in line with EPA’s projected MPG figure. NHTSA’s primary cost-benefit analysis focuses upon a MY-by-MY framework. In the appendices to its RIA, however, the agency does the following cost-benefit estimate that generally aligns with EPA’s methodology.
The differences in overall approach and substance between the two agencies’ actions stem primarily from the differences in their respective statutory mandates. EPA ultimately draws its authority to regulate the emission of greenhouse gases from Section 202 of the Clean Air Act (CAA) and a determination under current Supreme Court precedent that the excessive emission of such gases “endangers public health and welfare.” Meanwhile, NHTSA sets its CAFE standards under the Energy Policy and Conservation Act (EPCA), which focuses on directly regulating the fuel efficiency of vehicles.
Beyond simply the difference in what is being regulated by which agency, this statutory authority divergence also has implications for when each agency can establish its standards. Per the NHTSA proposal’s preamble:
While the proposed CAFE and CO2 standards for MYs 2024-2025 are different, this is largely due to the difference in the “start year” for the revised regulations—EPA is proposing to revise standards for MY 2023, while EPCA’s lead time requirements, which do not apply to EPA, prevent NHTSA from proposing revised standards until MY 2024. In order to set standards for MY 2023, EPA intends to issue its final rule by December 31, 2021, whereas NHTSA has until April 2022 to finalize standards for MY 2024.
This difference will have important ramifications, as discussed in the “Implications” section below.
COMPARISON OF COST ESTIMATES
Despite these divergences, the agencies still expect that (as NHTSA puts in its RIA) the “costs and benefits of the two programs will largely overlap, since manufacturers will take many actions that respond to both programs simultaneously.” If that’s the case, then why is NHTSA’s cost estimate more than $30 billion higher? A closer examination of the overarching cost categories finds that that gap largely comes from NHTSA accounting for the loss in state fuel tax revenue (due, of course, to the estimate lower amounts of fuel consumed) as a cost while EPA does not.
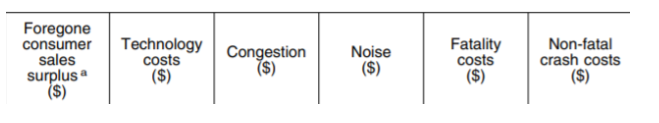
NHTSA ascribes the CAFE program’s costs into these categories:

Meanwhile, EPA categorizes its GHG emissions standards costs thusly:
Consolidating aspects of these analyses into like categories yields the following breakdown:
| Overall Cost Category | EPA ($ Billions) | NHTSA ($ Billions) |
| Forgone Consumer Surplus | 3.7 | 0.5 |
| Technology Costs | 130 | 108.4 |
| Safety Costs | 9 | 24.9 |
| Congestion/Noise Externalities | 7.42 | 18.2 |
| Forgone State Fuel Tax Revenue | N/A | 31.8 |
For both agencies, technology costs – those incurred by manufacturers in making their vehicles more efficient – provide the bulk of their respective estimates. NHTSA then attributes a much higher share of the costs to the safety and externality categories. These costs come from the expected “rebound effect,” wherein the agency expects more efficient vehicles to induce some increase in the amount drivers drive. This higher traffic volume will then increase the volume of congestion and noise as well as the potential for accidents.
Despite some of these differences in how much fits into which category, there is only a roughly $2 billion gap between each agency’s overall non-fuel-tax-related cost estimate. The core difference therefore is that NHTSA includes such an estimate in its cost estimate while EPA does not. EPA does, however, take account of the fuel tax implications in its benefits estimate. In this case, EPA attributes the diminished amount paid by drivers as part of their overall fuel savings. EPA’s estimate in this regard is still similar to NHTSA’s at $32 billion; it simply attributes its impact differently.
IMPLICATIONS
As the American Action Forum noted earlier this year, for as complex as these rulemakings are in a purely academic sense, that complexity increases when taking into account real world developments. The most significant recent development on the fuel standards front is the agreement reached by a handful of manufacturers (representing roughly a third of the industry) to voluntarily follow California’s set of standards – setting an informal industry benchmark. Both agencies’ proposals include analyses of what amounts to a national-level California fuel standards framework as their less-stringent alternative to what was ultimately proposed. In breaking down the feasibility of this California alternative, however, the agencies also raise points that implicitly raise doubts about the feasibility of their preferred proposals.
Both agencies point to the California agreement as the reason for increasing the stringency of their respective fuel standards. As NHTSA succinctly puts it: “The California Framework and the clear planning by industry to migrate toward more advanced fuel economy technologies are evidence of the practicability of more stringent standards.” Meanwhile, EPA “views the California Framework as a reasonable basis for the least stringent alternative that EPA would consider finalizing.” Both agencies also include the following graphical comparisons of the effects of the alternatives considered versus previous rules on the matter.
NHTSA
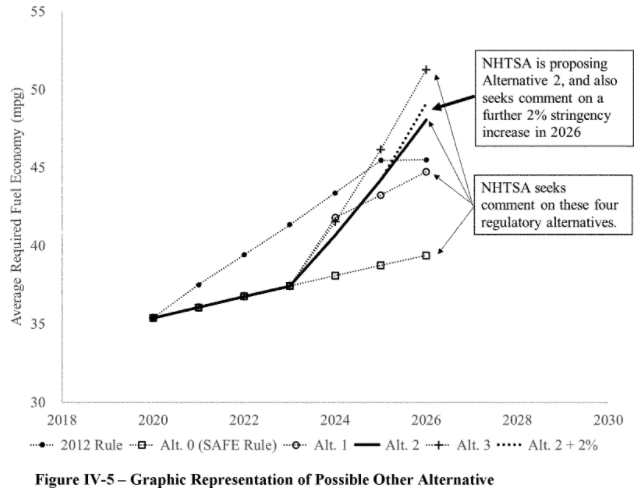
*”Alt. 1” is the California Framework and “Alt. 2” is the agency’s preferred alternative.
EPA
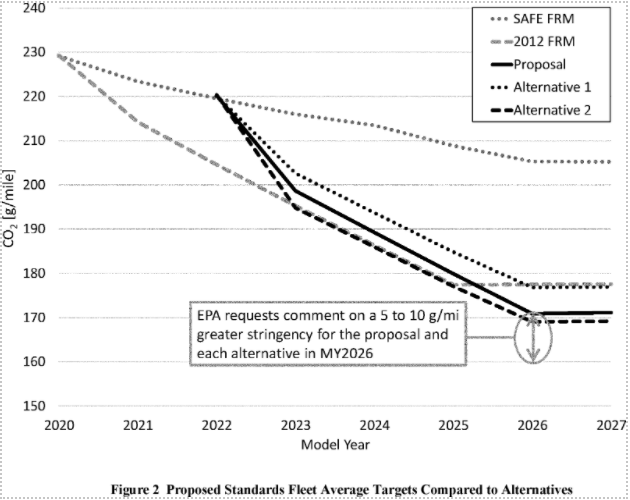
*”Alternative 1” is the California framework.
The graphs illustrate different phenomena since, as discussed in the first section of this analysis, the agencies’ respective statutory mandates differ. Nevertheless, perhaps the most important point of each depiction is that they are largely aligned in terms of the California “alternative” roughly lining up with the 2012 rule (the Obama Administration’s standards) in terms of efficiency levels for MY 2026 vehicles. This becomes an important point in the discussion regarding feasibility. EPA provides the more robust, yet ultimately somewhat confounding, explanation in this regard.
In EPA’s discussion of feasibility, the agency contends that since manufacturers have had to make plans based upon the 2012 rule for nearly a decade, they are well-versed in devising new technologies to meet increasingly stringent standards. Specifically, the agency notes: “in contrast to the situation that existed prior to EPA’s adoption of the initial light-duty GHG standards in the 2012 rule, automakers now have had the benefit of at least 8 to 9 years of planning and development in preparation for meeting the proposed standards.” Furthermore, EPA cites an industry assessment that manufacturers already have plans laid out for a given MY fleet roughly five years prior to its actual production.
This discussion of time windows is all well and good for a previously expected or voluntarily taken production plan (i.e. the 2012 rule or the California framework, respectively). Recall, however, from the first section of this analysis how EPA expects to set its standards by the end of 2021 to have them in effect for MY 2023 vehicles. Imposing a more stringent standard on top of real-world, business-as-usual expectations – over a much shorter time window, no less – necessarily brings greater costs, and thus inherently raises doubts on both the feasibility and desirability of this newly proposed level of efficiency standards.
That said, since it is EPA’s prerogative to implement such standards based upon its policy preferences, it is worth further examining the apparent implications of such a decision. In a table representing the top-line comparison of costs and benefits between its proposed standards and the alternatives considered (“Table 15” of the RIA), EPA provides the following breakdown of the proposal versus the California “alternative”:
Present Value Monetized Discounted Costs, Benefits, and Net Benefits of the Proposed Program and Alternatives for Calendar Years through 2050 (billions of 2018 dollars)
| Proposed Rule | California Alternative | |
| Costs | $150 | $110 |
| Fuel Savings | $120 | $98 |
| Benefits | $110 | $93 |
| Net Benefits | $86 | $76 |
*Per “Footnote a” from the original graph: “Values rounded to two significant figures; totals may not sum due to rounding.”
EPA states in this graph that this proposed rule would yield roughly $10 billion more in present value than the California alternative. Granting the caveat that, especially with the wide variance possible in health and climate benefits estimates, the rounding is off somehow, this graph’s component figures call into question that “Net Benefits” figure, and thus the cost-benefit rationale behind this policy decision. There is an apparent $40 billion increase in costs from the California alternative to get to the proposed standards, while bringing an estimated $22 billion in additional “fuel savings” and $17 billion in other benefits (or $39 billion in total additional benefits) for what would then appear to be net costs of $1 billion.
It would be one thing if imposing these additional costs yielded sizeable additional benefits, but that appears to not be the case. In fact, this estimate suggests that marginal costs could exceed marginal benefits – which is generally not the aim of regulatory cost-benefit analysis. Perhaps these figures will be further refined during the rule’s development, but (rough rounding explanation aside) it currently does not represent a particularly compelling policy case for going beyond the emerging real-world industry trend represented by the California framework.
CONCLUSION
These latest proposals represent yet another turn in the long and winding road of fuel efficiency regulations. In the past, it has been NHTSA and EPA riding together with a joint rulemaking. This time, however, there is the added wrinkle of having separate proposed rules to pore over. While the agencies involved contend that this latest iteration is merely a natural progression of fuel standards from years past, a closer look raises more questions than answers on some of the underlying decisions made.