


Testimony
September 13, 2018
The Workforce and Economic Implications of the Opioid Crisis: Testimony to the U.S. House Small Business Committee
Introduction
Chairman Chabot, Ranking Member Velàzquez, I am pleased to have the opportunity to appear today to discuss the opioid epidemic. My testimony will focus on three key points:
- Trends in overdose fatalities suggest that while prescription painkillers likely caused most of today’s dependency, the nature of the epidemic has changed in recent years with opioid-involved overdose deaths now spiking because of heroin and illegal synthetic opioids.
- Between 1999 and 2015, opioids reduced prime-age labor force participation by 1.6 percentage points (or 2 million workers as of 2015) and, as a result, slowed the annual real (inflation-adjusted) economic growth rate by 0.6 percentage points and cumulatively cost the U.S. economy $1.6 trillion.
- The impact of opioids on labor force participation and economic growth varies considerably by state, with the largest negative effects occurring in West Virginia, Arkansas, Missouri, Georgia, New York, and Kentucky.
I will discuss each of these points in additional detail.
Using Overdose Fatality Data to Understand the Opioid Crisis
Fueled by the proliferation of opioid prescriptions and exacerbated by an inundation of illegal and even more dangerous opioids, addiction has grown rapidly in recent decades. The result has been an abrupt escalation in drug overdose deaths: In 2017, 47,872 Americans died (131 per day) from opioid-related drug overdoses, according to the Centers for Disease Control and Prevention’s (CDC) preliminary estimate.[1] Since 1999, the number of opioid-involved overdose fatalities occurring annually has risen by 495 percent, or 10 percent per year. [2] In recent years, the growth of annual opioid overdose fatalities had also been accelerating: 8 percent in 2013, 14 percent in 2014, 16 percent in 2015, and 28 percent in 2016.[3] As a result, opioids have contributed to the first decline in U.S. life expectancy since the height of the AIDS epidemic in 1993.[4]
The CDC’s recent preliminary data indicate that opioid-involved overdose fatalities rose by 13 percent in 2017.[5] Although opioid-involved overdose fatalities continued to rise to a new record level in 2017, the fact that the growth rate decelerated to the lowest level since 2013 tentatively suggests the opioid epidemic could be tapering.
While many argue that the rapid rise in opioid-involved overdose fatalities is tied to poor economic outcomes (e.g. slow job and wage growth), evidence suggests economic conditions only account for a small portion of the increase in overdose deaths. Rather, most of the rise is likely linked to the availability and relatively low cost of opioid drugs.[6]
Individuals are generally first exposed to opioids when doctors prescribe legal opioid painkillers, and trends in overdose fatalities suggest that growing access to prescription opioids built the foundation of opioid dependency in the United States. Yet, the nation’s opioid dependency became a crisis when policy efforts effectively restricted access to prescription opioids. As access to prescriptions declined, users likely turned to more potent illegal opioids, which caused overdose fatalities to accelerate.
Access to Prescription Opioids
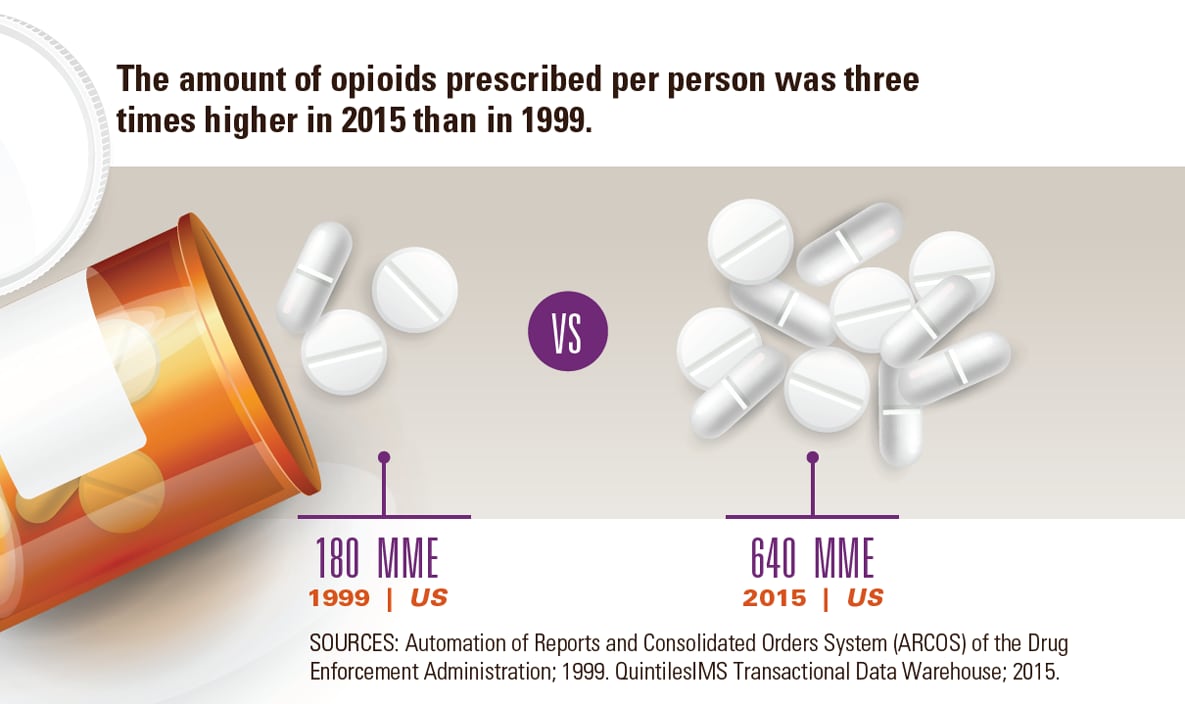
A previous AAF study compared the supply of prescription painkillers to opioid-involved overdose fatalities between 1999 and 2016.[7] It found that the quantity of opioids prescribed by doctors rose steadily between 1999 and 2010, and has since declined considerably. Starting in 1999, morphine milligram equivalent (MME) prescribed per capita, a standardized metric that aggregates all types of prescription opioids, rose 14.3 percent per year, until it peaked at 782 MME per capita in 2010.[8], [9] After 2010, the supply of prescription opioids declined 4.3 percent annually, and in 2016 doctors prescribed 599 MME per capita.
This shift corresponds with several major efforts intended to restrict access to prescription opioids starting around 2010. First, the Drug Enforcement Administration (DEA) began aggressively investigating actors associated with the epidemic, including wholesale companies that distributed pills to unlawful doctors and pharmacies that gave out pills in exchange for cash.[10] A large part of the DEA’s effort was aided by the expansion of prescription drug monitoring programs, which track sales of prescription drugs.[11] Second, in 2009, the federal government began implementing the Ryan Haight Act. This made it illegal to distribute controlled substances online and required doctors to see patients in person prior to writing a prescription.[12]
Third, in 2010, the American Pain Society[13] as well as the Department of Veterans Affairs and the Department of Defense[14] issued guidelines to encourage doctors to prescribe fewer opioids. Fourth, in 2010, drug manufacturers released a reformulated version of OxyContin (a common prescription opioid), making it more difficult to abuse.[15] The corresponding decline in the quantity of prescription opioids suggests that these efforts may have effectively restricted their supply.
Shifts in Overdose Fatalities
Notably, the decline in access to prescription opioids starting after 2010 corresponded with an acceleration in the growth of annual opioid-involved overdose fatalities. In particular, the annual growth rate of opioid-involved overdose fatalities occurring each year rose from 9.1 percent before 2010 to 12.3 percent after 2010.
How could overdose fatalities occurring each year accelerate if prescription painkillers have become far more restricted? To answer this question, we examined overdose fatalities by the three main types of opioids: prescription painkillers, heroin, and illegal synthetic opioids.
From 1999 to 2016, the growth in prescription opioid-involved overdose deaths mirrored the growth in the supply of prescription opioids discussed above. In particular, between 1999 and 2010, prescription opioid-involved fatalities grew at a 13.4 percent annual rate. But after 2010, when the supply of prescription opioids declined, growth in overdose fatalities involving those drugs slowed considerably. From 2010 to 2016, prescription-involved fatalities rose by only 4.8 percent per year. Moreover, preliminary data indicate that the number of overdose fatalities involving prescription painkillers rose by only 0.5 percent in 2017.[16] This suggests efforts that successfully restrict access to prescription opioids may have also limited the fatal consequences of those drugs.
While prescription-involved fatalities stagnated, growth in the total number of opioid-involved fatalities nevertheless accelerated. Significant evidence suggests that with few affordable and effective addiction treatment options[17] and a more limited supply of prescription opioids, users likely began turning to cheaper and more potent illicit opioids as a substitute.[18] The overdose fatality data also indicate this substitution, as overdose fatalities tied to heroin and illegal synthetic opioids rose rapidly after 2010.
The decline in prescription opioids coincides with significant growth in overdose fatalities involving heroin. From 1999 to 2010, overdose deaths involving heroin rose by only 4.1 percent per year. In 2010, 3,036 people died from an overdose involving heroin, while 10,943 died from a prescription opioid-involved overdose. But after 2010, when the supply of prescription opioids began to decline, the number of heroin-involved overdose fatalities grew by 31.2 percent per year. Just five years later in 2015, heroin-involved overdose fatalities surpassed the number of fatalities involving prescription opioids. In 2016, there were 15,469 heroin-involved overdose fatalities, nearly 1,000 more than the number of overdose fatalities linked to prescription opioids.
Research suggests that the reformulation of OxyContin in 2010 could be a major factor driving the rise in heroin fatalities, as users began turning to heroin as a substitute. One study found that up to 80 percent of the rise in heroin-involved overdose deaths since 2010 could be due to this change.[19]
The acceleration in overdose fatalities involving illegal synthetic opioids (e.g., fentanyl and carfentanil) also corresponded to efforts to restrict prescription opioids. From 1999 to 2010, synthetic opioid-involved overdose fatalities rose 13.7 percent per year. Between 2010 and 2016, that growth rate jumped to 36.5 percent. Most striking is the rapid growth in overdose fatalities involving synthetic opioids in just the last few years. Between 2013 and 2016, the number of opioid overdose deaths involving synthetic opioids grew 84.2 percent each year. In 2013, 3,105 people died from a synthetic opioid-involved overdose. By 2016, just three years later, overdose deaths linked to synthetic opioids outnumbered those involving heroin and prescription opioids. With 19,413 overdose fatalities in 2016, synthetic opioids are now the largest reason for the recent spike in opioid-involved overdose deaths. Additionally, preliminary data indicate that illegal synthetic opioid-involved overdose fatalities increased 47.6 percent to 28,649 in 2017, accounting for nearly the entire rise in all opioid-involved overdose deaths that year.[20]
Overall, these data illustrate that the nature of the opioid crisis has changed in recent years. From 1999 to 2010, prescription painkillers were responsible for most of the rise in opioid-involved overdose fatalities. But as access to those prescriptions became more limited, users began turning to illegal and far more potent drugs, like heroin and synthetic opioids. As a result, overdose fatalities involving those drugs have accounted for the recent acceleration in opioid-involved fatalities.
The Impact of Opioids on the Labor Force, Economy, and Small Businesses Nationwide
While the human toll of the opioid crisis is unquestionable, rising opioid dependency is also likely impacting the nation’s labor market and economy. Workers on opioids are less productive; employers in opioid-affected areas have difficulty finding dependable workers and filling job openings; and, perhaps most important, working-age adults addicted to opioids are often absent from the labor market.
A report by Alan Krueger, former Chairman of the White House Council of Economic Advisers, found that opioids are likely pulling prime-age workers (those ages 25 to 54) out of the labor force. In particular, Krueger found that nearly half of the prime-age men who are not in the labor force take pain medicine daily. Of those taking pain medicine daily, two-thirds use prescription painkillers.[21]
Moreover, the rise in opioid dependency since 1999 directly corresponds with a decline in the prime-age labor force participation rate. Between 1999 and 2015, per capita prescription opioids rose 256 percent, or 8 percent annually. During that same period, the labor force participation rate of prime-age workers declined from 84.1 percent to 80.9 percent. For prime-age men it declined from 91.7 percent to 88.3 percent, and for women it declined from 76.8 percent to 73.7 percent.
While there are many reasons the prime-age labor force participation rate has been declining,[22] opioid dependency could be a primary cause. Dr. Krueger found statistically significant evidence that the rise in opioid prescriptions is tied to the decline in the prime-age labor force participation rate for both men and women. His results suggest that the increase in opioid prescriptions between 1999 and 2015 could account for 20 percent of the decline in the prime-age male and 25 percent of the decline in the prime-age female labor force participation rate over that period.[23]
A recent American Action Forum study applied Dr. Krueger’s results to labor force and productivity statistics to estimate the number of workers absent from the labor force due to opioids and the resulting loss of economic growth.[24] The study found that in 2015, over 2 million prime-age individuals were not in the labor force due to opioids, and from 1999 to 2015, the loss of labor slowed the annual real gross domestic product (GDP) growth rate by 0.6 percentage points and cost the U.S. economy roughly $1.6 trillion.[25]
The following provides more detailed information on the nationwide impact of opioids on labor force participation, work hours, economic growth, and small businesses.
Labor Force Participation
Table 1 contains the decline in the prime-age labor force participation rate due to opioids, and the resulting number of workers absent from the labor force as of 2015.
Table 1: The Impact of Opioids on Prime-Age Labor Force Participation, 1999-2015
| Gender |
Prime-Age Labor Force Participation Rate, 1999-2015 (in percentage points) |
Workers, 2015 (in thousands)* |
| Total |
-1.6 |
-2,006.1 |
| Men |
-1.4 |
-860.0 |
| Women |
-1.8 |
-1,146.2 |
| *Estimates for each gender may not add to total due to rounding. | ||
The rise in opioid prescriptions from 1999 to 2015 led the labor force participation rate for both prime-age men and women to decline substantially. Opioids lowered the participation rates of prime-age men and women by 1.4 percentage points and 1.8 percentage points, respectively. The 1.4 percentage point decline in prime-age male labor force participation equates to roughly 40 percent of the overall decline in prime-age male labor force participation between 1999 and 2015. For prime-age women, the 1.8 percentage point decline tied to opioids equates to almost 60 percent of the entire decline in their participation rate.[26]
The decline in the prime-age male labor force participation rate means that, in 2015, 860,000 men were absent from the labor force due to opioids. The steeper decline in prime-age female labor force participation means that even more women were absent from the labor force due to opioids. In 2015, opioids kept over 1.1 million women out of the labor force. Together, the growth in per capita prescription opioids from 1999 to 2015 caused the total prime-age labor force participation rate to decline by 1.6 percentage points. That decline translates to a loss of 2 million workers as of 2015.
Work Hours
From 1999 to 2015, the rise in opioid dependency and resulting decline in prime-age labor force participation cumulatively cost the economy nearly 30 billion work hours. Table 2 contains the cumulative loss of work hours associated with the decline in labor force participation.
Table 2: Impact of Opioids on Work Hours, 1999-2015
| Gender |
Work Hours, Cumulative 1999-2015 (in millions) |
| Total |
-27,001 |
| Men |
-11,593 |
| Women |
-15,408 |
As the number of individuals absent from the labor force due to opioids grew, the economy lost more and more work hours. Between 1999 and 2015, the loss of workers cost the U.S. economy over 27 billion work hours. Since opioid dependency led more women out of the labor force than men, the majority of the lost work hours was attributed to the decline in female labor force participation. Specifically, the economy lost 15.4 billion work hours due to absent female workers, and 11.6 billion work hours due to absent male workers.
Real Economic Growth
The tens of billions in lost work hours resulted in a major drag on U.S. economic growth. Table 3 contains the cumulative reduction in real economic output due to the opioid crisis and the associated decline in the real GDP annual growth rate.
Table 3: Impact of Opioids on Real Economic Growth, 1999-2015 (in 2009 dollars)
| Gender |
Real Output, Cumulative 1999-2015 (in billions) |
Annual Real GDP Growth Rate, 1999-2015 (in percentage points) |
| Total |
-$1,574.5 |
-0.6 |
| Men |
-$676.0 |
-0.3 |
| Women |
-$898.5 |
-0.3 |
From 1999 to 2015, the opioid-induced decline in labor force participation was a major cost to the U.S. economy. During that timeframe, the U.S. economy cumulatively lost nearly $1.6 trillion in real economic output, which translates to the annual real GDP growth rate slowing by 0.6 percentage points. To put this loss in perspective, from 1999 to 2015, real GDP grew 2 percent annually. Had opioids not drawn 2 million prime-age workers out of the labor force, real GDP would have grown 2.6 percent each year, a 30 percent increase.
Since more women left the labor force due to opioids than men, the decline in female labor force participation resulted in a larger portion of the economic cost. The decline in female labor resulted in a cumulative loss of $898.5 billion in real output between 1999 and 2015. The decline in male workers cost the economy $676 billion. The difference, however, is not large enough to translate to a substantially different decline in the economic growth rate, as the lost labor associated with each gender slowed the real GDP growth rate by about 0.3 percentage points.
Impact on Small Business
The decline in prime-age labor force participation due to opioids and resulting slowdown in economic growth has likely hurt small businesses in particular. To estimate the impact of opioids on small businesses, the analysis below assumes that, had these absent workers been in the labor force in 2015, their distribution by business size would have matched the distribution of all private sector employees.[27]
Table 4 contains the resulting distribution of lost prime-age employees, work hours, and economic growth by business size.
Table 4: Impact of Opioids on Businesses by Establishment Size
| Establishment Size by Number of Employees |
Employees, 2015 (in thousands)[28] |
Work Hours, Cumulative 1999-2015 (in millions) |
Real GDP, Cumulative 1999-2015 (in billions) |
| Under 5 |
-140 |
-1,974 |
-$115 |
| 5 to 9 |
-153 |
-2,162 |
-$126 |
| 10 to 19 |
-216 |
-3,050 |
-$178 |
| 20 to 49 |
-335 |
-4,722 |
-$275 |
| 50 to 99 |
-257 |
-3,622 |
-$211 |
| 100 to 249 |
-314 |
-4,424 |
-$258 |
| 250 to 499 |
-177 |
-2,501 |
-$146 |
| 500 to 999 |
-122 |
-1,720 |
-$100 |
| 1,000 or more |
-201 |
-2,826 |
-$165 |
| Under 50 |
-885 |
-11,908 |
-$694 |
This rough estimate suggests that in 2015, of the 2 million workers absent from the labor force due to opioids, 885,000, or 44 percent, would have been employed by establishments with fewer than 50 workers. As a result, small businesses lost 11.9 million work hours and $694 billion in productivity due to opioids.
The figures in Table 4 also indicate that, in 2015, establishments with 20 to 49 employees lost more workers due to opioids than establishments with 1,000 or more employees. Specifically, establishments with 20 to 49 workers lost 335,000 workers due to opioids in 2015, while establishments with 1,000 or more lost 201,000.
Impact of Opioids on Labor Force Participation and Economic Growth by State
The same American Action Forum study found that the opioid crisis has negatively impacted the labor force and economy in nearly every state. The severity of the impact, however, varies considerably by state.[29]
Table 5 contains a summary of the impact of opioids on prime-age labor force participation and economic growth in each state.
Table 5: Impact of Opioids on Prime-Age Labor Force Participation and Real Economic Growth by State
| State | Prime-age Labor Force Participation Rate, 1999-2015 (in pct pts) | Workers, 2015 (in thousands) | Work Hours, Cumulative 1999-2015 (in millions) | Real Output, Cumulative 1999-2015 (in billions) | Annual Real GDP Growth Rate, 1999-2015 (in pct pts) |
| Alabama | -2.6 | -46.3 | -646.4 | -$37.7 | -1.2 |
| Alaska | -1.6 | -4.5 | -59.4 | -$3.5 | -0.4 |
| Arizona | -1.6 | -41.5 | -542.5 | -$31.7 | -0.7 |
| Arkansas | -3.8 | -43.4 | -574.5 | -$33.5 | -1.7 |
| California* | 0.1 | 16.9 | 220.4 | $12.9 | 0.0 |
| Colorado | -1.2 | -27.4 | -359.8 | -$21.0 | -0.5 |
| Connecticut | -1.6 | -22.9 | -312.6 | -$18.2 | -0.5 |
| Delaware | -1.7 | -6.3 | -82.5 | -$4.8 | -0.5 |
| District of Columbia^ | n/a | n/a | n/a | n/a | n/a |
| Florida | -1.7 | -128.8 | -1,662.0 | -$97.1 | -0.7 |
| Georgia | -2.9 | -117.8 | -1,574.1 | -$91.9 | -1.2 |
| Hawaii | -0.4 | -2.0 | -28 | -$1.6 | -0.1 |
| Idaho | -1.7 | -10.5 | -137 | -$8.0 | -0.8 |
| Illinois | -1.7 | -84.9 | -1,188.1 | -$69.2 | -0.6 |
| Indiana | -2.4 | -60.8 | -837.1 | -$48.8 | -1.0 |
| Iowa | -2.6 | -31.0 | -432.2 | -$25.2 | -0.9 |
| Kansas | -2.0 | -21.4 | -296.4 | -$17.3 | -0.8 |
| Kentucky | -2.8 | -48.2 | -650.8 | -$38.0 | -1.3 |
| Louisiana | -2.1 | -38.6 | -509.4 | -$29.7 | -0.8 |
| Maine | -1.3 | -6.4 | -92.4 | -$5.4 | -0.6 |
| Maryland | -2.7 | -65.8 | -882.5 | -$51.5 | -0.9 |
| Massachusetts | -1.9 | -50.8 | -701.6 | -$40.9 | -0.6 |
| Michigan | -2.4 | -89.2 | -1,239.0 | -$72.1 | -1.0 |
| Minnesota | -1.8 | -40.0 | -544.8 | -$31.8 | -0.7 |
| Mississippi | -1.5 | -16.4 | -221.4 | -$12.9 | -0.8 |
| Missouri | -3.0 | -71.3 | -982.9 | -$57.3 | -1.3 |
| Montana | -0.7 | -2.4 | -33.8 | -$2.0 | -0.3 |
| Nebraska | -0.9 | -6.4 | -89.1 | -$5.2 | -0.3 |
| Nevada | -1.3 | -15.7 | -193.1 | -$11.3 | -0.5 |
| New Hampshire | -1.5 | -7.9 | -113.9 | -$6.6 | -0.6 |
| New Jersey | -0.6 | -22.3 | -301.5 | -$17.6 | -0.2 |
| New Mexico* | 0.3 | 2.2 | 31.1 | $1.8 | 0.1 |
| New York | -2.9 | -225.9 | -3,076.8 | -$179.4 | -0.8 |
| North Carolina | -2.6 | -99.7 | -1,292.8 | -$75.5 | -1.0 |
| North Dakota^ | n/a | n/a | n/a | n/a | n/a |
| Ohio | -2.0 | -86.7 | -1,232.1 | -$71.7 | -0.8 |
| Oklahoma | -2.2 | -32.9 | -435.9 | -$25.5 | -0.9 |
| Oregon | -1.7 | -26.9 | -356.0 | -$20.8 | -0.6 |
| Pennsylvania | -1.7 | -79.7 | -1,131.0 | -$65.9 | -0.6 |
| Rhode Island | -1.0 | -4.3 | -59.0 | -$3.4 | -0.4 |
| South Carolina | -2.3 | -42.8 | -543.7 | -$31.8 | -1.0 |
| South Dakota | -0.6 | -1.8 | -24.2 | -$1.4 | -0.2 |
| Tennessee | -2.6 | -66.9 | -894.9 | -$52.2 | -1.1 |
| Texas | -1.6 | -171.1 | -2,200.7 | -$128.8 | -0.5 |
| Utah | -0.9 | -10.5 | -136.1 | -$8.0 | -0.4 |
| Vermont | -1.3 | -3.1 | -44.4 | -$2.6 | -0.6 |
| Virginia | -0.6 | -18.8 | -254.1 | -$14.8 | -0.2 |
| Washington | -1.1 | -31.1 | -412.8 | -$24.1 | -0.4 |
| West Virginia | -3.8 | -25.0 | -359.9 | -$21.0 | -1.7 |
| Wisconsin | -2.1 | -45.2 | -635.3 | -$37.0 | -0.8 |
| Wyoming | -1.9 | -4.2 | -56.6 | -$3.3 | -0.6 |
| *Slightly positive outcomes are recorded for California and New Mexico because per capita opioid prescriptions declined over the 1999-2015 period. | |||||
| ^Not enough data available to perform analysis. | |||||
The states hit hardest by the opioid epidemic are Arkansas and West Virginia. Specifically, opioids led the prime-age labor force participation rate in each state to decline by 3.8 percentage points. That loss of labor caused the annual real GDP growth to decline by 1.7 percentage points in each state.
For perspective, the negative labor market effects of opioids in Arkansas and West Virginia were substantially larger than those in Missouri, the state with the next largest decline in labor force participation. Opioids caused Missouri’s prime-age labor force participation rate to decline by 3.0 percentage points. That led annual real GDP growth in Missouri to decline by 1.3 percentage points.
Opioids also drew a substantial portion of workers out of the labor force in Georgia, New York, and Kentucky. In those states, opioids were associated with the prime-age labor force participation rate declining by 2.9, 2.9, and 2.8 percentage points, respectively. As a result, the annual real GDP growth rate in Georgia, New York, and Kentucky declined by 1.2, 0.8, and 1.3 percentage points, respectively.
In absolute terms, opioids tended to have the largest negative impact on the labor force and economy in the more populous states. New York and Texas lost the most workers, work hours, and real economic output due to opioids. No state had more individuals absent from the labor force due to opioids than New York. As of 2015, 225,900 people were absent from New York’s labor force due to opioids. Likewise, in Texas opioids kept 171,100 people from the labor force. The decline in labor in these states also resulted in the largest loss of economic output. In particular, the decline in labor force participation between 1999 and 2015 cumulatively cost New York and Texas 3.1 billion and 2.2 billion work hours, respectively. That, in turn, cost New York $179.4 billion and Texas $128.8 billion in real output.
Conclusion
While the health and personal consequences of the opioid crisis are apparent, the increase in opioid dependency is also impacting the broader U.S. economy. The U.S. economy depends on prime-age workers because they are among the most productive workers in the labor force. Yet, the growth in opioid dependency over the past two decades has contributed to their falling labor force participation rate.
As of 2015, over 2 million workers were absent from the labor force due to opioids. Between 1999 and 2015, the growing loss of labor cumulatively cost the economy 27 billion work hours and nearly $1.6 billion in lost output, slowing the annual real GDP growth rate by 0.6 percentage points. Given the significant roll that small businesses play in the U.S. economy, they are likely among the hardest hit by the crisis.
Additionally, the opioid crisis’s effect on labor and economic growth varies considerably by state. The states most dramatically impacted by the opioid crisis are Arkansas and West Virginia. Opioids lowered the prime-age labor force participation rate by 3.8 percentage points in both Arkansas and West Virginia, which in turn slowed each state’s annual real GDP growth rate by 1.7 percentage points.
As federal, state, and local policymakers consider ways to grow the economy, boost the labor supply, and support small businesses, addressing the opioid epidemic must be part of the solution.
End Notes
[1] “12 Month-ending Provisional Number of Drug Overdose Deaths by Drug or Drug Class,” Provisional Drug Overdose Death Counts, National Center for Health Statistics, Center for Disease Control and Prevention, accessed August 21, 2018, https://www.cdc.gov/nchs/nvss/vsrr/drug-overdose-data.htm.
[2] Authors’ analysis of data from “12 Month-ending Provisional Number of Drug Overdose Deaths by Drug or Drug Class,” Provisional Drug Overdose Death Counts, National Center for Health Statistics, Center for Disease Control and Prevention, accessed August 21, 2018, https://www.cdc.gov/nchs/nvss/vsrr/drug-overdose-data.htm.
[3] Author’s analysis of data from “Data Brief 294. Drug Overdose Deaths in the United States, 1999-2016,” Figure 4, Centers for Disease Control and Prevention, https://www.cdc.gov/nchs/data/databriefs/db294_table.pdf.
[4] Deborah Dowell et al., “Contribution of Opioid-Involved Poisoning to the Change in Life Expectancy in the United States, 2000-2015,” JAMA, 2017;318(11):1065–1067, doi:10.1001/jama.2017.9308, https://jamanetwork.com/journals/jama/fullarticle/2654372.
[5] Author’s analysis of data from “12 Month-ending Provisional Number of Drug Overdose Deaths by Drug or Drug Class,” Provisional Drug Overdose Death Counts, National Center for Health Statistics, Center for Disease Control and Prevention, accessed August 21, 2018, https://www.cdc.gov/nchs/nvss/vsrr/drug-overdose-data.htm.
[6] Christopher J. Ruhm, “Deaths of Despair or Drug Problem?” National Bureau of Economic Research, January 2018, http://www.nber.org/papers/w24188.
[7] Ben Gitis & Isabel Soto, “The Types of Opioids Behind Growing Overdose Fatalities,” American Action Forum, April 11, 2018, https://www.americanactionforum.org/research/types-opioids-behind-growing-overdose-fatalities/.
[8] “The amounts of opioids prescribed per person was three times higher in 2015 than in 1999,” Center for Disease Control and Prevention, https://www.cdc.gov/vitalsigns/opioids/images/graphic-a-1185px.png.
[9] “Annual Surveillance Report of Drug-Related Risks and Outcomes, United States, 2017,” Center for Disease Control and Prevention, 2017, Supplemental Table 1, p. 75, https://www.cdc.gov/drugoverdose/pdf/pubs/2017-cdc-drug-surveillance-report.pdf.
[10] Lenny Bernstein and Scott Higham, “The DEA slowed enforcement while the opioid epidemic grew out of control,” The Washington Post, October 22, 2016, https://www.washingtonpost.com/investigations/the-dea-slowed-enforcement-while-the-opioid-epidemic-grew-out-of-control/2016/10/22/aea2bf8e-7f71-11e6-8d13-d7c704ef9fd9_story.html?utm_term=.9bbd639274de.
[11] Abby Alpert, David Powell, and Rosalie Liccardo Pacula, “Supply-Side Drug Policy in the Presence of Substitutes: Evidence from the Introduction of Abuse-Deterrent Opioids,” National Bureau of Economic Research, January 2017, http://www.nber.org/papers/w23031.
[12] Garrison Courtney, “New Rules Governing Internet Pharmacies Go Into Effect Next Week,” Drug Enforcement Administration, U.S. Department of Justice, April 13, 2009, https://www.dea.gov/pubs/pressrel/pr041309.html.
[13] “Use of Chronic Opioid Therapy in Chronic Non-Cancer Pain: Evidence Review,” The American Pain Society, http://americanpainsociety.org/uploads/education/guidelines/chronic-opioid-therapy-cncp.pdf.
[14] “Management of Opioid Therapy and Chronic Pain,” Clinical Practice Guideline, Department of Veterans Affairs and Department of Defense, May 2010, https://www.va.gov/painmanagement/docs/cpg_opioidtherapy_fulltext.pdf.
[15] Richard C. Dart, et al., “Trends in Opioid Analgesic Abuse and Mortality in the United States,” New England Journal of Medicine, January 15, 2015, http://www.nejm.org/doi/full/10.1056/NEJMsa1406143.
[16] Author’s analysis of data from “12 Month-ending Provisional Number of Drug Overdose Deaths by Drug or Drug Class,” Provisional Drug Overdose Death Counts, National Center for Health Statistics, Center for Disease Control and Prevention, accessed August 21, 2018, https://www.cdc.gov/nchs/nvss/vsrr/drug-overdose-data.htm.
[17] “Medications to Treat Opioid Addiction,” National Institute on Drug Abuse, January 2018, https://www.drugabuse.gov/publications/research-reports/medications-to-treat-opioid-addiction/overview.
[18] Theodore J. Cicero et al., “The Changing Face of Heroin Use in the United States,” JAMA Network, July 2014, https://jamanetwork.com/journals/jamapsychiatry/fullarticle/1874575.
[19] Abby Alpert, David Powell, and Rosalie Liccardo Pacula, “Supply-Side Drug Policy in the Presence of Substitutes: Evidence from the Introduction of Abuse-Deterrent Opioids,” National Bureau of Economic Research, January 2017, http://www.nber.org/papers/w23031.
[20] Author’s analysis of data from “12 Month-ending Provisional Number of Drug Overdose Deaths by Drug or Drug Class,” Provisional Drug Overdose Death Counts, National Center for Health Statistics, Center for Disease Control and Prevention, accessed August 21, 2018, https://www.cdc.gov/nchs/nvss/vsrr/drug-overdose-data.htm.
[21] Alan Krueger, “Where Have All the Workers Gone? An Inquiry into the Decline of the US Labor Force Participation Rate,” Brookings Papers on Economic Activity, Sept 7, 2017, p. 25, https://www.brookings.edu/bpea-articles/where-have-all-the-workers-gone-an-inquiry-into-the-decline-of-the-u-s-labor-force-participation-rate/.
[22] Ben Gitis, “A Menu of Options to Grow the Labor Force,” American Action Forum, December 7, 2017, https://www.americanactionforum.org/solution/menu-options-grow-labor-force/.
[23] Alan Krueger, “Where Have All the Workers Gone? An Inquiry into the Decline of the US Labor Force Participation Rate,” Brookings Papers on Economic Activity, Sept 7, 2017, pp. 48-54, https://www.brookings.edu/bpea-articles/where-have-all-the-workers-gone-an-inquiry-into-the-decline-of-the-u-s-labor-force-participation-rate/.
[24] Ben Gitis, “State-by-State: The Labor Force and Economic Effects of the Opioid Crisis,” American Action Forum, September 2018, https://www.americanactionforum.org/project/opioid-state-summary/.
[25] For a detailed explanation of the methodology, please see Ben Gitis, “State-by-State: The Labor Force and Economic Effects of the Opioid Crisis,” American Action Forum, September 2018, https://www.americanactionforum.org/project/opioid-state-summary/.
[26] Note that these results differ from a previous American Action Forum Report (Ben Gitis and Isabel Soto, “The Labor Force and Output Consequences of the Opioid Crisis,” American Action Forum, March 27, 2018, https://www.americanactionforum.org/research/labor-force-output-consequences-opioid-crisis/) and from Dr. Krueger’s report (Alan Krueger, “Where Have All the Workers Gone? An Inquiry into the Decline of the US Labor Force Participation Rate,” Brookings Papers on Economic Activity, Sept 7, 2017, p. 25, https://www.brookings.edu/bpea-articles/where-have-all-the-workers-gone-an-inquiry-into-the-decline-of-the-u-s-labor-force-participation-rate/). Since the previous report, American Action Forum discovered an error in Dr. Krueger’s interpretation of his own results. Correcting for this error derives a larger estimated opioid-induced decline in the prime-age labor force participation rate. For a detailed description of the error and how it is corrected, please see Ben Gitis, “State-by-State: The Labor Force and Economic Effects of the Opioid Crisis,” American Action Forum, September 2018, https://www.americanactionforum.org/project/opioid-state-summary/.
[27] The distribution of lost employees by establishment size in 2015 is derived by assuming that the distribution of the decline in employment by establishment size matches the distribution of all employees by establishment size in 2015. The distribution of employees by establishment size was derived from the Bureau of Labor Statistics’ Quarterly Census of Employment and Wages, https://www.bls.gov/data/.
[28] The sum of the total number of lost employees is slightly lower than the total number of lost workers reported in Table 1 (1.9 million versus 2 million). The analysis assumes that had the absent prime-age workers been in the labor force, they would have experienced the same unemployment rate as all prime-age workers in the labor force in 2015.
[29] For a detailed explanation of the methodology, please see Ben Gitis, “State-by-State: The Labor Force and Economic Effects of the Opioid Crisis,” American Action Forum, September 2018, https://www.americanactionforum.org/project/opioid-state-summary/.
