Weekly Checkup
March 12, 2021
The Impending Debate Over Territorial Medicaid Programs
Next week the House Energy and Commerce Health Subcommittee is set to hold a hearing on territorial Medicaid programs. This policy area is one you’re likely to hear more about as the year progresses because the territories—American Samoa, the Commonwealth of the Northern Mariana Islands (CNMI), Guam, Puerto Rico, and the U.S. Virgin Islands (USVI)—are all facing substantial reductions in federal Medicaid dollars after September 30, 2021. Exactly how to move forward with these programs will be a matter of tense debate, but Congress should not ignore the real distinctions and problems with these programs and simply give them automatic, unlimited funding.
Territorial Medicaid programs differ from those of states and the District of Columbia (DC) in a number of ways. Most significantly, while Medicaid functions as an open-ended partnership between the federal government and states and DC, federal spending on territorial Medicaid programs is capped at a fixed dollar amount. Medicaid is still an entitlement in the territories, however, meaning the territories cannot simply cut off benefits, so each must pay for program costs above the cap with local dollars. Democrats are likely to argue for lifting the caps entirely as a matter of equity and fairness. But the situation is not quite that simple.
On the one hand, the caps have not actually constrained resources. Congress has regularly provided additional dollars to cover the territories’ overages, so the cap has historically had minimal impact on either federal or territorial spending. More recently, as part of the 2020 fiscal year (FY) spending package, Congress dramatically increased the cap itself on a temporary basis and then did so again as part of the Families First Coronavirus Response Act. Under current law, in the absence of those enhancements, FY 2021 federal spending on territorial Medicaid programs would have been capped at $441.5 million—with most of that, $383.7 million, allocated to Puerto Rico. Under current law, however, the cap has been increased to roughly $3.2 billion for FY 2021. None of the territories bumped against the enhanced caps in FY 2020, nor are they expected to in FY 2021. In short, enhancing the caps has worked well enough as a temporary measure to relieve pressure on the territories’ programs. Lifting the cap entirely and permanently is not necessary if Congress simply extends the enhanced cap past the end of the fiscal year.
On the other hand, there are a few reasons to be hesitant about lifting the caps permanently and treating the territories exactly like states for the purposes of Medicaid. First, all five territories have a variety of exceptions from standard Medicaid requirements. For example, most of the territories do not base eligibility on the federal poverty level, using local measures instead. And in the case of American Samoa, eligibility is not determined individually at all; rather, the federal government reimburses for all care provided in the territory in proportion to the population with income below 200 percent of the federal poverty level. Further American Samoa and CNMI are exempted from providing many mandatory Medicaid benefits, while Puerto Rico and USVI are simply noncompliant with providing the mandatory benefits.
Additionally, fraud has been a consistent problem with the territorial Medicaid programs, in particular in Puerto Rico where a number of arrests for Medicaid fraud have been made in recent years. Currently the Department of Health and Human Services Office of Inspector General is conducting two audits of Puerto Rico’s Medicaid program, with reports expected later this year. The current enhanced cap model also brings with it additional congressional oversight, which is crucial to correcting fraud problems in the various programs. If the cap is lifted, lawmakers will lose leverage to bring about needed improvements.
Congress will need to address funding for territorial Medicaid programs before the end of the fiscal year, but given the unique parameters of each program and ongoing management and fraud challenges, Congress should be cautious about removing oversight and setting these programs on autopilot in the near term.
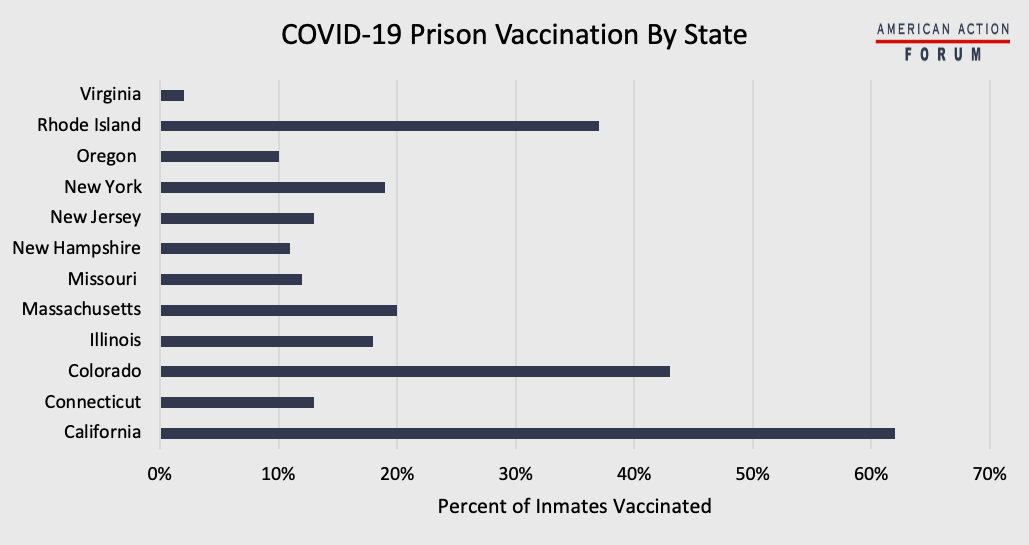
Chart Review: COVID-19 Prison Vaccination by State
Alexis Williams, Human Welfare Policy Intern
As of December 2020, 1 in 5 prison inmates in the United States had contracted COVID-19, and as of last week nearly 2,500 prisoners had died from the virus. Prisons can function as super spreader environments, and as they are hardly closed systems, outbreaks in prison systems can quickly spread to the surrounding community. In Erie County, PA, for example, 242 inmates and 8 guards contracted COVID-19 in the State Correctional Institution at Albion this month. Additionally, inmates themselves are uniquely at risk and less able to take precautions to prevent infection. Nonetheless, states have placed varying degrees of priority on vaccinating inmate populations. A number of states have begun vaccinating a portion of their total inmate population, although, as shown in the chart below, only three have vaccinated more than 20 percent of the incarcerated. A few states not listed in the chart have started their vaccine rollout but have administered only the first few doses to inmates. Other states have not started inmate vaccinations at all, including Arkansas, Florida, South Dakota, and Texas. Additionally, states such as Georgia, Idaho, Indiana, Iowa, and Tennessee have not reported vaccination Information for inmates.
Sources: COVID Prison Project
Tracking COVID-19 Cases and Vaccinations
Ashley Brooks, Health Care Policy Intern
To track the progress in vaccinations, the Weekly Checkup will compile the most relevant statistics for the week, with the seven-day period ending on the Wednesday of each week.
| Week Ending: | New COVID-19 Cases: 7-day average |
Newly Fully Vaccinated: 7-Day Average |
Daily Deaths: 7-Day Average |
|
March 10, 2021 |
67,163 |
528,430 |
1,484 |
|
March 3, 2021 |
62,764 |
832,670 |
1,931 |
|
Feb. 24, 2021 |
66,315 |
795,351 |
2,062 |
|
Feb. 17, 2021 |
76,731 |
704,669 |
2,688 |
|
Feb.10, 2021 |
103,563 |
660,520 |
3,010 |
|
Feb. 3, 2021 |
134,254 |
449,024 |
3,014 |
|
Jan. 27, 2021 |
161,827 |
314,242 |
3,297 |
Sources: Centers for Disease Control and Prevention Trends in COVID-19 Cases and Deaths in the US, and Trends in COVID-19 Vaccinations in the US
Note: The U.S. population is 330,128,931.
Worth a Look
Kaiser Health News: CDC’s ‘Huge Mistake’: Did Misguided Mask Advice Drive Up Covid Death Toll for Health Workers?
New York Times: More Childhood Lead Poisoning Is a Side Effect of Covid Lockdowns