Weekly Checkup
August 20, 2021
The Shifting Sands of Cost Shifting’s Evidence
We all know the story: Public health spending is out of control – trust funds on the verge of bankruptcy, federal health spending a quarter of our budget and growing – so now is the time to set limits on what our health safety nets pay providers! But wait – if we cut Medicare and Medicaid spending, providers will just shift the costs to private payers, so most taxpayers are ultimately no better off and end up paying more for health care. The fear of cost-shifting has hamstrung policymakers, but is this fear warranted?
Cost-shifting seems like common sense. If hospitals get paid less by one payer, they are going to charge more to another payer – in this case, private payers. They will do so especially if they are one of the 46 percent of rural hospitals with negative margins or 453 rural hospitals facing closure. In fact, cost shifting has been framed by some as a primary reason for increased private health costs.
Not so fast. A seminal 2011 study by Austin Frakt, a prominent critic of the hospital cost-shift theory, indicated that cost shifting is not “large and pervasive”; it can and does happen, but at low rates. A 2013 study found that a 10 percent reduction in the Medicare payment rate was associated with a 7.73 percent reduction in the private payer rate; hospitals made up the difference through reduction of operating expenses over time. A 2016 Medicare Payment Advisory Commission report found that hospitals with low private payer profits had a median standardized Medicare cost per case that was 9 percent lower than the national median and generated a positive Medicare margin of 6 percent. Hospitals with higher private payer profits had a 2 percent higher median cost per case than the national median while generating a Medicare margin of -8 percent; clearly, hospitals with higher private payer profits can let costs increase above what Medicare will reimburse for. These figures undermine the supposed link between decreased Medicare rates and increased private rates.
Does cost shifting exist at all, then? Well, maybe it does, but not how we think. A recent study published by Chernew, et al. in Health Affairs found that hospitals with a higher share of Medicare payments had worse financial performance and were more likely to close or be acquired. The authors posit that these closures and acquisitions, which lead to less competitive markets with higher prices for private payers, lead to a “consolidation-induced cost-shift.” Another theory was posited by a January 2020 report from the Colorado Department of Health Care Policy and Financing: Hospitals were shifting costs to private payers due to strategic business decisions, rather than a shortfall from public payers. The significantly larger increases in prices and profits relative to the increase in patient volume in Colorado suggested this shift.
In short, the research indicates that cost shifting does exist, but it’s unlikely to be nearly as prevalent and widespread as hospitals suggest. I wouldn’t be surprised to find that cost shifting occurs in instances where the Medicare margins are deep in the negatives. That said, the gap between the prices that providers charge public and private payers is massive and growing, with plenty of plausible reasons unrelated to deficient public insurance prices. The Chernew and Colorado studies cited above offer several compelling reasons, but labeling either business decisions or the natural result of market consolidation as “cost shifting” seems to stretch the definition of cost shifting as currently understood. The ultimate lesson from all this: The relationship between efforts to curb the growth of public health care dollars and increasing private insurance costs is not nearly as direct as we often assume.
Chart Review: Rural Hospital Closures
Jake Griffin, Former Health Care Policy Intern
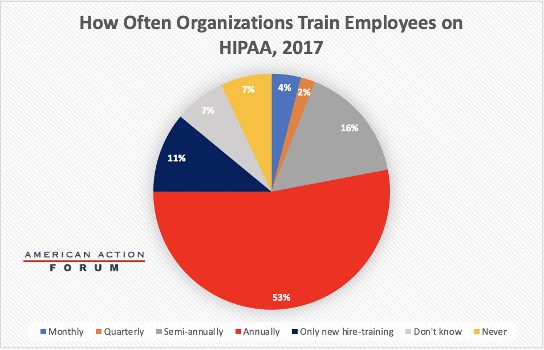
The pandemic and vaccination efforts brought the Health Insurance Portability and Accountability Act (HIPAA) to the forefront of the American health conversation, albeit mostly because it seems there’s a good deal of confusion over what exactly HIPAA covers. Confusion about public policy is not new, but HIPAA may be unique in that it is one of the few laws where widespread training on its requirements takes place. Covered entities and business associates are required to provide HIPAA training to employees who handle public health information, which include everyone from doctors to human resource managers. Although training is required, there is no detailed list of training requirements. Instead, the regulation states that training should be provided “as necessary and appropriate for members of the workforce to carry out their functions.” This flexibility in training allows covered entities and business associates to design HIPAA training that is tailored toward risks that their own employees face rather than a one-size-fits-all approach that is less relevant or useful. The chart below details how often organizations train their employees, with annually being the predominant timeframe.
Sources: Department of Health and Human Services
Tracking COVID-19 Cases and Vaccinations
Jackson Hammond, Health Care Policy Analyst
To track the progress in vaccinations, the Weekly Checkup will compile the most relevant statistics for the week, with the seven-day period ending on the Wednesday of each week.
| Week Ending: | New COVID-19 Cases: 7-day average |
Newly Fully Vaccinated: 7-Day Average |
Daily Deaths: 7-Day Average |
| 18-Aug-21 | 133,055 | 215,812 | 640 |
| 11-Aug-21 | 116,740 | 235,454 | 578 |
| 4-Aug-21 | 99,151 | 210,633 | 478 |
| 28-Jul-21 | 70,555 | 204,616 | 354 |
| 21-Jul-21 | 44,980 | 223,003 | 269 |
| 14-Jul-21 | 29,388 | 245,212 | 232 |
| 7-Jul-21 | 16,597 | 241,822 | 192 |
| 30-Jun-21 | 13,926 | 321,629 | 231 |
| 23-Jun-21 | 11,951 | 407,514 | 251 |
| 16-Jun-21 | 12,399 | 628,061 | 292 |
| 9-Jun-21 | 15,336 | 732,191 | 356 |
| 2-Jun-21 | 15,012 | 525,051 | 388 |
| 26-May-21 | 23,843 | 824,096 | 443 |
| 19-May-21 | 28,253 | 1,067,011 | 520 |
| 12-May-21 | 35,266 | 1,279,017 | 557 |
| 5-May-21 | 45,311 | 1,475,901 | 586 |
| 28-Apr-21 | 55,392 | 1,510,875 | 619 |
| 21-Apr-21 | 63,910 | 1,531,576 | 627 |
| 14-Apr-21 | 73,026 | 1,785,432 | 646 |
| 7-Apr-21 | 78,180 | 1,611,476 | 617 |
| 31-Mar-21 | 72,407 | 1,395,810 | 701 |
| 24-Mar-21 | 67,975 | 982,202 | 737 |
| 17-Mar-21 | 61,539 | 1,038,395 | 859 |
| 10-Mar-21 | 58,636 | 969,999 | 1,121 |
| 3-Mar-21 | 65,424 | 928,607 | 1,358 |
| 24-Feb-21 | 72,470 | 854,901 | 1,735 |
| 17-Feb-21 | 66,418 | 753,072 | 1,910 |
| 10-Feb-21 | 99,725 | 711,186 | 2,359 |
| 3-Feb-21 | 116,349 | 490,415 | 2,720 |
| 27-Jan-21 | 164,409 | 340,053 | 3,176 |
Sources: Centers for Disease Control and Prevention Trends in COVID-19 Cases and Deaths in the US, and Trends in COVID-19 Vaccinations in the US.
Note: The U.S. population is 332,647,827.
Worth a Look
Axios: COVID-19 hospitalizations are getting more expensive for patients
New York Times: Is an Exoskeleton Suit in Your Future?