


Research
April 12, 2016
Summary: “Accounting for the Rise in College Tuition”
Executive Summary
College tuition has been on a rapid ascent for several decades; since 1987, the average sticker price for going to college has more than doubled, even after adjusting for overall inflation. In the process, ballooning student debt has pushed higher education and financial aid policies to the forefront of political debate. We use a sophisticated analytic approach to identify the drivers of tuition growth. We find:
- The combined effect of all policy and non-policy factors we study generates a $6,300 increase in yearly net tuition.
- Of this, increased student borrowing facilitated by expansions in financial aid explains nearly $3,400, or over 50 percent, of the rise in tuition.
- More generous grant aid contributes $1,300 (over 20 percent) to the rise in tuition.
- Pressure on enrollment from the increased value of a college education is responsible for $1,250, or nearly 20 percent, of the increase in tuition.
Introduction and Background
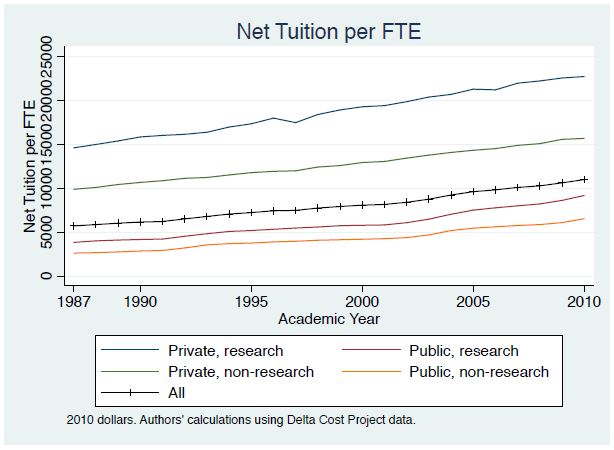
Fueling the angst of millions of parents and students across the country, college tuition has been on a rapid ascent for several decades. Since just 1987, the average sticker price for going to college has more than doubled, even after adjusting for overall inflation. Undoubtedly, colleges have used some of the revenue from higher sticker prices to fund more generous merit and need-based scholarships, but even after subtracting off this institutional aid, the resulting “net tuition” has risen by over 90 percent. More concretely, average net tuition has climbed from approximately $5,700 (adjusted for inflation in 1987 to approximately $11,000 today. Figure 1 shows that tuition has been on an upward trajectory for public schools, private schools, research-intensive universities, and teaching-oriented institutions alike.
Experts have proposed several hypotheses to account for this increase, emphasizing factors ranging from macroeconomic and labor market forces to dwindling state subsidies for public schools to expansions in financial aid. Our paper seeks to take a major step forward in shedding light on this debate by testing the importance of these competing explanations.
Figure 1. Net Tuition per FTE by Year and School Type
Competing Explanations
The Bennett Financial Aid Hypothesis
The country has witnessed several large expansions in financial aid over the past 25 years. The federal government increased annual and aggregate limits for subsidized Stafford loans in 1987 and then again in 1992. The Higher Education Amendments of 1992 also created a program of supplementary unsubsidized Stafford loans and lifted the cap on annual parent PLUS loans. Overall, inflation-adjusted aggregate borrowing limits increased from $26,200 in 1987 (for those with access to subsidized loans) to $40,800 in 2010 (essentially, for everyone). In short, students now have much greater capacity to go into debt to finance college than ever before. In a famous 1987 New York Times Op-Ed titled “Our Greedy Colleges,” then Secretary of Education William Bennett asserted that “increases in financial aid in recent years have enabled colleges and universities blithely to raise their tuitions.”
More so than any other factor, our findings suggest that expansions in financial aid drive the large increases in tuition. Although the federal government has increased financial aid spending ostensibly in response to higher tuition, these expansions have had the unintended consequence of fueling a significant fraction of the rise in college tuition. We find the increase in borrowing limits has generated 54 percent of the observed rise in tuition since 1987, which amounts to nearly $3,400 in yearly tuition. More generous grant aid has contributed an additional $1,300 to yearly tuition bills. In both cases, we find the biggest increases near the bottom of the tuition distribution (recall that students face different prices), which provides further evidence in favor of the Bennett hypothesis.
Through its impact on tuition and admissions policies, expanding financial aid has theoretically ambiguous effects on enrollment. In particular, even if $1 in additional aid increases tuition by less than $1, colleges may change their admissions selectivity to crowd out certain types of students. Our results suggest that, on balance, expansions in student loans have pushed up enrollment rates by 3 percentage points.
Aside from these effects on tuition and enrollment, we find that the expansion in borrowing limits has profoundly impacted the amount of student debt and default. Had these expansions not occurred, yearly student debt would be nearly $2,100 lower, the ratio of students barrowing and the amount they barrow would be 26 percent lower, and the two-year default rate would be cut by more than half. At the same time, colleges would spend $3,600 less per year on activities they deem as quality enhancing.
Our results do not directly yield welfare conclusions. It is left to the reader to judge whether greater spending on activities deemed quality-enhancing by colleges and enrolled students is worth the increased cost and future debt burden.
The Growing College Earnings Gap
From the mid-1980s to today, college graduates have gone from earning on average $1.60 for every $1 earned by non-graduates to almost $2 today. As a result, even with the renewed interest for vocational and technical education and other two-year programs, average labor market returns to a four-year degree are at an all-time high.
We find substantial evidence that growing pressure to acquire a college degree has fueled an increase in demand that explains a significant proportion of the rise in tuition since 1987. In particular, even if no other changes had occurred to higher education, the rise in the college earnings premium from $1.60 to $2 would have fueled a 20 percent increase in inflation net tuition. That figure amounts to $1,300 out of the $6,300 increase in yearly tuition. At the same time, annual earnings are nearly $3,000 higher because of this labor market trend.
Baumol Cost Disease
Baumol Cost Disease is a popular theory for why tuition has increased. In a higher education context, the theory says that in order to hire and retain quality faculty, staff, and administrators, colleges must pay ever higher salaries. The cost of these higher salaries, as the theory goes, is then passed on to students in the form of higher tuition.
Our analysis does not suggest a strong role for Baumol Cost Disease, even though we do find evidence of adverse changes to the underlying university cost structure. This apparent discrepancy highlights the importance of the nature of the change in underlying costs for explaining the pass-through into tuition. In the data, fixed costs for colleges—those that do not vary with the number of students—have dwarfed changes to variable costs. This composition matters because the model predicts that colleges respond to an increase in fixed costs by reducing spending on quality-enhancing activities, which also drives down average student ability and makes it difficult for colleges to charge high tuition. In fact, if the observed changes in the cost structure were the only change to hit the higher education market, the model predicts that inflation-adjusted net tuition would have actually declined modestly since 1987.
Reductions in State and Local Funding
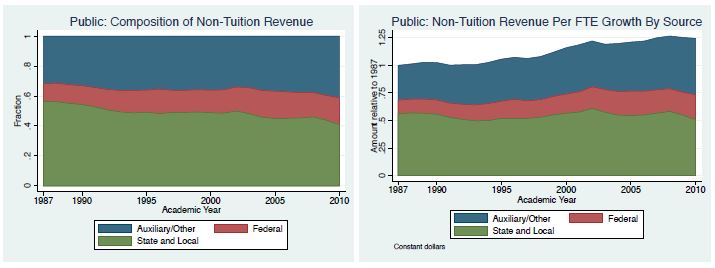
The last explanation we study ties tuition increases at public universities to reductions in state and local funding—from $8,200 per student in 1987 to $7,300 in 2010—for higher education (but recall that tuition has increased at all college types). In 1998, Congress commissioned a study during its re-authorization of the Higher Education Act that ended up attributing a sizable fraction of the increase in public university tuition to these cuts.
We take a broader look at this hypothesis by incorporating changes to all sources of non- tuition revenue over the past few decades, as shown in Figure 2. We find that these changes have had little impact on tuition and enrollment. Instead, we find that cuts in state funding show up more as reductions in quality-enhancing expenditures than in higher tuition.
Figure 2. Composition and Growth in Non-Tuition Revenue Per FTE
Appendix: The Approach and Model
The objective of our paper is to assess the degree to which federal financial aid policies, labor market trends, and other changes to college funding sources explain the rise in college tuition. We depart from much of the existing literature that takes a purely empirical approach. For example, many people highlight the fact that student debt and tuition have risen alongside each other. However, that correlation fails to prove causation. Is higher student debt merely a symptom of higher tuition, or is debt fueling the increase in college costs? Some authors have gone a step further and looked for “natural experiments” that mimic what scientists attempt to do in a lab to undertake controlled experiments. However, while such an approach has proven valuable to answering a variety of micro-level questions, it is not feasible to use here, given the scope of rising tuition as a country-wide and multi-decade long phenomenon.
Instead, we construct a cutting-edge economic model with a rich higher education sector and labor market that, when simulated on a computer, mimics several salient features of the U.S. economy. We first check that this “computer laboratory,” which is explained below, behaves in a manner consistent with data on student, college, and worker behavior. Once we are confident in the model, we use it to answer counterfactual questions such as, “How much would tuition have increased had the government not expanded financial aid?”
In our model, students make the decision of whether or not to attend college based on total cost, parental resources, financial aid, and of course, the quality of the college and the likely impact of having a college degree on future earnings. Importantly, students in the model take into account the 50 percent chance that they end up dropping out with debt but no degree. If they graduate, however, they expect to earn 60 percent more than non-graduates in our 1987 baseline simulation—a number that rises to 100 percent in 2010. Workers in the model make decisions about how much to work, save, and spend, and those with student debt choose whether to make on-time payments or to enter delinquency with its associated penalties. During the counterfactual experiments, we feed in different permutations of the observed changes to the financial aid system, expected wages, etc., to see how they affect students’ willingness to attend college and how they plan to finance their education. We also look at how the loan repayment behavior of workers responds. Naturally, the college’s response to the observed changes looms large for all of these decisions.
The college in the model attempts to maximize “quality,” as measured by a function that aggregates resources spent per student with the average academic ability of the student body. Furthermore, unlike in introductory textbook models of supply and demand, colleges have the ability to charge different prices to different students, i.e. to engage in price discrimination. In the context of higher education, colleges use differential pricing to attract the most academically qualified students possible. As a result, low income, high ability students face the lowest net tuition, which is equivalent to saying that the institution provides these students the most generous discounts off of sticker price. The college then combines all resulting tuition revenues with money from other sources (e.g. direct state and federal government financial support) to cover operating costs and to fund quality-enhancing expenditures. Our assumption that colleges maximize quality—in line with what noted education expert Charles Clotfelter calls the “pursuit of excellence”—implicitly incorporates another prominent hypothesis for rising tuition: Howard Bowen’s “Revenue Theory of Costs.” Ronald Ehrenberg, another noted education scholar, refers to this college behavior as an “arms race of spending.” Students benefit from the increased amenities and services, but it is unclear whether the spending is worth the increased cost and student debt. Our paper explains the model in more depth and caveats for our results.
Figure 3. Comparison of Model and Data Over the Transition
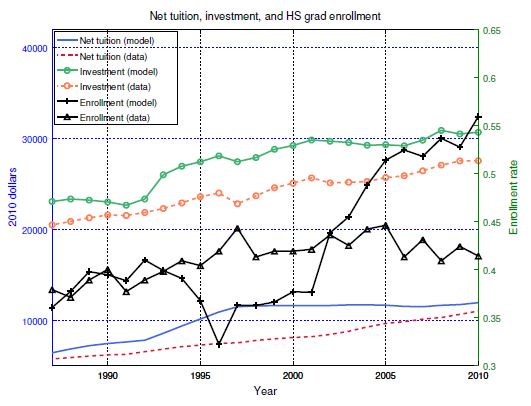
We assess the model’s validity by testing its predictions. When we input the observed dynamics of the college earnings premium, changes to financial aid policy and non-tuition revenues, and modifications to the college’s cost structure for non-quality-enhancing expenditures, our model successfully replicates the dramatic rise in tuition over the past 25 years. This can be seen in figure 3 that displays the model’s predictions for enrollments, expenditures (labeled investment), and net tuition alongside the data. However, as with every model that simplifies reality, it does not replicate the data exactly. In particular, whereas net tuition increased at almost a constant rate during this entire period, the model predicts a period of accelerated tuition increases in the mid-to-late 1990s followed by more stagnant tuition growth. Nevertheless, given the realities of the inertial tuition-setting process and slowly evolving household expectations, we view the model’s ability to match the aggregate tuition change as a success. The model also emulates the spending “arms race” observed in the data and predicts the increase in college enrollment. In fact, stagnant tuition in the model after the year 2000 generates excessive enrollment growth in that period.
About the Authors
Grey Gordon, Department of Economics Indiana University
rggordon@indiana.edu
Aaron Hedlund, Department of Economics University of Missouri
hedlunda@missouri.edu