Research
February 2, 2017
Practicality of Private Sector Funded Infrastructure
Summary
- As policy interest in significant new transportation infrastructure investments increases, so do questions about the feasibility of significant private sector funded infrastructure partnerships.
- Urban areas are likely to benefit from increases in private sector contributions to infrastructure spending due to higher road usage.
- In 2014, urban roads had the highest traffic volume with 70 percent of total vehicle miles on only 31 percent of total lane (physical road) miles.
- In 2014, 19.9 percent of urban roads and 3.4 percent of rural roads did not meet FHWA standards for road quality.
- Reducing the congestion of roads with heavy truck volume would have national economic benefits since goods transported by truck accounted for more than 70 percent of the value and weight of all freight shipments in 2012.
Introduction
Modernizing America’s infrastructure is a key plank in the next Administration’s economic platform, and transportation infrastructure should be central to this effort. The case can be made that American roadways are inadequate, even as there are more vehicles on the road than ever. The consequence is congested roads and poor road quality. However, President Trump’s plan relies heavily on private sector finance; specifically leveraging less than $200 billion in federal funds for $800 billion in private funds. (Then-candidate Hillary Clinton similarly proposed establishing an infrastructure bank involving the private sector.) Is it feasible to modernize the surface transportation network without greater taxpayer involvement?
One apparent limitation is the need for a dedicated revenue stream to provide the private sector returns to fund an infrastructure project. Upon reflection, however, the most likely candidates for increased private sector participation are the urban roads bearing the most vehicle traffic, and thus having the potential to generate enough toll or congestion-pricing revenues to offset costs.
This paper puts some empirical meat on this observation, using road transportation data to identify the seemingly most promising locations for additional private participation. We also document those places that currently benefit from private sector capital financing.
To preview the results, we find that taxpayer seed money looks most likely to draw private sector financing of congested roadways in urban areas, and that there is likely a national transportation benefit from those investments. However, we also document some connectivity priorities that would best be financed using traditional taxpayer approaches.
Urban Road Usage
We begin with a snapshot of the national-level data. Figure 1 shows the underpinnings of the fact that urban roads are consistently more congested than rural roads. Urban roads contribute to 70 percent of total vehicle miles but only 31 percent of total lane miles (or total road length and lane count of roadway). This high ratio of vehicle miles to lane miles is explained by the fact that a clear majority of the population lives in urban areas; the urban population was 80.7 percent of the total population in 2010.[1]
Figure 1: Urban Share of Total Vehicle and Total Lane Miles (1980-2014)
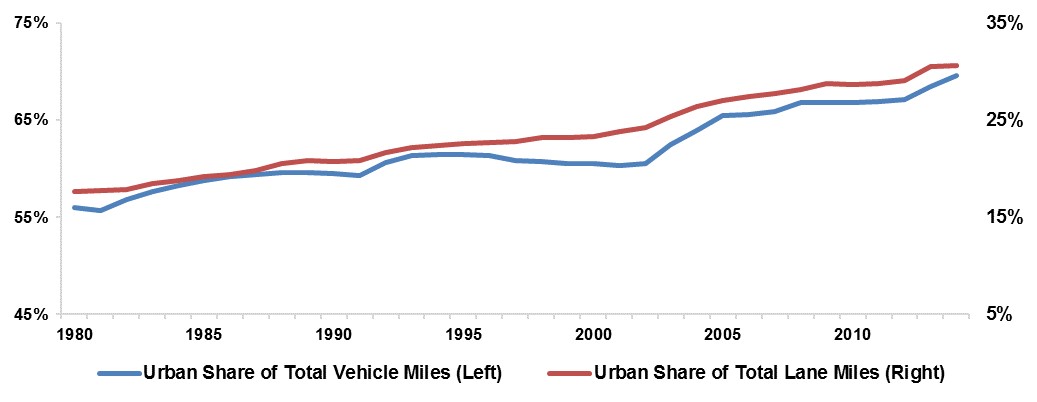 Source: Highway Statistics Series[2]
In 34 years, the urban share of total driving increased 14 percentage points. The increase in demand for urban roads in turn compelled the urban share of total lane miles to increase 13 percentage points. The increase in urban lane miles will likely continue if current proposals are enacted and the construction of new routes and the expansion of old roads occurs.
However, not all urban traffic is equal and congestion is not uniform. Thus, areas with the highest road congestion will benefit the most from investment, and these are the most attractive areas for private sector resources and management.
Urban Congestion and Investment
The Average Annual Daily Traffic (AADT) data for U.S. roads is collected by the Highway Public Monitoring System. This is a measure of the volume of vehicle traffic on highways or roadways on an average day, which is collected to help determine funding for the highways. An AADT greater than 50,000 signifies heavy road traffic volume; i.e., 50,000 vehicles travelling either direction on a road on an average day. High AADT are the most attractive areas for private sector investment since the potential for revenue generated from user fees is the largest.
Figure 2: 2015 Average Annual Daily Traffic (AADT)

Source: Highway Public Monitoring System[3]
Figure 2 shows the U.S. roads with high volumes of traffic with the areas shaded in blue having the highest volume—AADT greater than 250,000. As one might expect the roads with the highest traffic volume are in the regions with the largest urban population: New York City, Los Angeles, Chicago, and so forth. The marked areas on the map are roads that seemingly could generate enough toll revenue to fund maintenance and operation fees.
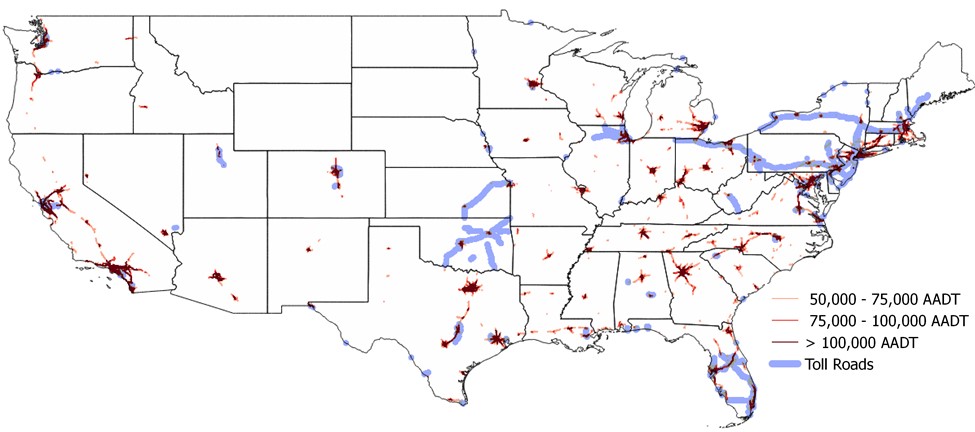
Figure 3 shows the roads in the U.S. that currently have tolls (highlighted in blue), which are disproportionately high-AADT thoroughfares. This supports the notion that primarily the high traffic volume areas can support toll roads.
Figure 3: 2015 AADT and Toll Roads
Source: Highway Public Monitoring System[4]
There are a few examples of tolls in less congested areas. For example, the two bridges on the border between Oregon and Washington (Bridge of the Gods and Hood River Bridge) average less than 10,000 daily drivers. Although these bridges were initially built and owned by private companies, the bridges are currently owned and operated by the municipality which means that funding can come from other sources in addition to the tolls. These bridges are no longer as compatible for private contribution as other roadways.
There are existing examples of private investment on toll roads. For example, the Virginia SR 895 (Pocahontas Parkway) is a build-operate-transfer (BOT) public-private partnership. In this partnership, the private entity receives a concession to finance, design, construct, and operate the road. The current private entity is Transurban which acquired a 99-year concession in 2006. California, Florida, Indiana, and Texas are a few other states in addition to Virginia that have experimented with BOT partnerships.
Urban Road Quality
The next step in this feasibility analysis is to examine the quality of the congested roadways. To do so, we employ the International Roughness Index (IRI). The IRI measures the cumulative distance that a laser pointed at the road jumps as it is driven on that road. The IRI is calculated in inches per mile and a higher IRI is highly correlated with a rougher road. Roads with above 170 in/mi IRI are not acceptable by Federal Highway Administration (FHWA) standards and at an IRI above 500 in/mi, vehicles need to reduce speed to accommodate for the road conditions.[5] In the following figure, the yellow lines represent areas with roads between 170 and 500 in/mi and the red lines represent areas with roads greater than 500 in/mi.
Figure 4: 2015 Road Quality[6]
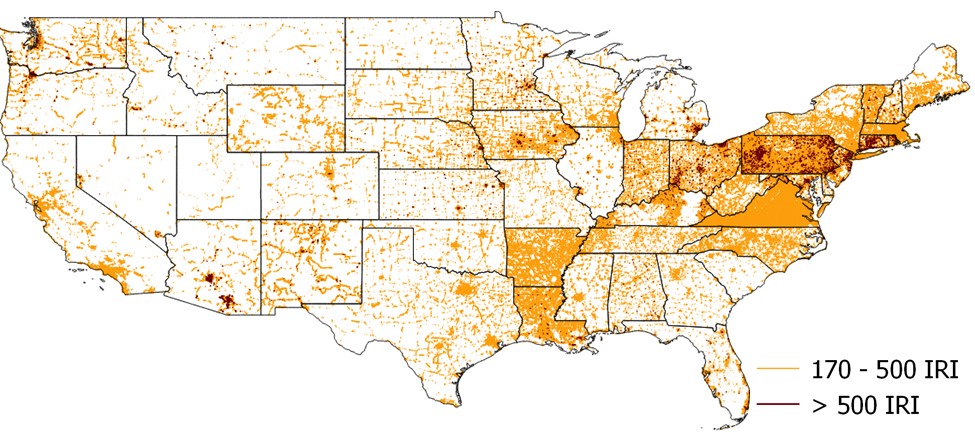 Source: Highway Public Monitoring System[7]
Figure 4 shows that almost every state has an excess of roads that are not at acceptable standards. According to the Highway Statistics 2014, 10.2 percent of the U.S. roads are not acceptable by FHWA standards. In 2014, 19.9 percent of urban roads and 3.4 percent of rural roads did not meet FHWA standards.[8] By this metric, the urban areas are once again more appealing for targeting private financing of future projects. Partnering with private sector entities is a viable method to address road quality issues by creating incentives to ensure the private entity maintains the roads. Local areas can benefit from improving these roads by minimizing rush hour delays and preventing further damage to roads that are costlier to repair in the future.
The reliance on local private sector finance is consistent with the fact that the federal government is not responsible for quality control of most of the damaged roads; this is appropriately a matter for states and localities. The scope of federal involvement should be restricted to projects that promote national connectivity and national or regional benefits. Unless the damaged road satisfies this, the state or local governments should be responsible for maintenance.
Investments with National Economic Benefits
The previous sections discussed the types of roadways that might see private sector involvement due to potential for a revenue stream and demand for road improvements. This next section shows areas that the federal government should consider for road projects due to the national economic benefits. These are the areas that affect truck mobility.
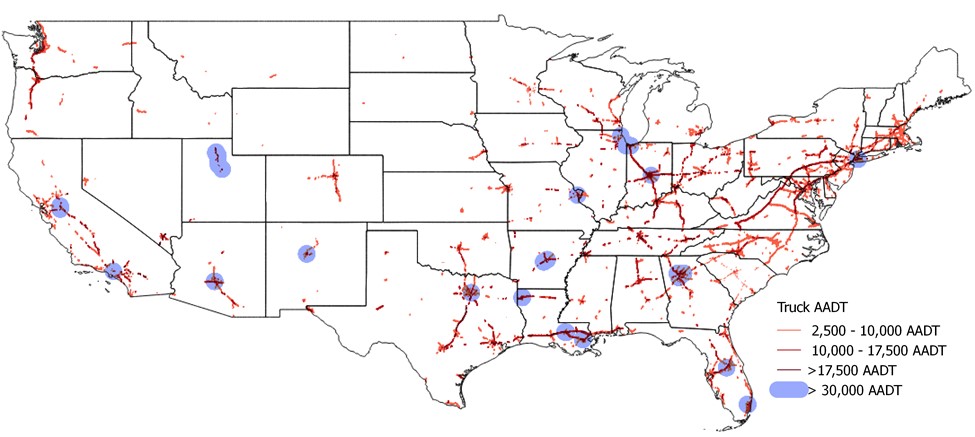
Figure 5 shows Truck AADT when travelling on roads with greater than 15,000 AADT per lane. These are the roads that see high truck volume and have lane-level congestion which causes delays in shipment times.
Figure 5: 2015 Truck AADT on High Traffic Lanes[9]
 Source: Highway Public Monitoring System[10]
Figure 5 shows the roads that would benefit the nation’s economy by creating alternative routes or road expansions to decrease road congestion. A shipping system with fewer delays and enhanced throughput should be a priority of any transportation plan. Trucks transport more than 70 percent of the value and weight of total freight shipments reported by the 2012 Commodity Flow Survey.[11] Cutting down on shipment times and costs would have trickle-down benefits to many businesses regardless of location.
Active TIFIA Projects
Private sector involvement in projects of regional and national significance is not a new concept. The Transportation Infrastructure Finance and Innovation Act (TIFIA) enacted in 2015 leverages Federal funds by attracting private and state and local government co-investment to improve the surface transportation system. Each of these projects have dedicated revenue sources such as toll revenues, user charges, and availability payments—payments from state or local governments to the managing entity for when the infrastructure is available for use. Figure 6 highlights the locations of the 37 active TIFIA road projects found in 16 states compared to the roads with high traffic volume.
Figure 6: 2015 AADT and Active TIFIA Projects
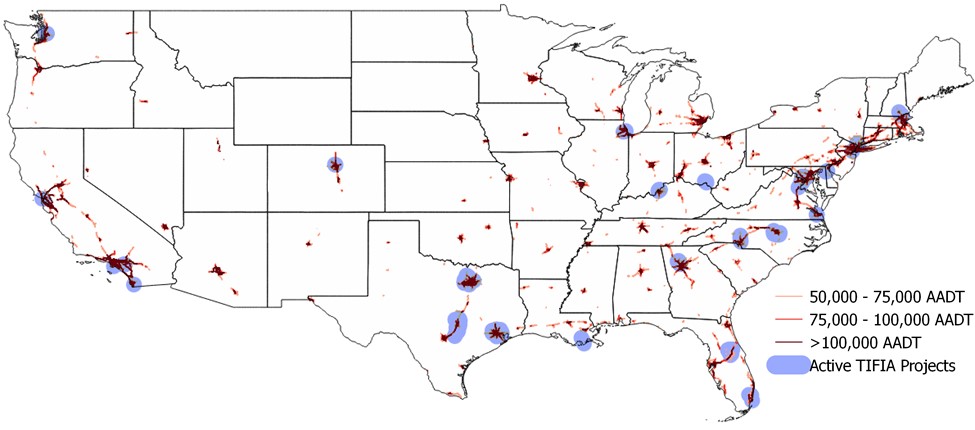 Source: Highway Public Monitoring System[12]
As seen in figure 6, almost every active TIFIA road project is found in a high road volume region. The two projects in Ohio and Louisiana that are not in especially high volume areas are creating new routes or replacing damaged ones. This supports the previous argument that additional private sector financing and management will likely funnel into high traffic areas. Although these urban areas have a smaller share of U.S. roads, these are the areas that will yield the highest benefit for cost.
Conclusion
Increased private sector involvement in federal infrastructure can be beneficial if the projects align with national connectivity and broad ranging benefits. That said, urban areas are the most attractive for private sector involved projects. The private sector alone cannot make the necessary improvements to the nation’s infrastructure problems but can be a powerful tool if employed correctly.
[1] 2010 Census of Population and Housing, http://www.census.gov/prod/cen2010/cph-2-1.pdf
[2] Highway Statistics 2014, “Table 4.2.5. Public road lane-miles by functional system, 1980 – 2014;”
“Table 5.2.1 Vehicle-miles of travel, by functional system, 1980-2014,” https://www.fhwa.dot.gov/policyinformation/statistics/2014/
[3] Highway Public Monitoring System, http://www.fhwa.dot.gov/policyinformation/hpms/shapefiles.cfm
[4] Ibid.
[5] FHWA Study to Assess Highway Infrastructure Health, “2.1 PHASE I MILESTONES” https://www.fhwa.dot.gov/asset/health/phase100.cfm
[6] Road roughness measured by International Roughness Index with the yellow lines between 170 and 500 IRI and the red lines greater than 500 IRI.
[7] Highway Public Monitoring System, http://www.fhwa.dot.gov/policyinformation/hpms/shapefiles.cfm
[8] Highway Statistics 2014, “Table 13.3.2. Length by measured pavement roughness, NHS,” https://www.fhwa.dot.gov/policyinformation/statistics/2014/
[9] Roads with greater than 15,000 AADT per lane.
[10] Highway Public Monitoring System, http://www.fhwa.dot.gov/policyinformation/hpms/shapefiles.cfm
[11] Bureau of Transportation Statistics, “American Industry Shipped 11.7 Billion Tons of Goods in 2012,” http://www.rita.dot.gov/bts/press_releases/bts055_13
[12] Highway Public Monitoring System, http://www.fhwa.dot.gov/policyinformation/hpms/shapefiles.cfm;
Transportation Infrastructure Finance and Innovation Act, https://www.transportation.gov/tifia