


The Daily Dish
August 8, 2025
Immigration, Deportation, and the Labor Market
Eakinomics has devoted a fair amount of space to the impact of the president’s tariffs on the labor market, and the most recent readings of the labor market have focused policymakers on the state of the economy. But there is another pair of Trump Administration policies – immigration and deportation – that have had a substantial impact on the labor market as well.
One can get some insight into these issues by looking at the smaller household survey – the monthly survey used to measure the unemployment rate – as opposed to the larger establishment survey that provides the most reliable measure of job growth.
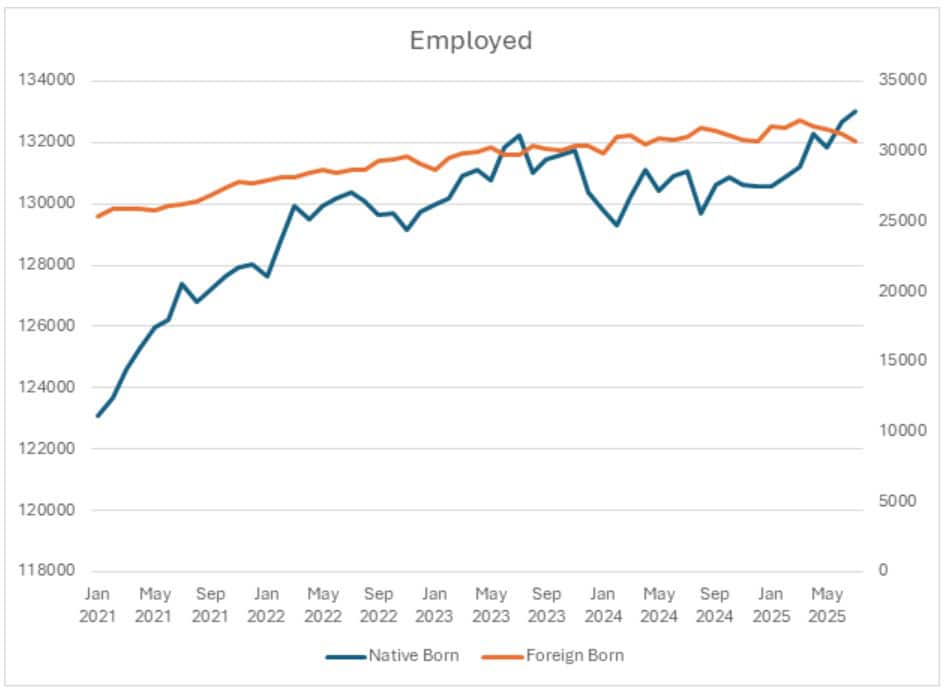
Recall that over the past three months, the establishment survey has indicated that non-farm employment has risen by only 106,000 jobs. In the household survey, over the same period, employment has fallen by 863,000 jobs. But there is a striking difference between the patterns of native-born and foreign-born individuals. As one can see in the chart (below), native-born employment (in blue) has continued to rise. Over the past three months it is up by 769,000 jobs. In contrast, employment among the foreign-born (in orange) has fallen by more than 1 million (down 1,039,000).
What is even more striking about the latter number is that the number of foreign-born individuals in the labor force has fallen only by 938,000. (For the native-born, it is up 1.9 million.) Yes, immigration is down. And, yes, deportations are up. But the decline in the employed is larger than their combined impact on foreign-born in the labor force.
There is one more aspect of the chart worth emphasizing. As drawn, it seemingly suggests that employment among the foreign-born has outstripped the native-born in recent years, with the native-born seeming to gain more jobs only with the arrival of the stringent immigration and deportation policies. This is wrong, and it is 100 percent because the native-born are measured on the left axis and the foreign-born on the right axis.
Extending the reach of deregulatory efforts may yield even more benefits in the future. Also, another executive order “directed agencies to: A) take a more expansive approach in how and why they rescind certain existing regulatory provisions, and B) be more aggressive in asserting ‘enforcement discretion’ to effectively provide regulatory relief to covered entities without going through the full rulemaking process.” This is harder to quantify but may be an important feature of the regulatory landscape in the remainder of the Trump presidency.
Eakinomics’ bottom line is that the jury is still out. One can’t make a slam-dunk numerical case for this deregulatory effort, but there is a lot of deregulatory work going on below the tip of this iceberg.
If one put them both on the same (left) axis, this is the chart:
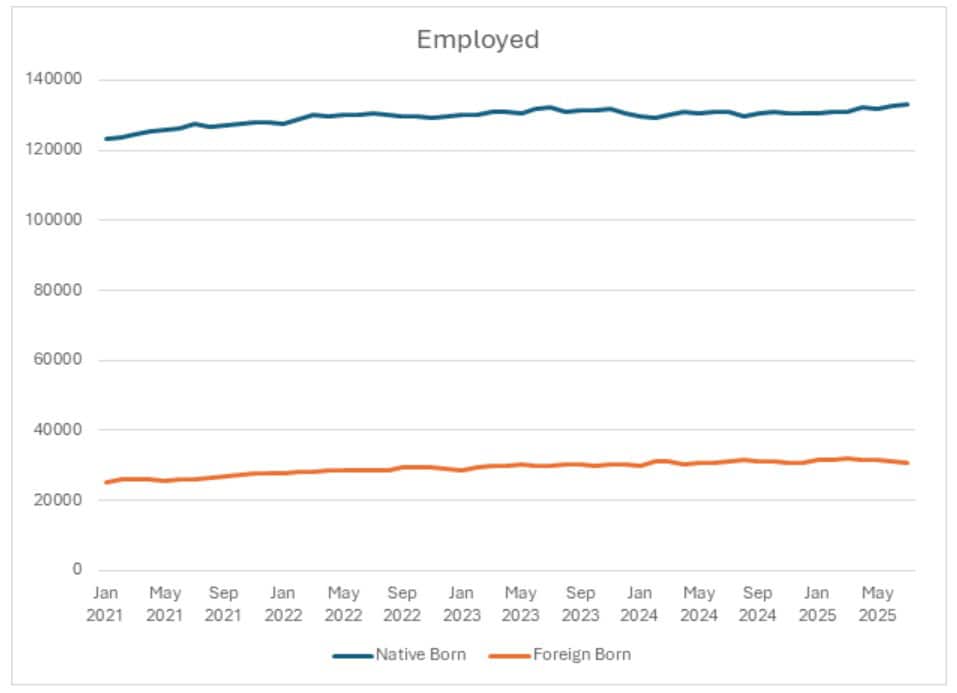
Don’t be misled. (The same illusion arises when one looks at growth rates.)
The tariff policies are unprecedented in the past 100 years. The sweeping nature of deportations, and the corresponding chilling effect on the labor force, are also unprecedented in modern experience. The implications for the growth of employment remain hard to anticipate.
Fact of the Day
Since January 1, the federal government has published $703.2 billion in total net regulatory cost savings and 85.5 million hours of net annual paperwork cuts.
