


The Daily Dish
September 6, 2022
Is the Labor Market Cooling?
Eakinomics hopes you had a great Labor Day weekend. If you can remember this past Friday, recall that the Labor Department released the employment report for August and Eakinomics was excited. It wasn’t just that Gordon the Guesstimator nailed his forecast of payroll employment. And it wasn’t just that top-line jobs growth slowed somewhat (from just over 500,000 to just over 300,000). No, it was that Eakinomics’ preferred indicator of labor demand (growth in aggregate weekly payrolls) cooled off to a 3.4 percent annual rate and the broadest indicator of labor supply (labor force and labor force participation) grew strongly – the labor force expanded by 786,000 and the labor force participation rate jumped 0.3 percentage points.
I don’t know about you, but when I get really good news, I graph it. So, shown below is the monthly growth, measured at an annual rate, of top-line jobs, payrolls, and the labor force during the Era of Biden’s Inflation (January 2021 to present). At the very right, one can see the uptick in supply growth exceeding the diminished demand growth.
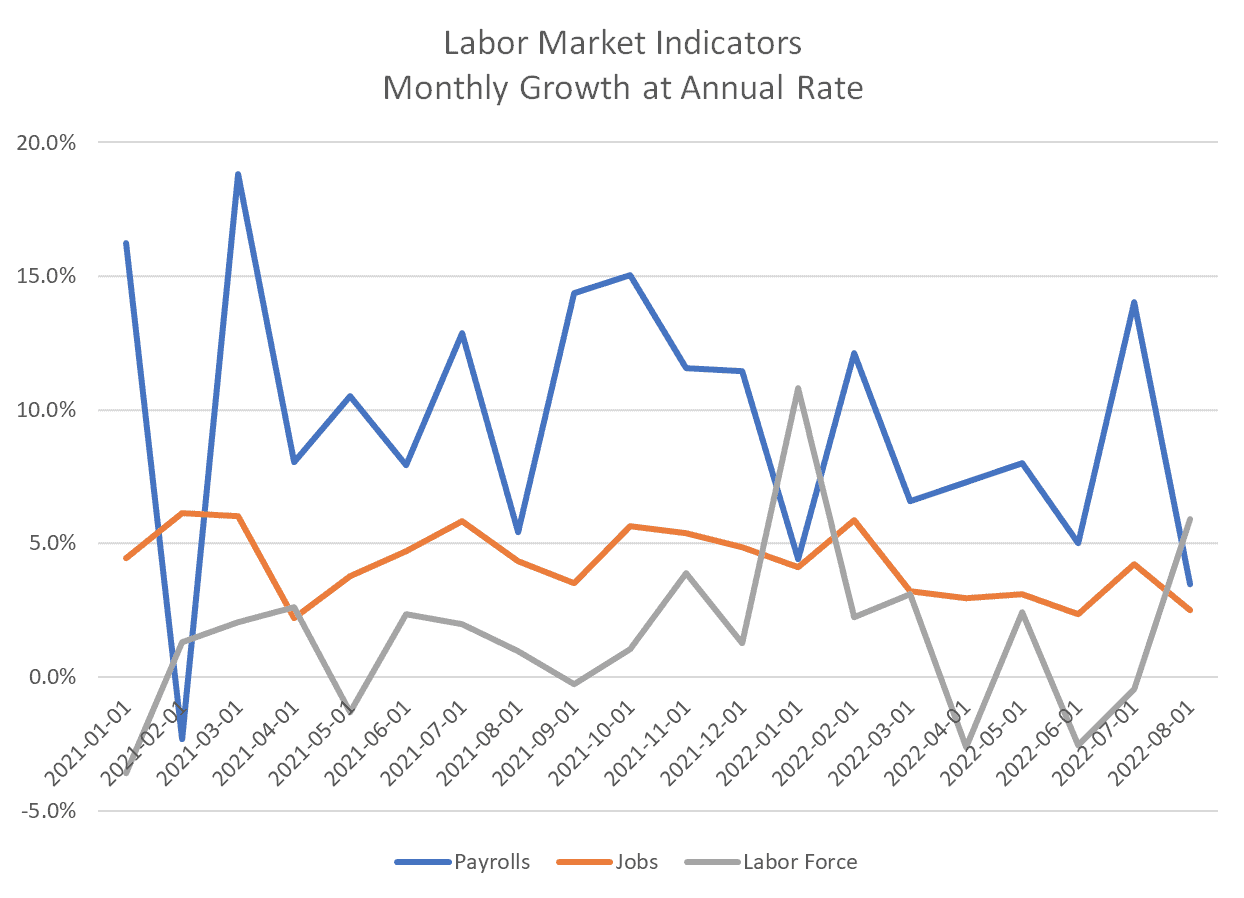
Presenting the data in this way, each point is the answer to the question: What would be the growth if this past month was repeated for a year?
But there is a catch. No month is repeated 12 times. Indeed, the very same chart shows that the month-to-month changes are highly erratic (“noisy”). A different way to present the data is to plot the year-over-year growth. This is shown below.
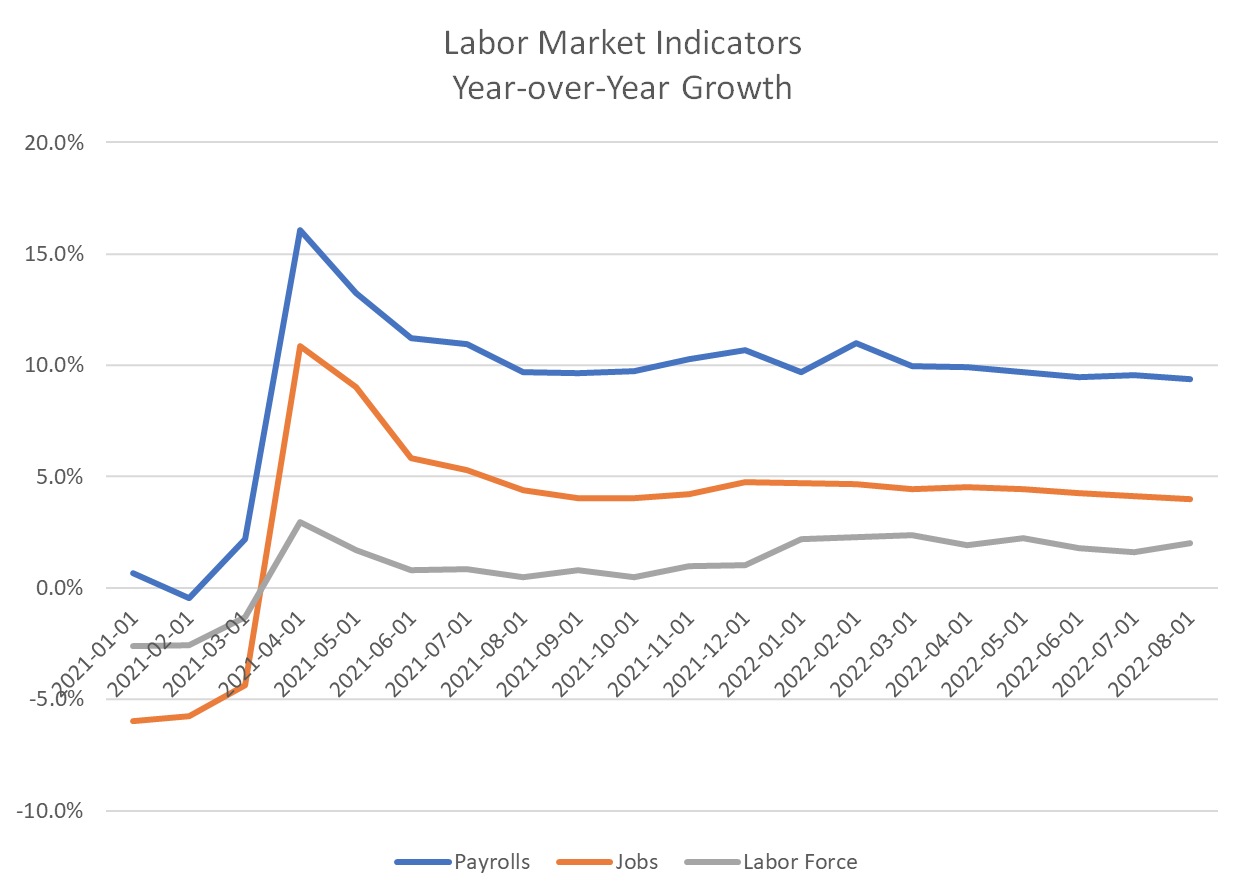
The difference is shocking and illuminating. There has been no significant change in these indicators in the past year. If you thought the labor market was too hot, it still is. There has been no sustained increase in labor force participation and little sustained decline in labor demand. For the same reason, there has been no real progress in fighting inflation.
Most of the monthly commentary is about the hopes or fears that would accompany the monthly noise if it was steadily repeated and should be ignored until it actually is repeated and the lines in the second graph move toward convergence.
Fact of the Day
The August U-6 (the broadest measure of unemployment) increased to 7.0 percent.
