The Daily Dish
April 2, 2026
Slow Growing but Resilient Job Market
U.S. employment growth is at a near standstill. In February 2026, total nonfarm payrolls grew by just 0.1 percent year over year to 158.5 million. While the pace is sluggish and decelerating, it is not yet collapsing despite several exogenous shocks ranging from tariffs and an immigration crackdown to the recent war in Iran. The labor market refuses to buckle.
The graph below illustrates this unique level of resilience. Historically, the pace of growth follows a particular pattern: a post-recession surge, a peak, a moderate cooling, and then a sharp plunge around the onset of a recession. Yet the post-pandemic period has defied this typical arc.
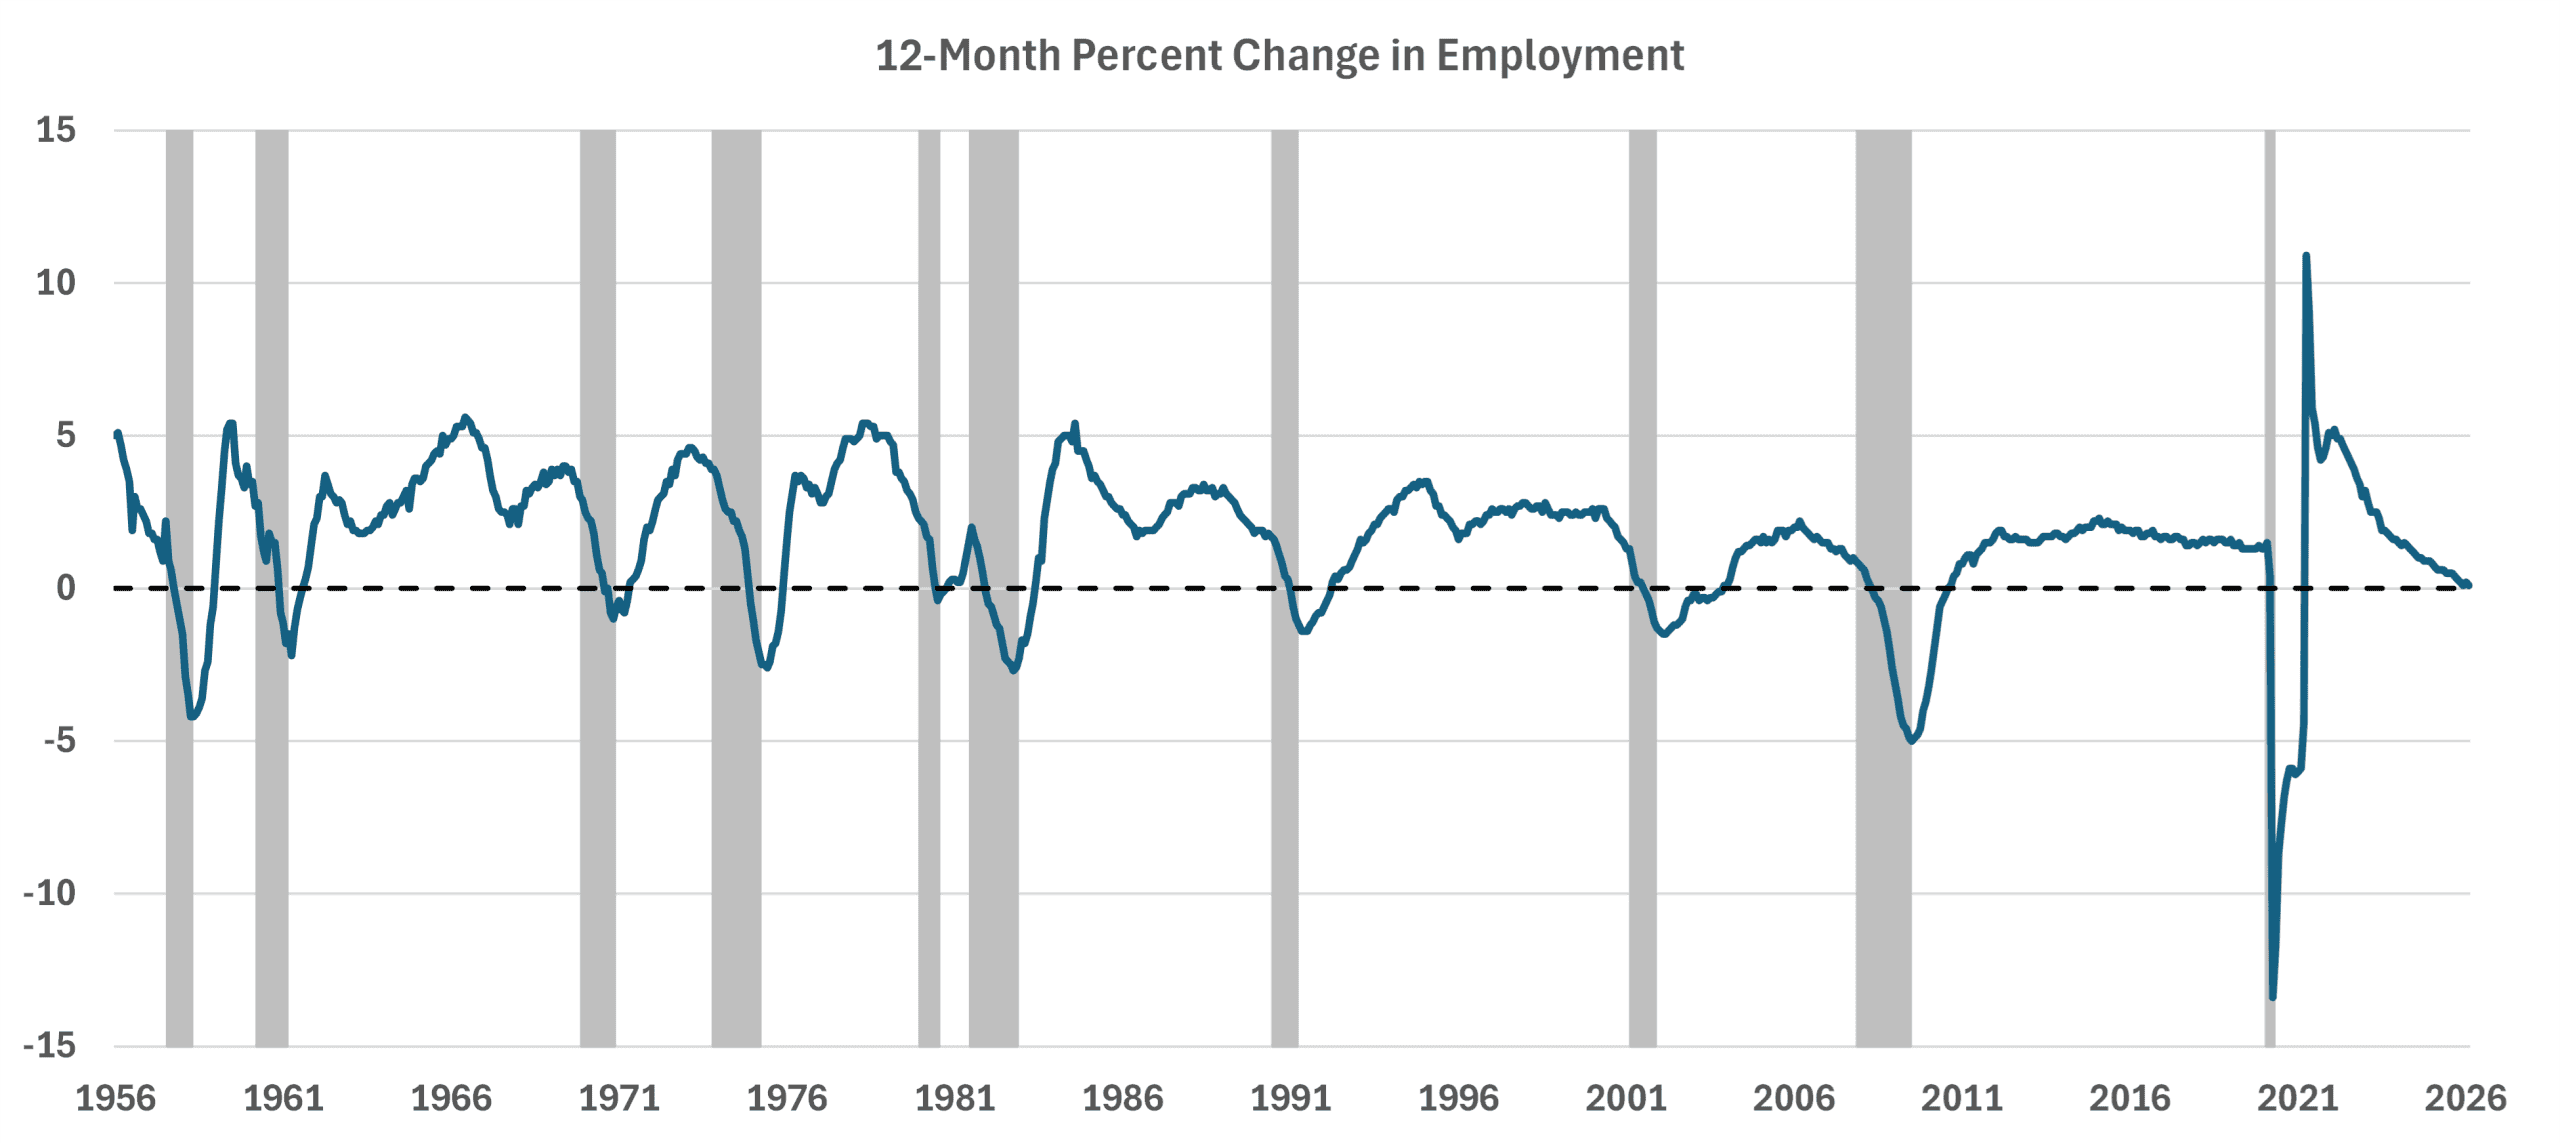
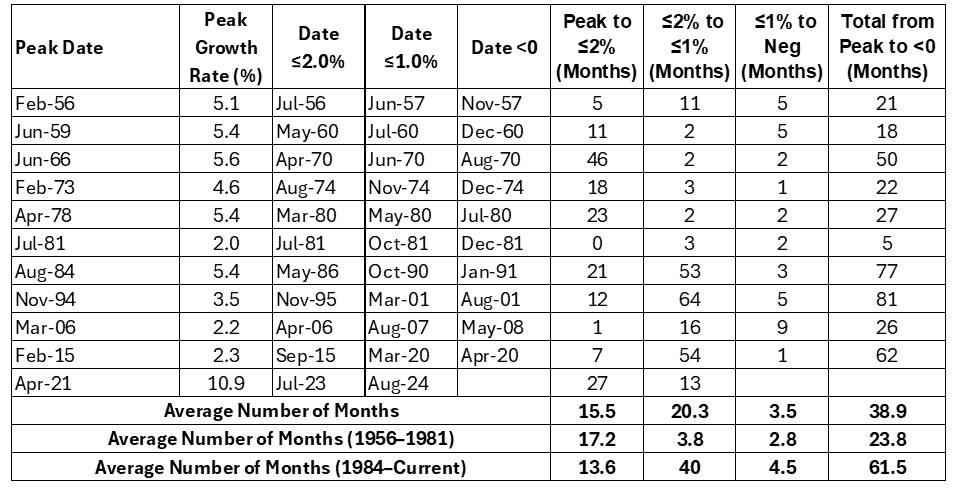
Between 1956–1981, it took an average of 17 months for job growth to fall from its cycle peak (averaging 4.7 percent) to less than or equal to 2 percent. From that point, it typically took only 3.5 months to drop to 1 percent or lower, and less than three more months to turn negative. The business cycles after the recession ended in 1982 up to the pandemic followed a similar pattern, albeit with a prolonged period of slower job growth. Eventually, there was an acceleration toward negative growth in each cycle. The post-pandemic period has tossed this pattern out the window. Growth in the number of employees has steadily slowed for years. In July 2023, the growth rate fell below 2 percent for the first time in the cycle before falling to 1.0 percent in August 2024. In the 18 months since then, the decline has slowed rather than intensified as expected (see table below). In other words, the trajectory of the current recovery is unusual.
But the labor market can only absorb so much. The heightened level of uncertainty surrounding the possibility of a prolonged war in the Middle East and the risk of inflation reigniting could weigh on already low consumer and business confidence and push this resilient labor market into negative growth.
Freddy’s Forecast: March Jobs, Good Friday Edition
While not normally a cause for celebration, it is worth noting that this jobs report will be the first back-to-back on-time release since the August report in September 2025. A quick recap of where we’ve been: The February jobs report showed payrolls shrank by 92,000, pulling down average monthly job growth to 13,000 over the prior 12 months. The unemployment rate ticked up by 0.1 percentage point to 4.4 percent.
Since the last report, data from ADP showed the pace of private-sector hiring held steady as employers added 62,000 workers to payrolls in March. Hiring was concentrated among small businesses, which added 85,000 jobs, while large firms cut 4,000 and medium-sized firms slashed 20,000 workers. Construction led the goods-producing industry gains, adding 30,000 jobs, while manufacturers continued to lag, cutting another 11,000 from their payrolls. Service-providing industries added 32,000 workers, again led by the education and health services sector (+58,000). The trade, transportation, and utilities sector weighed on the industry, cutting 58,000 roles.
The Job Opening and Labor Turnover Survey data from BLS were weak and further confirmation that the low-hire, low-fire job market continues. The rate of hiring slipped to 3.1 percent. Notably, the hiring rate in the health care and social assistance sector, which has accounted for nearly all net-job creation over the past year, slumped to 2.6 percent from 3.0 percent.
Initial jobless claims remained low, falling 9,000 to 202,000 for the week ending March 28. Continuing claims, meanwhile, increased by 25,000 during the week of March 21 to 1.841 million. The four-week moving average, which smooths out weekly volatility, was 1.839 million, the lowest level since September 28, 2024.
The U.S. equity markets are closed in observance of Good Friday. Any instant financial market reaction to the March jobs report will be limited to a shortened session in the bond market. The rest will have the weekend to digest the news. Expect payrolls to shrink by 4,000 and the unemployment rate to tick up to 4.5 percent. Growth in average hourly earnings holds steady at 0.3 percent for a 3.7-percent annual gain.
Fact of the Day
Since the start of 2026, the federal government has published $956.1 billion in total regulatory net cost savings and 38.3 million hours of net annual paperwork increases.