


The Daily Dish
June 27, 2025
Understanding the Growth of the Debt
The graph below is reproduced from The New York Times for two reasons. First, it gives Eakinomics a chance to complain about The New York Times – always a good use of blog space. Second, it really does teach an important lesson about federal debt (non)management in the 21st century.
First the complaining. The chart documents the rise in debt associated with major national traumas – the Civil War, World War I, World War II, the Great Recession, COVID-19, and…a Republican reconciliation bill! The entire framing of the discussion is leftist bullmalarkey. Where is the American Rescue Plan, or do Democratic reconciliation disasters that spawn a generational spike in inflation not count? These guys and gals couldn’t find a level playing field at the Bonneville Salt Flats. But Eakinomics will just shrug that off.
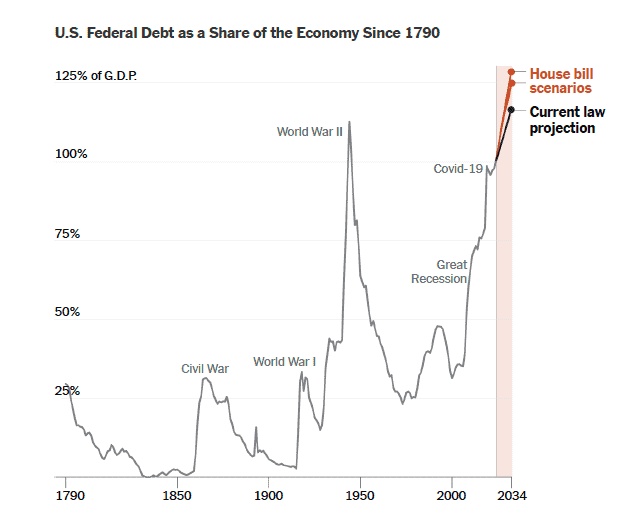
Here’s the important part. Notice what happens after the Civil War peak: The line goes down. After the World War I peak? Down. After the World War II peak? Down. Those were the days! In the 20th century, when fiscal distress struck, Congress and the president cleaned up their acts and brought the debt down (relative to gross domestic product).
And what of the 21st century? After the Great Recession? Up. After COVID-19? Up. The 21st century has displayed a bipartisan holiday from fiscal reality. But that is not all. One could draw a straight line from the trough before the Great Recession to any of the endpoints, and the Great Recession, COVID-19, and the One Big Beautiful Bill Act (OBBBA) would not stand out. The OBBBA isn’t a national trauma. It isn’t even an event!
That’s because the real event in the 21st century is the arrival of the demographic shift and ever-growing entitlement spending. The structural deficit driven by Social Security and federal health programs powered straight through the Great Recession and was undaunted by COVID-19. Even if Congress had cleaned up the emergency spending, the debt would have spiraled north. And the trajectory cannot be affected by the OBBBA because Social Security and Medicare were made off-limits by President Trump.
It’s time to stop pretending that the debt can be traced to single episodes. Unless, of course, the Times wants to add the Social Security Act of 1935 and the Medicare Act of 1965 to its chart.
Fact of the Day
Since January 1, the federal government has published $107.1 billion in total net regulatory costs and 69.6 million hours of net annual paperwork cuts.
