Insight
November 2, 2021
Comparing ACA Projections to Actual Performance
With the beginning of the annual Affordable Care Act (ACA) open enrollment period this week, we take a look back at the ACA’s performance over the last decade compared to original estimates, using annual enrollment and cost data from the Centers for Medicare and Medicaid Services and the Congressional Budget Office (CBO), respectively. After the ACA’s passage in 2010, CBO estimated that in 2020 nearly 25 million people would have health insurance through the exchanges and the 10-year cost of exchange subsidies and related spending would total $576.3 billion.
Annual enrollment has been significantly below projections, and since 2016, actual enrollment per year has been more than 11 million below initial estimates. Enrollment was projected to increase from 8.6 million in 2014 to 24.6 million in 2020, yet actual enrollment, reported as the average monthly number of individuals who had an active policy and paid their premium, was 6.3 million in 2014 and only 10.7 million in 2020. While total costs over the decade were lower than expected as a result of the lower enrollment, costs per enrollee have been significantly higher than expected. From 2014-2020, actual costs per enrollee averaged around $830 above projections per year, in part because the share of the enrolled population receiving premium tax credits was greater than expected each year (77-79 percent estimated versus 84-87 percent actual). Though this comparison is only one estimate of the impacts of the ACA, it highlights the under-enrollment and elevated costs of Marketplace coverage compared to projections.
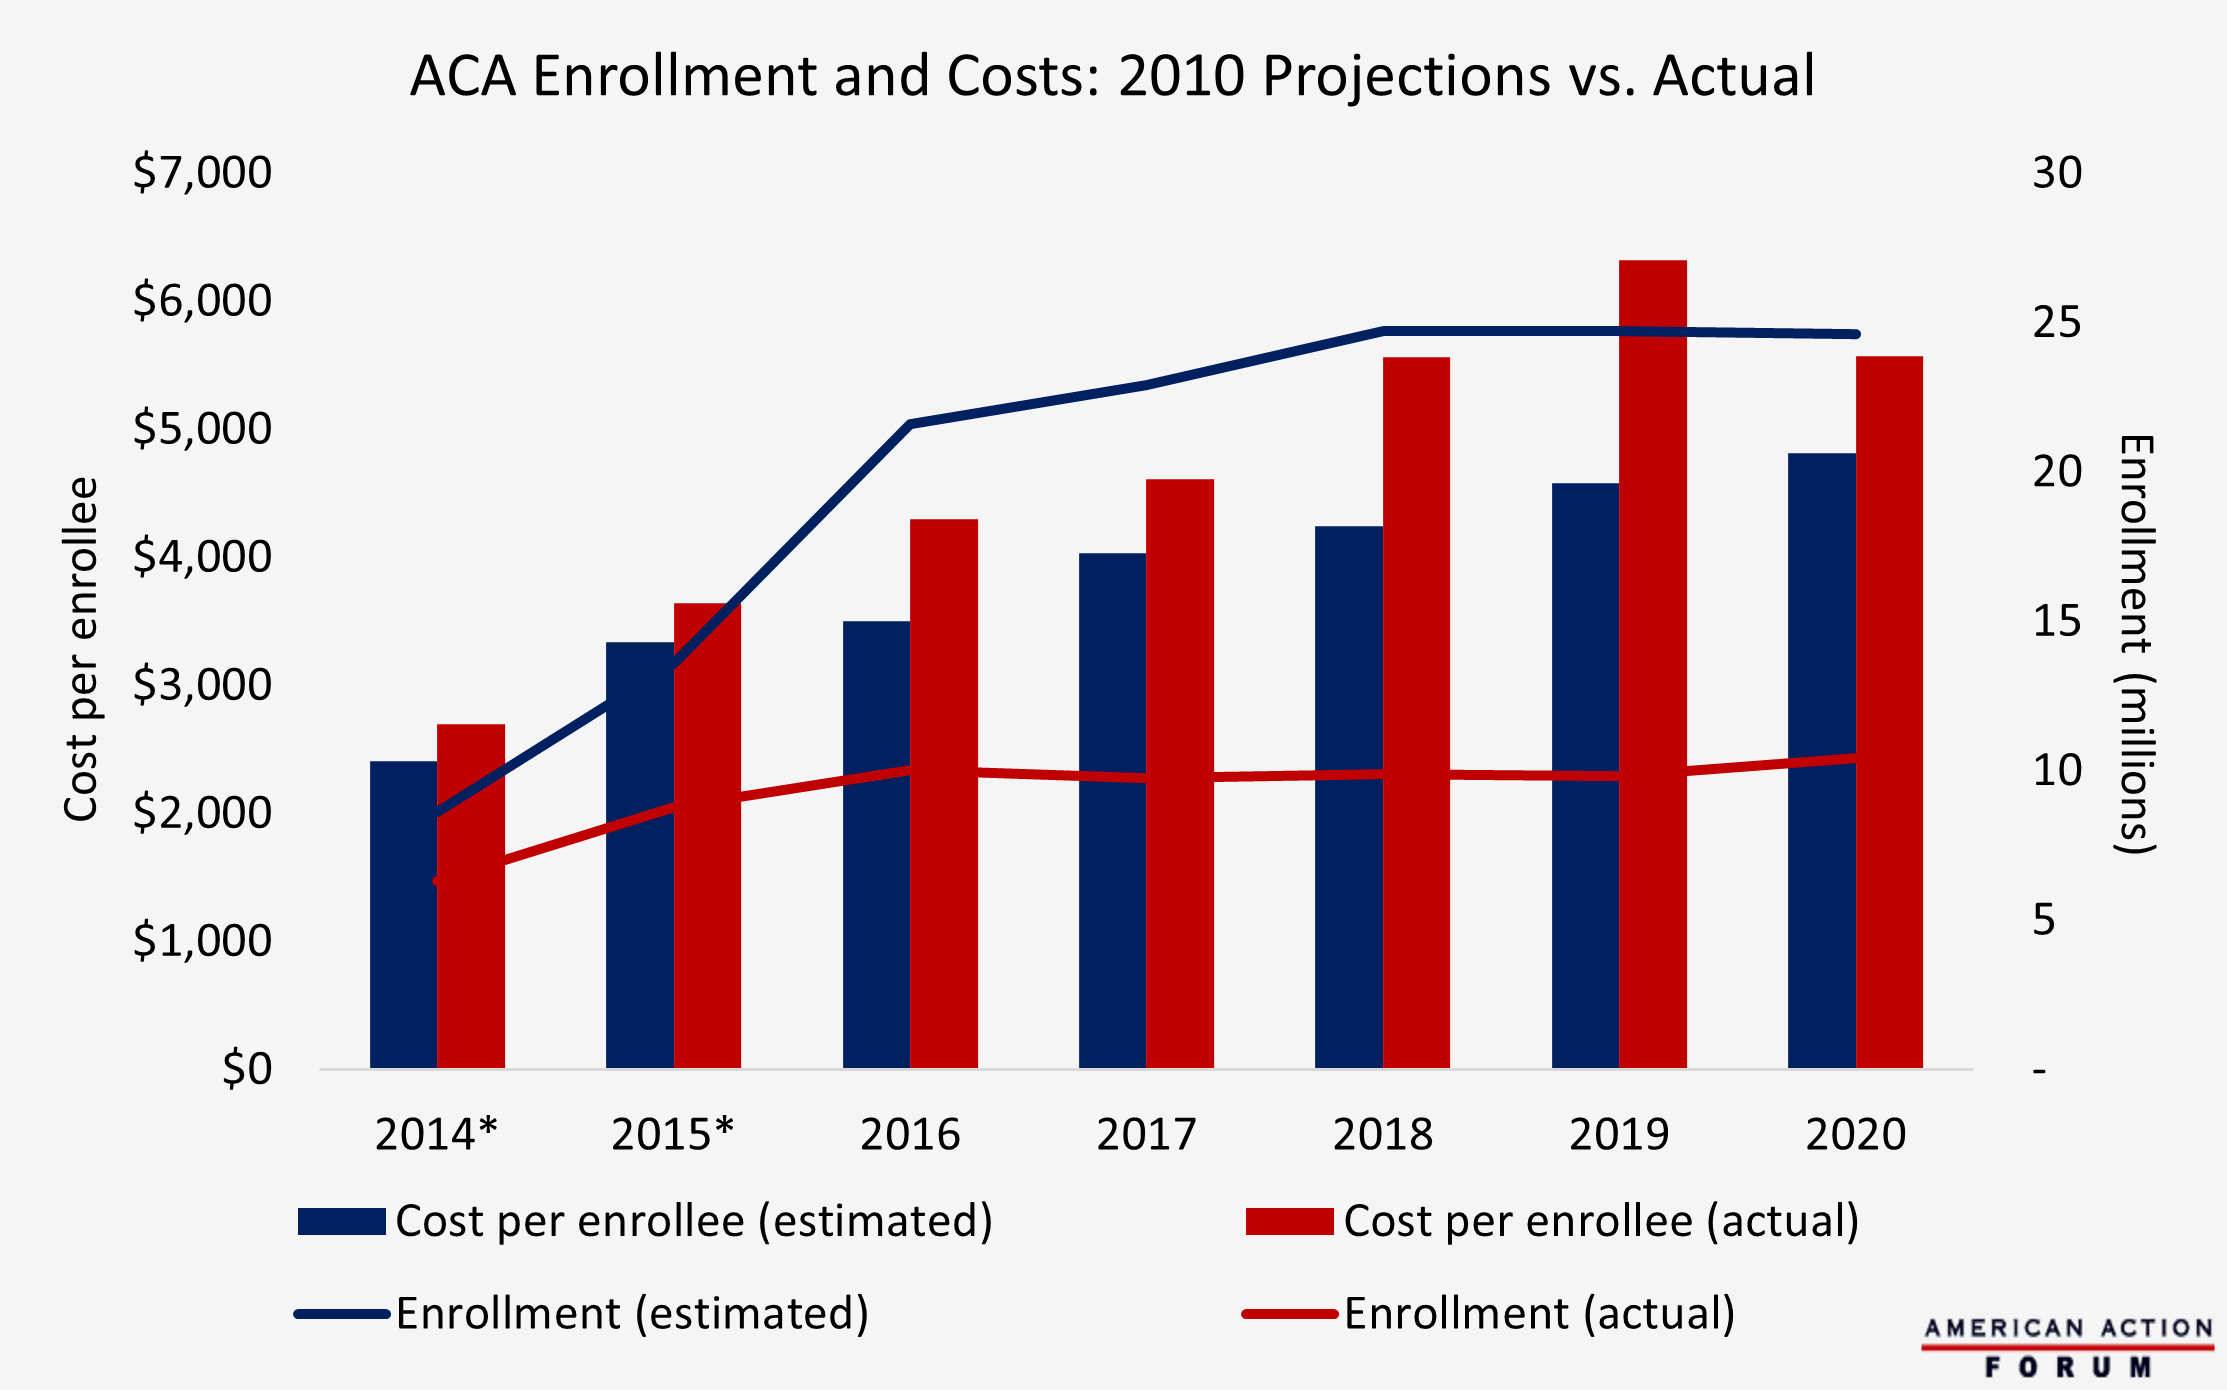
*Note: CMS began reporting “Average Monthly Effectuated Enrollment” for the year in 2016. For plan years 2014 and 2015, CMS released quarterly point-in-time estimates of enrollment; numbers from the December 2014 and December 2015 reports were used in the chart above. Average monthly effectuated enrollment was used above for plan years 2016 and beyond.
Sources:
Estimated enrollment and costs: CBO’s 2010 Baseline: Health Insurance Exchanges.
Actual enrollment: CMS Effectuated Enrollment Snapshot December 2014, December 2015; CMS Average Monthly Effectuated Enrollment 2016, 2017, 2018, 2019, 2020.
Actual costs: CBO Baselines Federal Subsidies for Health Insurance 2014, 2015, 2016, 2017, 2018, 2019, 2020.