Insight
February 2, 2022
Primer: Geographic Adjustment of Medicare Rates, Part II – Challenges and Proposed Solutions
Executive Summary:
- The vast majority of Medicare funds are spent through the program’s fee-for-service (FFS) system as payment to providers for individual hospital and physician services.
- To calculate appropriate, accurate, and sufficient reimbursement, Medicare takes the regional price of labor into account using the Hospital Wage Index (HWI) and the Geographic Practice Cost Indices (GPCIs).
- There are many problems with the sourcing and occupational mix of HWI and GPCI data, resulting in unbalanced payment rates between nearby regions and inaccurate reimbursements, among other issues, ultimately undermining the purpose of using the HWI and GPCIs for geographic adjustment.
- To address these discrepancies, the Centers for Medicare and Medicaid Services could change the data source for the HWI, align the payment regions between the two adjustment factors, alter the physician work GPCI formula, and adjust the occupational mix in both adjustment factors to better represent the true cost of labor in a given geographic region.
- These proposed solutions, while improvements on the existing system, would likely worsen reimbursement discrepancies in some areas; further study and better data collection are needed to adequately address the challenges with geographic adjustment.
Introduction
In 2020, Medicare spent $925.8 billion on the more than 62.6 million beneficiaries across the nation. The vast majority of these funds, excluding Part B drugs and medical devices, were spent through Medicare’s fee-for-service (FFS) system as payment to providers for individual hospital and physician services. FFS relies on a host of complex formulas to determine payment for services. An American Action Forum (AAF) primer covered these formulas and explained some of the problems with these methods of wage adjustment as they relate to geographic differences. These formulas seek, as closely as possible, to match payment to the true market value of a given service, as well as to achieve certain policy goals (for example, to ensure better access to care in rural or impoverished areas). The formulas must take into account a host of factors: type of diagnosis, severity of diagnosis, how the diagnosis was attained, the specific treatments used for the diagnosis, the complexity of the individual treatment chosen, the bundle of services that goes along with the treatment, and the real cost of providing the treatment, among other factors. The cost of providing the treatment is itself influenced by multiple variables: the amount of labor and the mix of labor used in providing the treatment (potentially involving physicians, nurse practitioners, orderlies, or other providers); and the capital costs of the provider, including rent and taxes. Cost of living directly impacts the price of labor, so personnel costs vary substantially based on location. Similarly, rent and taxes vary substantially among different communities. Medicare accounts for these cost differences between regions through geographic adjustment formulas.
The Hospital Wage Index (HWI) and Geographic Practice Cost Indices (GPCIs) are two methods of cost adjustment meant to ensure that Medicare equitably reimburses providers for care when adjusting for the price of labor in a region. Ensuring equitable compensation among geographic regions is the sole purpose of geographic adjustment factors such as HWI and GPCI, rather than addressing issues arising from other aspects of FFS. This paper reviews the HWI and GPCIs and the most relevant problems that occur in these formulas, and considers the proposed solutions presented in the 2007 Medicare Payment Advisory Commission’s (MedPAC) report to Congress and the 2011 Institute of Medicine’s (IOM) report on geographic adjustment in Medicare.
The Hospital Wage Index: Background
The HWI attempts to tailor payments to reflect the price of labor in a given geographic area. In practice, the Centers for Medicare and Medicaid Services (CMS) assigns distinct HWI values to all metropolitan statistical areas (MSAs) and then a single HWI value to all micropolitan statistical areas (non-MSAs) in a state. For fiscal year (FY) 2021, CMS recognized 590 geographic markets across the United States and its territories: 517 MSAs and 73 non-MSAs. The HWI for a geographic area is calculated as the average hourly wage (AHW) paid by all Inpatient Prospective Payment System (IPPS) hospitals in that geographic area divided by the AHW paid by all IPPS hospitals nationwide. Figure 1 below illustrates how HWI factors into Medicare’s base payment rate: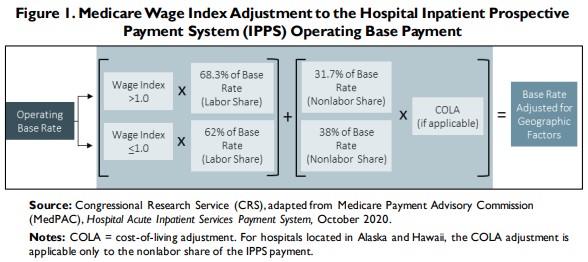
The Hospital Wage Index: Potential Solutions
Data
A major challenge with the HWI is the source for its data and how that data is used. AAF’s primer on Medicare geographic adjustments discusses other challenges, including the occupational mix problem and hospital concentration. Other sources have mentioned index cliffs, volatility, and circularity.[1] Each of these issues has some, or all, of its roots in the data used by CMS. Currently, CMS uses data collected from hospital cost reports, as well as a separate occupational mix survey, to determine the occupational mix of hospitals. These sources present a few problems.
First, hospital cost reports do not reflect the price of labor in a given geographic area, but merely the cost of labor for a specific hospital. In the context of this paper, the cost of labor means the amount of money a given provider spends on labor, while the price of labor is the actual dollar value of the labor used to provide a medical service. Put another way, the provider can choose how many nurse practitioners or licensed practical nurses to hire – which will help determine the cost of labor for the provider – but the provider in theory cannot choose how much the AHW – the price of labor in the geographic market – is for these roles. Due to the use of the hospital cost reporting data, the HWI functionally reflects the cost of labor for hospitals, and not the price of labor in the market.
Because the data source is hospital cost reports, there is a problem of circularity. With Medicare payments, circularity is the concept that current levels of cost influence future payment rates. For example, a hospital that decides to hire expensive employees, regardless of need, will have higher costs. Those costs are reported in hospital cost reports, and those higher costs may push up the HWI for that hospital’s region, and thus push up payment rates. In essence, a hospital can influence its payment rates, and may in fact be incentivized to do so.
This circularity problem is exacerbated by hospital concentration. A study by the Robert Wood Johnson Foundation’s Health Care Cost Institute found that 72 percent of surveyed hospital markets were highly concentrated, meaning these hospitals lacked competition, and that more concentrated markets tended to be found in metro areas with 300,000 people or fewer. A 2010 survey found that 59 markets had only one hospital and 98 markets had only two hospitals, and almost all of those markets were small-to-medium markets.[2] There are numerous effects of hospital consolidation, but one of them is increased control over the AHW. If an area only has one hospital, the AHW is by default whatever that hospital is paying, further adding to the hospital-focused bias by limiting wage data to just a few employers.
Additionally, there is a persistent problem in which nearby geographic regions may have so-called “index cliffs,” whereby the HWI is substantially different in neighboring MSAs or non-MSAs.[3] As a result, hospitals that are near the border of the region and meet certain criteria have an option to apply to be reclassified into the neighboring region. MedPAC has argued that this leads to reclassified hospitals being overcompensated.[4] Due to the budget-neutrality requirements of wage index adjustments, any hospital that increases its compensation due to reclassification by default decreases compensation for other hospitals, and so overcompensated hospitals cause other hospitals to be undercompensated. This has led to over two-thirds of hospitals in FY2022 receiving some sort of wage index adjustment by means of reclassification, special exemption, or rural floor.[5] Beyond the unfairness to unadjusted hospitals, this also creates convoluted payment calculations.
A potential solution for these issues lies in changing the source of data. Rather than use Medicare’s hospital cost reports to determine wages, some have suggested that CMS should use the Bureau of Labor Statistics’ (BLS) Occupational Employment and Wage Statistics (OEWS) data for health care and health care-adjacent professions. This idea has been endorsed by both MedPAC[6] and the IOM[7], though these organizations differ as to the number of health care professions that should be included. First and foremost, switching to BLS’ OEWS data would make the HWI much more reflective of the actual price of labor in a region – the entire point of geographic adjustment – rather than the current regime in which the HWI mostly reflects the cost of labor for hospitals. Building on that, using the BLS’ OEWS data instead of hospital cost reports would solve the circularity issue by taking hospital-only costs out of the picture and providing a greater, more holistic view of the labor market for hospitals. To address the issue of index cliffs, both MedPAC and IOM advocated the use of statistical smoothing methods alongside BLS’ OEWS data in order to prevent stark changes in wage index values among regions, and MedPAC argued for the use of county-level wage data to help further decrease wage cliffs with better-targeted geographic regions. In changing to BLS’ OEWS data, CMS would also need to make adjustments to the MSA and non-MSA regions to make sure they align with the BLS’ OEWS data as well.
Switching from hospital-reported cost data to BLS’ OEWS data confers additional benefits. AAF’s primer on Medicare geographic adjustments noted the problems in rural and urban payment disparities. Some of the problems are tied to the inherent issues in volume-based payments. Both MedPAC and IOM found that using BLS’ OEWS data seems to reduce the differences in HWI for low- and high-wage regions. Given that rural areas tend to be (but are not always) lower-wage areas, this would benefit rural areas and perhaps eliminate the need for certain additional programs that boost payments to rural facilities. As detailed below, however, this may create problems for high-cost regions that would see their HWI drop beyond what may be sustainable for hospitals in their regions. Additionally, using BLS’ OEWS data to determine HWI would provide for less volatility, because BLS’ OEWS data is a rolling average from the previous three years of data.
Occupational Mix
Another major issue with the current data used for the HWI is the occupational mix used to determine the AHW. To determine the HWI, the AHW for hospitals must be calculated using reported paid hours and the cost of wages.[8] To ensure that the HWI reflects the regional market price of labor and not the labor decisions of a hospital, a hospital’s AHW is adjusted based on the hospital’s occupational mix – the proportion of certain positions at the hospital relative to the proportion of those positions nationally. This proportion is the Occupational Mix Adjustment (OMA). Due to limited data collected by CMS, only the nursing profession is used to determine a hospital’s OMA, specifically: registered nurses, licensed practical nurses, surgical technologists, nurse assistants, orderlies, and medical assistants.
There are several downsides to this occupational mix, particularly the issue with using hospital cost reports. First, this method does not capture the full range of occupations employed by providers. Nursing professions account for less than half of hospital workers.[9] The majority of health workers’ wages are therefore not taken into account. Second, health occupations are not employed by hospitals alone. The use of hospital cost reports to represent the majority of health workers, despite their wages not being accounted for in the OMA, creates further hospital bias and circularity issues. Third, not all hospital employees are even in health care occupations. Lawyers, accountants, information technology professionals, etc. can all find work outside of health care markets. These last two issues are potential contributors to a phenomenon highlighted in AAF’s primer: Margins in high-cost areas, specifically the San Francisco and Seattle regions, are highly negative relative to the rest of the country, while their HWIs are lower than would be reasonably expected.
CMS should also consider expanding the number of occupations included in the OMA. Both the MedPAC 2007 report to Congress and the 2011 report by the Institute for Medicine (now the National Academies of Science, Engineering, and Medicine, or IOM) advocate this idea, though in different ways. MedPAC’s design would use 30 occupations, while IOM advocated using all occupations in BLS health care sector data. IOM noted that while its method and MedPAC’s method were highly correlated, the IOM method of a full set of occupations led to lower-wage markets having a slightly higher HWI and higher-wage markets having a slightly lower HWI than the MedPAC method.[10]
Policymakers must be cognizant of challenges that would arise from changing the data source to the BLS’ OEWS data. Figure 2 below demonstrates the potential HWIs this change would mean for high-cost areas, including the San Francisco, Los Angeles, Seattle, Boston, Washington, D.C., and New York City MSAs.[11] These MSAs, with the exception of Los Angeles, were chosen in our previous primer for analysis of their Medicare Part A margins as six of the seven highest-cost-of-living cities in America[12], and are examined again in this primer for consistency. Los Angeles is included here to provide a comparison to San Francisco as similar cities in the same regulatory environment. The calculations determined the average hourly wage for all health workers based on BLS’ OEWS data from May of 2020, the latest available. Dental and veterinary professions were excluded as they are not employed by hospitals or covered by Medicare Part A.
Figure 2.
Of note, this shows there would likely be a significant decrease in the HWI for the San Francisco MSA (-21.59 percent) and substantive decreases for New York City (-13.02 percent), Boston (-10.85 percent), and Los Angeles (-7.98 percent), but a slight increase for Washington, D.C. (4.45 percent) and Seattle (2.12 percent). As AAF’s previous primer noted, both the San Francisco and Seattle MSAs face substantial negative margins for Medicare Part A, at -41.2 percent and -27.7 percent, respectively. Based on the above calculations, a switch to BLS’ OEWS data may worsen these negative margin problems for several high-cost regions, but ease them somewhat for others. This may be true for several reasons: Neither the IOM method nor the MedPAC method include non-health professions that are typically employed by hospitals and may be significantly more expensive in certain high-cost regions than in others; additionally, it may be that state staffing requirements for hospitals significantly impact the cost of labor beyond a hospital’s control. There could also be fundamental problems in the way payment is geographically adjusted (see Fig. 1) that go beyond the HWI calculation. Ultimately, it is unclear why two MSAs with high-margin losses, such as Seattle and San Francisco, or other regions that have similarly high costs of living, would have different outcomes under a new system that used BLS’ OEWS data.
Both the MedPAC and IOM methods may offer a more accurate wage index determination than the current method, in terms of reflecting the true price of labor. These methods would reduce differences between high- and low-wage areas, though as discussed below, this may not reflect reality of costs on the ground in certain areas. That said, both methods more closely represent the true health care labor- market mix, provide a closer correlation between HWI and the price of labor in most cases, and eliminate the circularity problem of using hospital data to determine hospital payments. These proposed methods may even reduce hospital paperwork somewhat by eliminating the need for an occupational mix survey. While these reforms address intrinsic problems with the HWI formulation, they also reduce the HWI in some areas that are genuinely high-cost and already face excessive Medicare margin deficits; it seems a variable is missing from these calculations that would account for this issue. Both the MedPAC and IOM proposals require further study and regular review to make sure that high-cost areas already seeing major margin losses in Medicare are not subject to further undue payment cuts. Indeed, it may be that the geographic adjustment formula (see Fig. 1) as a whole needs to be studied further to better understand why high-cost areas see such different treatments and outcomes when it comes to geographic adjustment.
Geographic Practice Cost Indices: Background
The geographic areas used by the Physician Fee Schedule (PFS) are divided into 112 localities – 34 state-wide localities and 75 localities in the other 16 states. The basic unit of the PFS is the relative value unit (RVU). RVUs represent the cost of resources for a given procedure relative to the cost of resources associated with a different procedure. A given number of RVUs are assigned to each Healthcare Common Procedure Coding System (HCPCS) code. Each HCPCS code represents a specific procedure. Geographic adjustments are made to PFS payments via GPCIs for each of the three types of RVUs: physician work (PW), practice expense (PE), and malpractice premium (MP). In 2020, on average, the PW component comprised 50.866 percent of RVUs, the PE component comprised 44.839 percent of RVUs, and the MP component comprised 4.295 percent of RVUs. Figure 3 illustrates the formula for PFS payments:
Figure 3.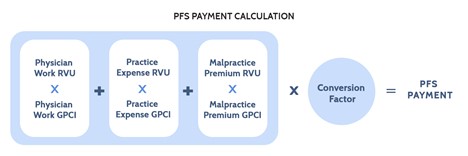
The PW GPCI is designed to reflect geographic differences in the cost of physician labor as compared to a national average. The PW GPCI is based on the median earnings of seven nonphysician occupational categories (occupations with five or more years of college education) as reported by the Bureau of Labor Statistics Occupational Employment Statistics (BLS OES) reports from 2014-2017. The range of the nonphysician occupational salaries is large and, due to political compromise, the adjustment has been limited to 25 percent of the total range of earnings above and below the national average. The 25 percent of the total range of nonphysician earnings in a given region is then divided by the national average to produce the PW GPCI.
The PE RVUs and their GPCI adjustments are made up of four index components: employee wages, purchased services, office rent, and other supplies and miscellaneous expenses. The employee wage index component measures the variation in the price of labor directly employed by a physician practice, while the purchased services index component measures the price of contracted labor – such as legal and accounting services. The employee wage index component for non-physician staff is based on median wage data from BLS OES for four occupations: registered nurses, licensed practical nurses, health technicians, and administrative staff. The purchased services index component is also geographically adjusted using data from the BLS OES. As the name implies, the office rent index component measures the variation in the price of rent for the space a physician practice uses. The supplies and miscellaneous expenses index component covers various medical equipment and other purchases, but these are assumed to be purchased through a mostly national market and thus are not subject to geographic variation, giving the miscellaneous index component a PE GPCI of 1.00. Figure 4 below illustrates the components of the PE GPCI:
Figure 4.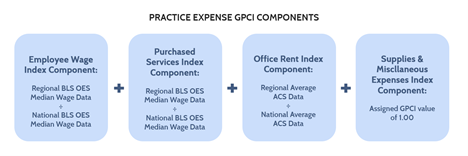
The MP GPCI is calculated based on insurer filings of premium data for $1 million per incident and $3 million per year of mature claims-made policies. Malpractice premiums vary heavily based on specialty and the state in which a physician practices.
Geographic Practice Cost Indexes: Solutions
General Issues
While the MP GPCI has produced little controversy (likely because it is a very small proportion of PFS payments), the PW and PE GPCIs have had significant problems. They both suffer from the particular geographic setup of the PFS. GPCI payment adjustments are made for 112 regions in the United States, compared to the 590 regions adjusted by the HWI. Accordingly, the price of labor assumed by the GPCI is significantly less accurate for a given area. The solution to this, as proposed by IOM, is for GPCIs to have the same geographic basis as the HWI does – the MSAs and non-MSAs. While there are some issues with the current MSA and non-MSA configurations, they are significantly more targeted than the current GPCI regions.
Additionally, GPCIs are not adjusted as frequently as the HWI is, which leads to a strange scenario in which the GPCI is often significantly lower than the HWI for similar geographic regions. For example, San Jose, California has the highest HWI in the nation at 1.8541, but a much lower PW GPCI of 1.096 (though still the highest PW GPCI in the nation).[13] Given that the labor pool for hospitals and physician practices is similar, one wonders why the adjustment factors meant to account for the price of labor in the same region for roughly the same labor pool would be so different. Part of the issue is that GPCIs rely more on proxies to calculate payments – this is to avoid circularity problems and is further discussed below. It is possible that this gap is also caused by the imprecise nature of the GPCI regions and switching to the same MSA/non-MSA region breakdowns as the HWI would help narrow this gap. It would also make sense to more frequently update the data used to calculate the GPCIs.
Physician Work GPCI
The PW GPCI component may be one of the more convoluted payment mechanisms in all of Medicare’s geographic adjustment factors. Unlike the HWI, which bases its core inputs on hospital cost report data, the PW GPCI avoids the circularity problem by basing payments on proxy occupations rather than reported physician costs. These proxies, as noted above, are the median hourly earnings of seven non-physician categories that were chosen for being professions that require “similar” levels of time and education and provide similar levels of pay. The addition of the 25 percent adjustment to the range, reducing it to one-quarter of its size (arbitrarily chosen by policymakers because the full range seemed too large) further brings into question the accuracy of PW GPCI.
To solve this problem, IOM has proposed keeping the proxies to avoid the circularity issue but would get rid of the one-quarter adjustment.[14] In its place, the chosen proxy occupations would be analyzed using a multiple regression model to see which occupation tracked most closely with physician pay and then an adjustment index created for the other occupations. After those calculations, one of two methods could be used: Calculate an index to represent the predicted value for physician compensation or give the proxy professions a relative weight. The standard index formula (regional occupation median compensation divided by national occupation compensation average) would be maintained. The one-quarter adjustment has been shown to provide less variation in wages than other adjustments, so the idea of the adjustment itself is not flawed and it may be that a limiter of some type is necessary to prevent excessively high (or low) physician payments.[15] Different proxies may need to be chosen based on applicability, but this system would provide a work adjustment GPCI that would be more empirical and objective than the one-quarter work adjustment currently in place.
Practice Expense GPCI
The PE GPCI has a similar problem to the HWI: The occupational mix is limited to only four occupations that were determined nearly 40 years ago. As with the HWI, this leads to an inaccurate picture of both the composition of modern physicians’ offices as well as the price of labor in physicians’ offices. IOM has suggested using the full range of occupations employed by a physician’s office to determine the employee wage index component portion of the PE GPCI. IOM also proposes including nonclinical labor expenses under the PE GPCI, such as security guards, janitors, accountants, and attorneys to better reflect the full range of hired labor.
Conclusion
The HWI and GPCI have numerous problems that impact their ability to accurately account for the price of labor in a given region. Those featured here, from data source issues to limited occupational mixes, represent some of the most egregious issues with geographic adjustment in Medicare. While MedPAC and IOM have proposed solutions, they have not been considered in the decade-plus since the reports were written, and the solutions pre-date both the Affordable Care Act and the repeal of the Sustainable Growth Rate in Medicare. While these proposals present viable starting points for reform, they do not provide complete solutions to the challenge of fairly compensating certain high-cost areas for their price of labor. As Medicare’s financial pressures rise in the coming years, it is necessary that payment systems be as accurate as possible. Further study, better data collection, and regular updates to reflect changing labor trends are needed to adequately address the challenges with geographic adjustment. Additionally, Congress could direct MedPAC and IOM to issue updated reform proposals that account for the known issues highlighted by MedPAC and IOM, but also address the issues of high-cost areas seeing potentially substantial decreases in reimbursement.
——————————————————————————————————————————
[1] Medicare Hospital Payments: Adjusting for Variation in Geographic Wages – CRS Report: https://crsreports.congress.gov/product/pdf/R/R46702
[2] Chapter 3: Hospital Wage Index – Geographic Adjustment in Medicare Payment: Phase I, Second Edition (2011): https://www.ncbi.nlm.nih.gov/books/NBK190066/
[3] Chapter 6: An alternative method to compute the wage index – MedPAC Report to the Congress: Promoting Greater Efficiency in Medicare (2007): https://www.medpac.gov/wp-content/uploads/import_data/scrape_files/docs/default-source/reports/Jun07_Ch06.pdf
[4] MedPAC October 2021 Public Meeting: https://www.medpac.gov/meeting/october-2021-public-meeting/
[5] MedPAC October 2021 Public Meeting: https://www.medpac.gov/meeting/october-2021-public-meeting/
[6] Chapter 6: An alternative method to compute the wage index – MedPAC Report to the Congress: Promoting Greater Efficiency in Medicare (2007): https://www.medpac.gov/wp-content/uploads/import_data/scrape_files/docs/default-source/reports/Jun07_Ch06.pdf
[7] Chapter 3: Hospital Wage Index – Geographic Adjustment in Medicare Payment: Phase I, Second Edition (2011): https://www.ncbi.nlm.nih.gov/books/NBK190066/
[8] Medicare Hospital Payments: Adjusting for Variation in Geographic Wages – CRS Report: https://crsreports.congress.gov/product/pdf/R/R46702
[9] Note: The formula does not account for state and local nurse-to-patient ratio requirements. California is currently the only state to have a specified ratio requirement and this may negatively affect payments to California hospitals. https://www.nursingworld.org/practice-policy/nurse-staffing/nurse-staffing-advocacy/
[10] Chapter 3: Hospital Wage Index – Geographic Adjustment in Medicare Payment: Phase I, Second Edition (2011): https://www.ncbi.nlm.nih.gov/books/NBK190066/
[11] It is important to note that CMS and BLS have two different systems of statistical areas, and so the San Francisco-Oakland-Hayward MSA used by the BLS does not exactly match the geographic boundaries of the San Francisco-San Mateo-Redwood City MSA used by CMS, and the same holds true for the remaining cities.
[12] Cost of Living Index – The Council for Community and Economic Research: https://www.coli.org/quarter-1-2021-cost-of-living-index-released-3-2-2-2/
[13] 2021 GPCI Value Table – CompuGroup Medical: https://emds.com/gpci/
[14] Chapter 5: Geographic Practice Cost Indexes – Geographic Adjustment in Medicare Payment: Phase I, Second Edition (2011): https://www.ncbi.nlm.nih.gov/books/NBK190061/
[15] Gillis et al., 1993