Insight
February 16, 2021
Has COVID-19 Vaccine Distribution Been Equitable?
Executive Summary
- Some are understandably concerned with reports that racial minorities are receiving the COVID-19 vaccine at a disproportionately low rate, but a survey of the data indicates that any conclusion is likely premature.
- Fewer than half of states are reporting any data regarding the race of vaccine recipients, and among those that do, 38 percent are categorized as either “multiracial,” “other,” or “unknown.”
- Taking into account who has been eligible for vaccines thus far makes the inequities appear less pronounced than they may otherwise seem.
- Factors separate from vaccine availability—such as distrust of government and health care providers as well as underlying inequities related to income, education, and job access—are likely contributing to any racial disparities that do exist.
Introduction
Many are understandably concerned that the COVID-19 vaccines are not being distributed equitably among racial groups, leaving non-White populations without equal protection from a disease that has taken a disproportionately large toll on many of them. A quick read of the initial reports published by the Centers for Disease Control and Prevention (CDC) seems to validate this concern.
A deeper dive and additional context, however, show that conclusion is not necessarily accurate. Beyond the top-line numbers, a few other key data points deserve attention in order to understand the limitations of what is known. First, only 52 percent of data reported by the CDC includes racial information. Second, included among that 52 percent is 14.4 percent of cases where the individual is identified as either multiracial or “other.” Thus, specific racial data are only known for 41.2 percent (5.7 million) of the initial 12 million vaccine recipients.
There are also numerous ways to consider whether the distribution has been equitable from a racial perspective, and each method of analysis will likely lead to a different conclusion. Comparisons may be made based on overall population, although, given the disparate impacts of the pandemic, it may be more appropriate to consider the rate at which people are dying across racial and ethnic groups. There are, however, restrictions on who is eligible for the vaccine, which further complicates the comparison since providers had to work within those eligibility guidelines. Further, some groups are less likely to take the vaccine when it becomes available to them. Each of these factors must be considered when assessing how equitable the distribution has been to date.
Analyzing the Data
Vaccine Distribution Relative to Overall Population
According to the data available, only 11.5 percent of vaccine recipients were Hispanic/Latino and just 5.4 percent were non-Hispanic Black, despite accounting for 18.5 and 12.5 percent of the population, respectively.[1]
Non-Hispanic White individuals, however, do not appear to have received a disproportionately large share of the vaccines, accounting for 60.4 percent of vaccines and making up 60.1 percent of the population.[2] Non-Hispanic Asians have similarly received a roughly equal share of vaccines (6.0 percent) relative to their share of the population (5.8 percent).[3] Non-Hispanic Native Hawaiians and Other Pacific Islanders have received 0.3 percent of the shots and account for 0.2 percent of the population.[4]
Non-Hispanic American Indians and Alaska Natives (AI/AN), on the other hand, seem to be doing disproportionately well, having received 2.0 percent of vaccines while accounting for just 0.7 percent of the population.[5]
Vaccine Distribution Relative to Deaths Rather Than Population
Given the disparate impacts the virus has had, a more appropriate consideration may be a comparison of death rates by race, particularly after accounting for the expected risk of those who died. The value of the vaccine is arguably higher for those more likely to contract and die from the disease. The age adjustment calculation factors in a person’s age to more accurately determine their expected risk of death, providing a more equitable comparison of death rates since, all else being equal, age has been shown to be the greatest risk factor for this virus. For those groups below with a significantly higher age-adjusted death rate than unadjusted, it is because those who died were much younger than what would have been expected based on their age alone.
Hispanic/Latino individuals account for 18.1 percent of all deaths, roughly equal to their share of the population; yet when adjusting for age, the Hispanic death toll rises to 38.1 percent.[6] Non-Hispanic Blacks have died from COVID-19 at the highest rates relative to their share of the population, at 14.9 percent, rising to 23.6 percent when age-adjusted.[7] Non-Hispanic Whites account for 61.3 percent of all deaths, but just 29.7 percent after adjusting for age.[8] From this perspective, it is understandable why some are concerned with the reported low vaccination rates among Black and Hispanic populations.

Source: CDC National Center for Health Statistics
Vaccine Distribution Relative to Eligibility
One must also consider who was eligible for the vaccine when assessing the equitable distribution of the vaccine. The first individuals eligible for the vaccine, at the direction of the CDC, were health care workers (particularly those directly caring for COVID-19 patients) and staff and residents of long-term care (LTC) facilities. This prioritization was based on the fact that health care workers directly exposed to COVID-19 patients were at great risk of contracting the virus themselves and the United States was already experiencing a shortage of care providers; minimizing deaths requires maximizing the number of doctors and nurses providing care to the sick. LTC residents and staff were also prioritized because 40 percent of deaths thus far have been among such individuals, putting them in the highest risk category. Some states chose to expand eligibility beyond the guidance from CDC, so there was some variation from these two categories, but it was relatively minimal; Florida and Texas allowed individuals aged 65 or older to receive vaccines from the start.[9]
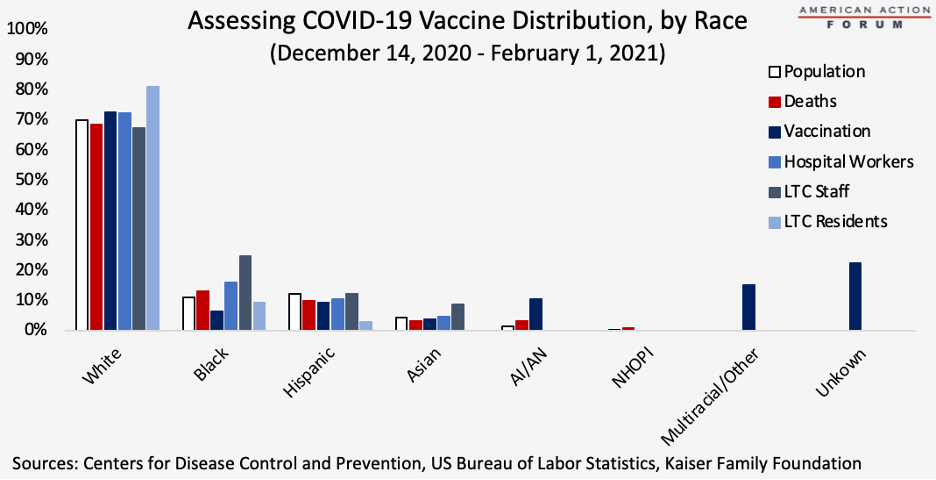
Data show that hospital workers, LTC care staff, and LTC residents are disproportionately White, accounting for 72.3 percent of hospital workers, 67.2 percent of LTC staff, and, according to the latest estimates (from 2009-2011), 81 percent of LTC residents.[10] Further, 55 percent of vaccinated individuals were aged 50 or older, and Whites make up 81.6 percent of that population.[11]
Hispanic individuals make up a relatively low share of hospital workers, LTC staff, and LTC residents (relative to their share of the population) at 10.6 percent, 12.1 percent, and 3.0 percent, respectively.[12]
Blacks make up a somewhat higher share of hospital workers (15.9 percent) and significantly higher share LTC staff (24.7 percent), but a less than proportionate share of LTC residents (9.4 percent).[13]
Asians account for a relatively high share of hospital workers (8.8 percent), but a relatively low share of LTC staff (4.7 percent); data regarding Asian LTC residents is not readily available.[14]
Data on these professional and residential populations were not available for other racial and ethnic groups.
Additional Data and Factors to Consider
Analysis from the Kaiser Family Foundation provides state-by-state data with an additional 2 weeks of information, but this set continues to be missing roughly half the data: Only 23 states reported the race of vaccine recipients. Based on these data, as of February 1, White individuals have received 72.7 percent of vaccines, Blacks 6.5 percent, Hispanics 9.4 percent, Asians 3.6 percent, American Indians and Alaska Natives 10.5 percent, and those classified as multiracial or other account for 15.2 percent, while the race of 22.5 percent of individuals is unknown, as shown in the chart above. These data indicate Whites, Blacks, and AI/AN have increased their share of the vaccines administered, while Hispanics and Asians are losing ground as time goes on. A slightly greater share is listed as multiracial or “other,” however, continuing to make it difficult to know the true distribution.
Finally, it is important to also recognize that part of the disparity among certain populations is likely a result of some individuals refusing to take a vaccine that was made available to them. In these cases, the problem is one of public trust rather than inequitable access. Surveys over the past year have continuously shown that Black and Hispanic individuals are much more hesitant to take the vaccines than White individuals, as shown here.
Aside from hesitancy, there are also logistical challenges that may be hindering individuals’ ability to receive a vaccine. For example, in many locations, individuals must obtain an appointment to receive a vaccine and the only way to do so is through an online scheduling site. While this reliance on technology can present challenges for many, particularly elderly individuals, it creates an even more challenging if not insurmountable barrier if an individual does not have access to the internet, which is more likely for non-White individuals. Further, it has been reported that many of the sites are only available in English, which creates a hurdle for those for whom English is not their first language, who, again, are more likely non-White.
What the Vaccine Data Do Reveal: Underlying Inequities
It is worth noting that although this combination of datasets can be used to make the case that the vaccine distribution has not necessarily been egregiously inequitable given who was eligible, it does reveal underlying inequities that have led to fewer non-White individuals being in such eligible groups. While elderly Black, Asian, and Hispanic individuals may be more likely to live with family in their later years as a result of cultural differences, it is also likely that more LTC residents are White because the cost is quite high and many non-White individuals cannot afford such care, reflecting income inequalities. The low rates of Black and Hispanic doctors and nurses reflect low acceptance rates of such individuals to medical and nursing schools, whether because of bias or educational disparities in primary and secondary school.
Conclusion
Accusations of widespread inequitable vaccine distribution are difficult to verify based on the limited available data. The data do indicate lower vaccination rates for Black and Hispanic Americans, but with known racial data for only two-fifths of vaccine recipients, conclusions are difficult to draw. Data suggest White Americans have received vaccines in proportion with their share of the population, deaths, and eligible groups. When analyzing just those populations who were initially eligible for the vaccine—hospital workers directly caring for COVID-19 patients and LTC residents and staff—Whites appear to have been vaccinated at a rate lower than what would be expected.
That said, the data regarding who was eligible arguably reveals underlying racial inequities regarding income and access to higher education and well-paying jobs.
Some may argue that the wrong groups were prioritized, and there may be validity to those arguments when considering who has been most impacted by the virus. Going forward, priorities may need to be reconsidered in order to address any existing inequities or to prevent future inequities.
[1] https://www.cdc.gov/mmwr/volumes/70/wr/pdfs/mm7005e1-H.pdf, https://www.census.gov/data/tables/time-series/demo/popest/2010s-national-detail.html
[2] https://www.cdc.gov/mmwr/volumes/70/wr/pdfs/mm7005e1-H.pdf, https://www.census.gov/data/tables/time-series/demo/popest/2010s-national-detail.html
[3] https://www.cdc.gov/mmwr/volumes/70/wr/pdfs/mm7005e1-H.pdf, https://www.census.gov/data/tables/time-series/demo/popest/2010s-national-detail.html
[4] https://www.cdc.gov/mmwr/volumes/70/wr/pdfs/mm7005e1-H.pdf, https://www.census.gov/data/tables/time-series/demo/popest/2010s-national-detail.html
[5] https://www.cdc.gov/mmwr/volumes/70/wr/pdfs/mm7005e1-H.pdf, https://www.census.gov/data/tables/time-series/demo/popest/2010s-national-detail.html
[6] https://www.cdc.gov/nchs/nvss/vsrr/covid19/health_disparities.htm
[7] https://www.cdc.gov/nchs/nvss/vsrr/covid19/health_disparities.htm
[8] https://www.cdc.gov/nchs/nvss/vsrr/covid19/health_disparities.htm
[9] https://www.cdc.gov/mmwr/volumes/70/wr/mm7005e1.htm
[10] https://www.bls.gov/cps/cpsaat18.htm, https://www.caringfortheages.com/pb/assets/raw/Health%20Advance/journals/carage/hefele.pdf, https://www.kff.org/coronavirus-covid-19/issue-brief/racial-and-ethnic-disparities-in-covid-19-cases-and-deaths-in-nursing-homes/, http://ltcfocus.org/download/b75e21bd-6b46-ea64-d331-e970936416a4
[11] https://www.census.gov/data/tables/time-series/demo/popest/2010s-national-detail.html
[12] https://www.bls.gov/cps/cpsaat18.htm, http://ltcfocus.org/download/b75e21bd-6b46-ea64-d331-e970936416a4
[13] https://www.bls.gov/cps/cpsaat18.htm, http://ltcfocus.org/download/b75e21bd-6b46-ea64-d331-e970936416a4
[14] https://www.bls.gov/cps/cpsaat18.htm, http://ltcfocus.org/download/b75e21bd-6b46-ea64-d331-e970936416a4