


Insight
May 23, 2017
Highlights of FY2018 President’s Budget
By the Numbers
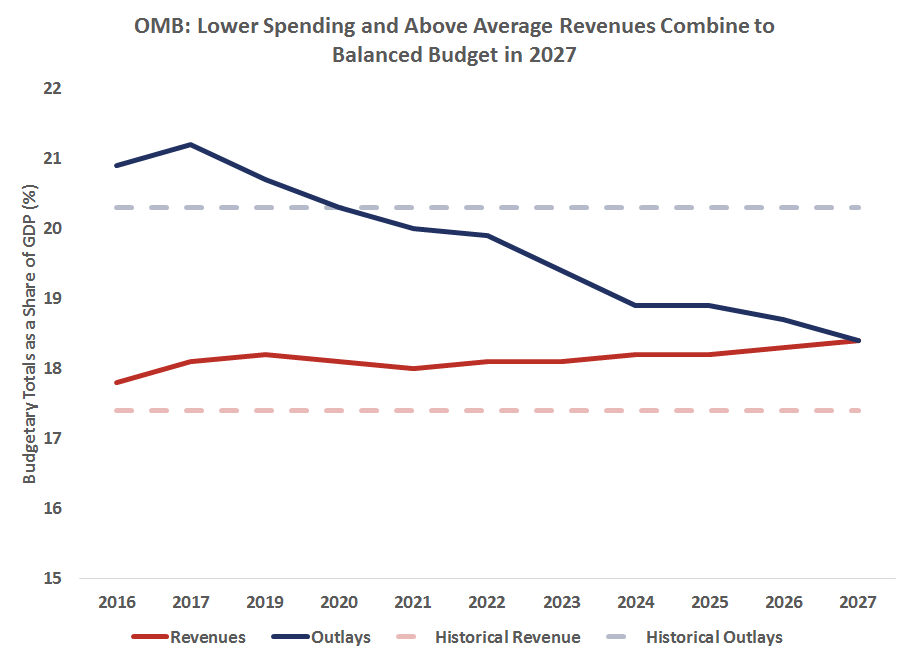
Taxes: Compared to its own baseline, the President’s Budget actually reduces revenues by almost $1 trillion over the next decade. However, as a share of GDP, revenues are expected to stay relatively stable in the president’s budget. Compared to the Congressional Budget Office’s (CBO) budget projections however, the President’s Budget would collect over $2.6 trillion more than is projected under current law due to higher economic growth assumed in the President’s Budget.
Spending: By the end of the budget window, the President’s Budget would decrease spending by over $4.5 trillion over the next ten years, sending spending nearly 2 percentage points below historic norms. Compared to CBO’s budget projections, the President’s Budget would reduce spending by $3.6 trillion.
Deficits: The President’s Budget dramatically reduce projected deficits over the next ten years and reach balance by 2027, based upon the OMB’s own assumptions, through a combination of significant spending reductions, much higher tax receipts through higher assumed economic growth and savings on debt service. OMB estimates that policy changes and interest savings in the President’s Budget would reduce projected deficits by $3.6 trillion over the next ten years.
Interest Payments: Interest payments on the debt will reach $639 billion in 2027. This reflects a two and a half-fold increase in interest costs relative to 2016 levels and a significant as a share of both the economy and the overall budget.
Debt Held by the Public: Borrowing from the public would decline as a share of the economy under the President’s Budget, reaching 59.8 percent a level not seen since 2012.
Economic Projections
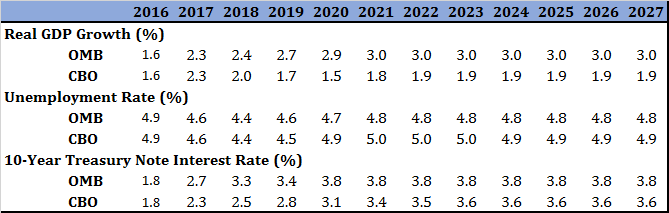
Compared to CBO’s most recent projections, the President’s Budget includes much rosier economic projections in terms of economic growth and unemployment. These effects combine to increase tax revenues and reduce debt service. Indeed, persistent, higher growth of just 0.1 percentage points should lead to $273 billion in deficit reduction. OMB’s growth forecasts averages 1.1 percentage points higher than CBO’s, which equates to over $3 trillion in “free” deficit reduction. This explains why OMB’s revenue baseline assumes tax collections are $3.6 trillion higher than does CBO.
