


Insight
October 9, 2025
How Much Are Electricity Prices Rising – And Why?
Executive Summary
- While U.S. national retail electricity prices saw a fast increase in the first half of 2025 at a 10-percent nominal growth rate, they have generally grown at a more moderate pace historically – with nominal prices staying relatively flat at a 0.7-percent growth rate from 2013–2020, 5.5 percent from 2020–2022, and are projected to grow at 4.5 percent from 2022–2026.
- Various factors affect electricity prices, including the costs associated with utilities’ generation, transmission, and distribution of electricity on the supply side of the electric system; the projection of future power demand from different end customers, weather conditions, and related regulations.
- This insight provides an overview of U.S. electricity prices’ recent and historical trends at the national and state levels and across different customer sectors. It also analyzes the main factors that drive electricity price changes.
Introduction
Fast-rising electricity prices are frequently making news headlines and have become a topic of political contention at the national and state levels. Democrats and Republicans are now pointing fingers at each other to explain the increases in the utility bills. Some criticize President Trump and the One Big Beautiful Bill’s repeal of the Inflation Reduction Act’s clean energy subsidies. Others blame Democrats’ disfavoring of fossil fuels.
Are electricity prices truly dictated by high-level political events, however? Or is the answer to the rise in utility bills much more nuanced, driven by supply, demand, and other large-scale factors?
While U.S. national retail electricity prices saw a fast increase in the first half of 2025 at a 10-percent nominal growth rate, they have grown at a more moderate pace over the past decade. Nominal prices were relatively flat at a 0.7-percent growth rate from 2013–2020, 5.5 percent from 2020–2022 and are projected to grow at 4.5 percent from 2022–2026.
Various factors affect electricity prices, including the costs associated with utilities’ generation, transmission, and distribution of electricity on the supply side of the electric system; the projection of future power demand from different end customers, weather conditions, and related regulations.
Although commercial and industrial sector’s electricity demand is expected to outpace the residential sector’s due to the power demand from artificial intelligence (AI) data centers and increasing manufacturing activities, residential electricity prices continue to be relatively higher and grow at a faster pace. This trend is determined by the residential sector’s smaller volume of power demand, less predictability of power usage, and the high cost of relying on the local distribution system.
This insight provides an overview of U.S. electricity prices’ recent and historical trends at the national and state levels and across different customer sectors. It also analyzes the main factors that drive electricity price changes.
Electricity Price Trends
There are three major sectors of end customers in the U.S. electricity market: residential, commercial, and industrial. In 2023, electricity consumption in the residential sector accounted for about 38 percent of the total electricity consumption, followed by the commercial sector (36 percent) and the industrial sector (27 percent). The transportation sector accounted for less than 1 percent of the total electricity consumption.
National-level price trends
The recent discussion of fast-rising U.S. electricity prices has been focused on the changes in the first half of 2025. Indeed, the increase in electricity prices so far this year has been striking. As shown in Figure 1, all-sector average electricity retail prices increased from 13.11 cents/kWh in January to 14.38 cents/kWh in July at a 10-percent nominal growth rate, much faster than inflation during this seven-month period, which hovered around 2 percent. This dramatic increase stands in contrast to the nominal growth rates of U.S. all-sector electricity prices over the same period in 2023 and 2024: 3 percent and 8 percent, respectively. The U.S. Energy Information Administration (EIA) projected that electricity prices will continue to outpace inflation through 2026.
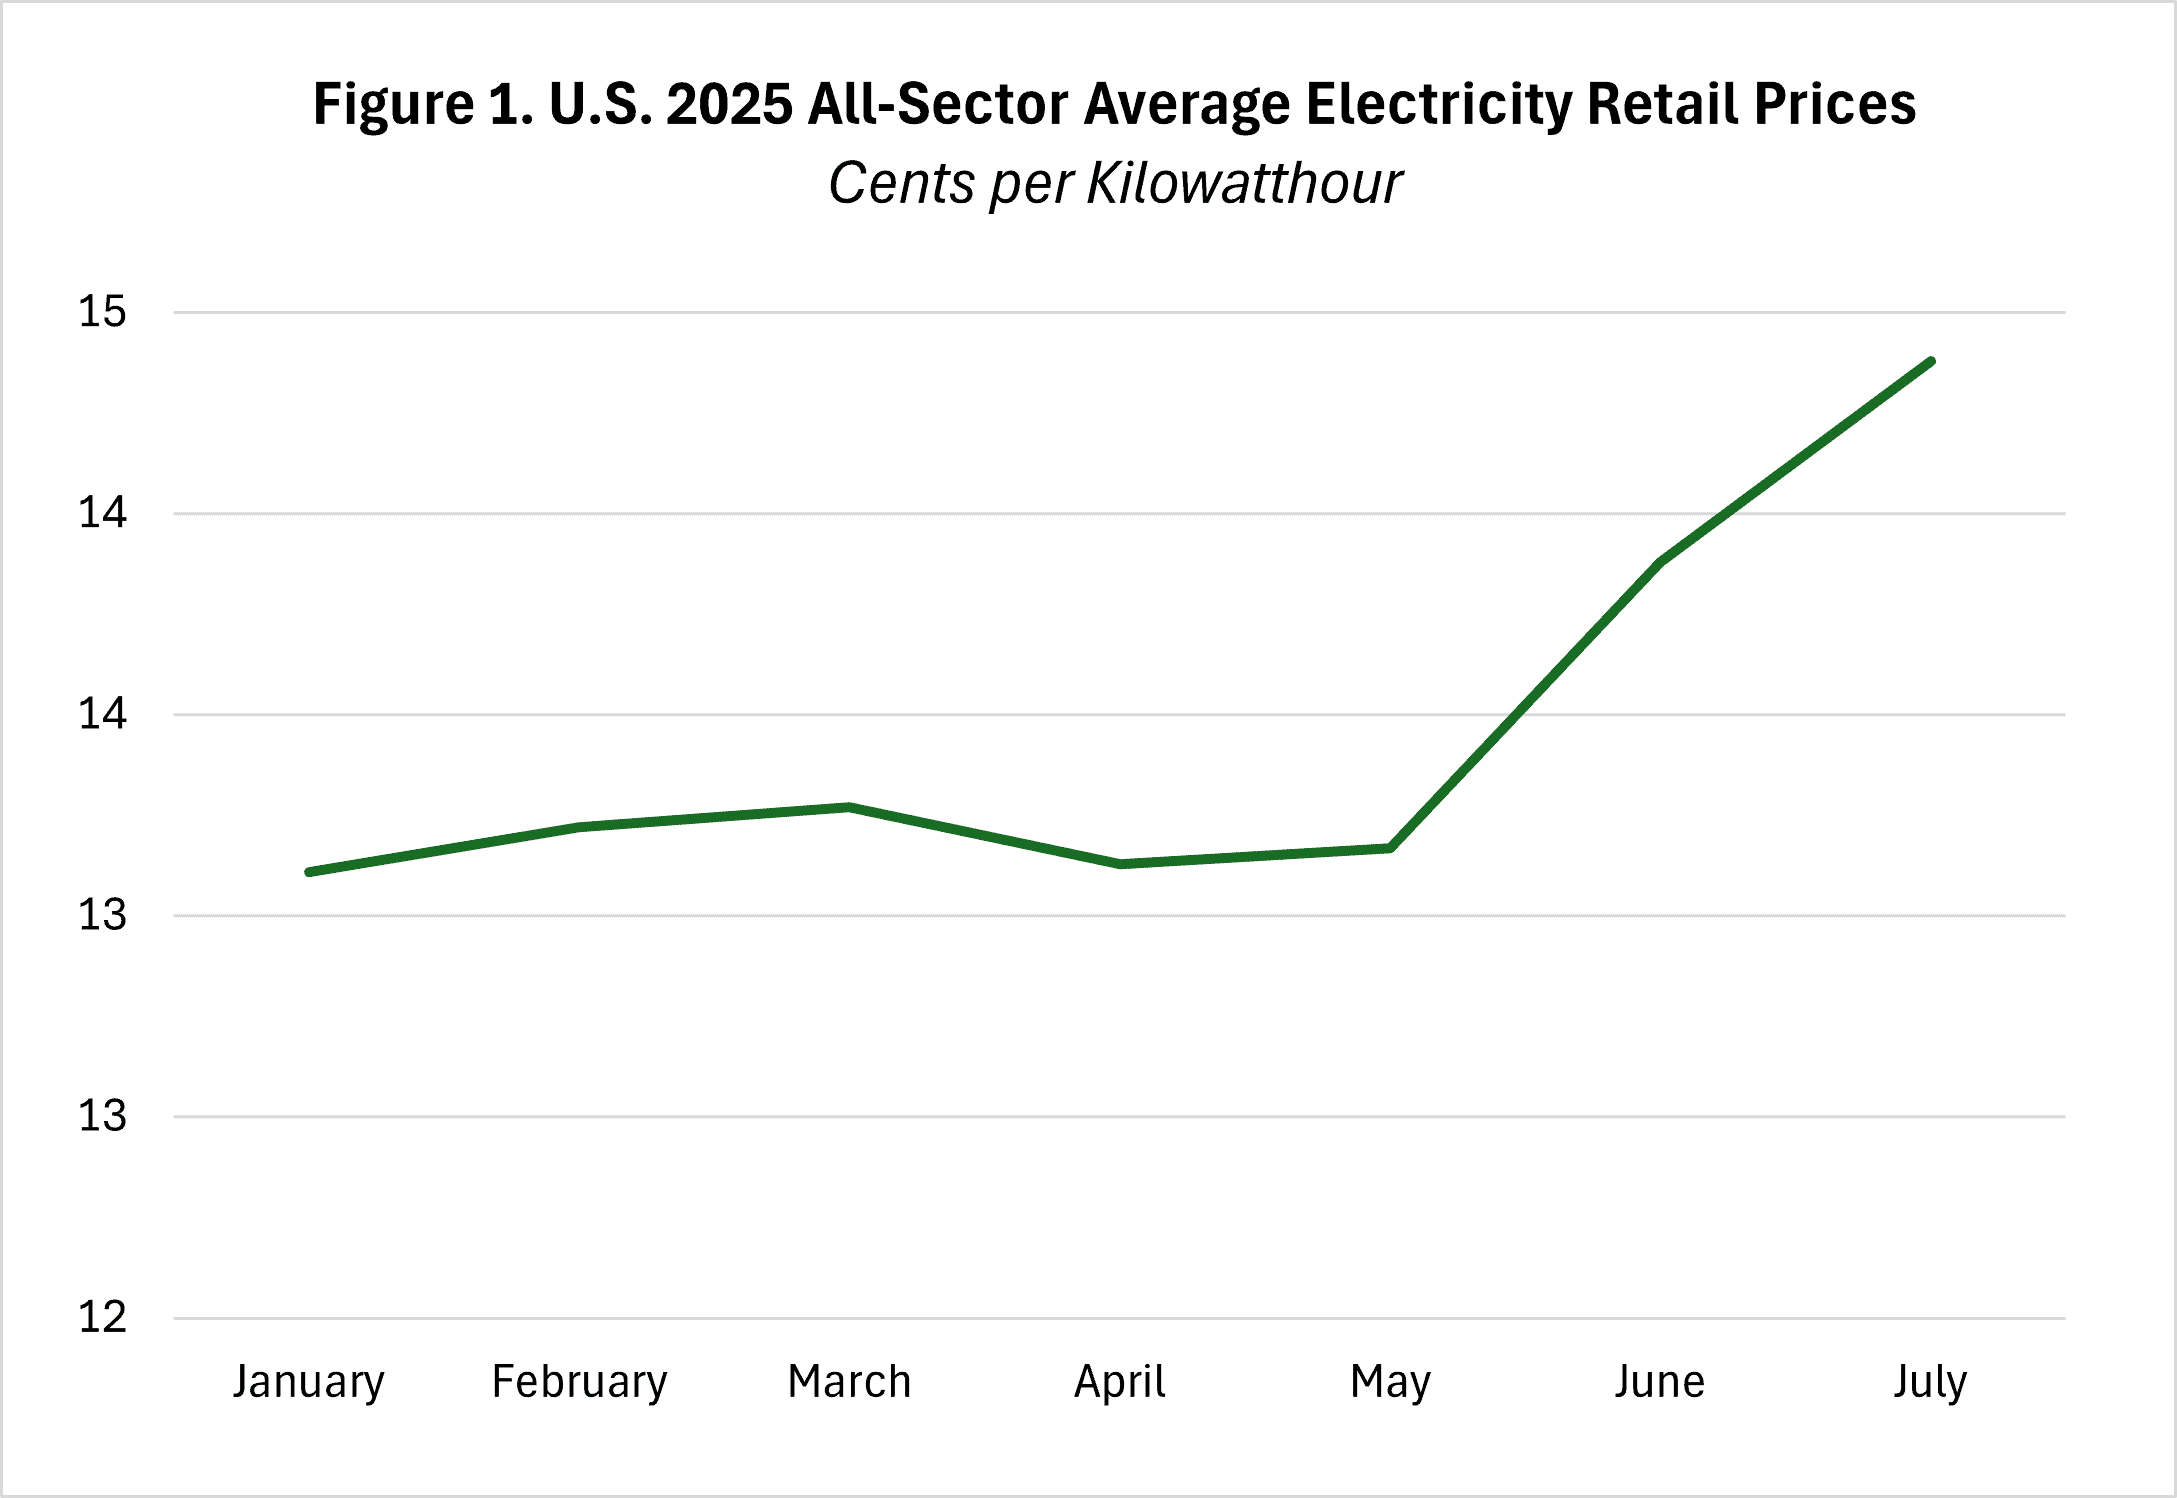
Source: U.S. Energy Information Administration
This significant growth trend is muted when considering year-over-year electricity prices data, however. Figure 2 depicts electricity prices from 2013 to 2026. (The average monthly data from January to July 2025 is used as a proxy for the 2025 annual average electricity price; 2026 data is EIA’s forecast.) U.S. nominal all-sector average retail prices are expected to increase from 10.07 cents/kWh in 2013 to 13.79 cents/kWh in 2026 at an average annual growth rate of 2.5 percent. Nominal prices stayed relatively flat at a 0.7-percent growth rate from 2013 to 2020, 5.5 percent between 2020 and 2022, and 4.5 percent between 2022 and 2026. In real terms, as shown in Figure 2, the growth of electricity prices has been steady from 2013 to 2024 and is expected to have a slight uptick from 2024 to 2026.
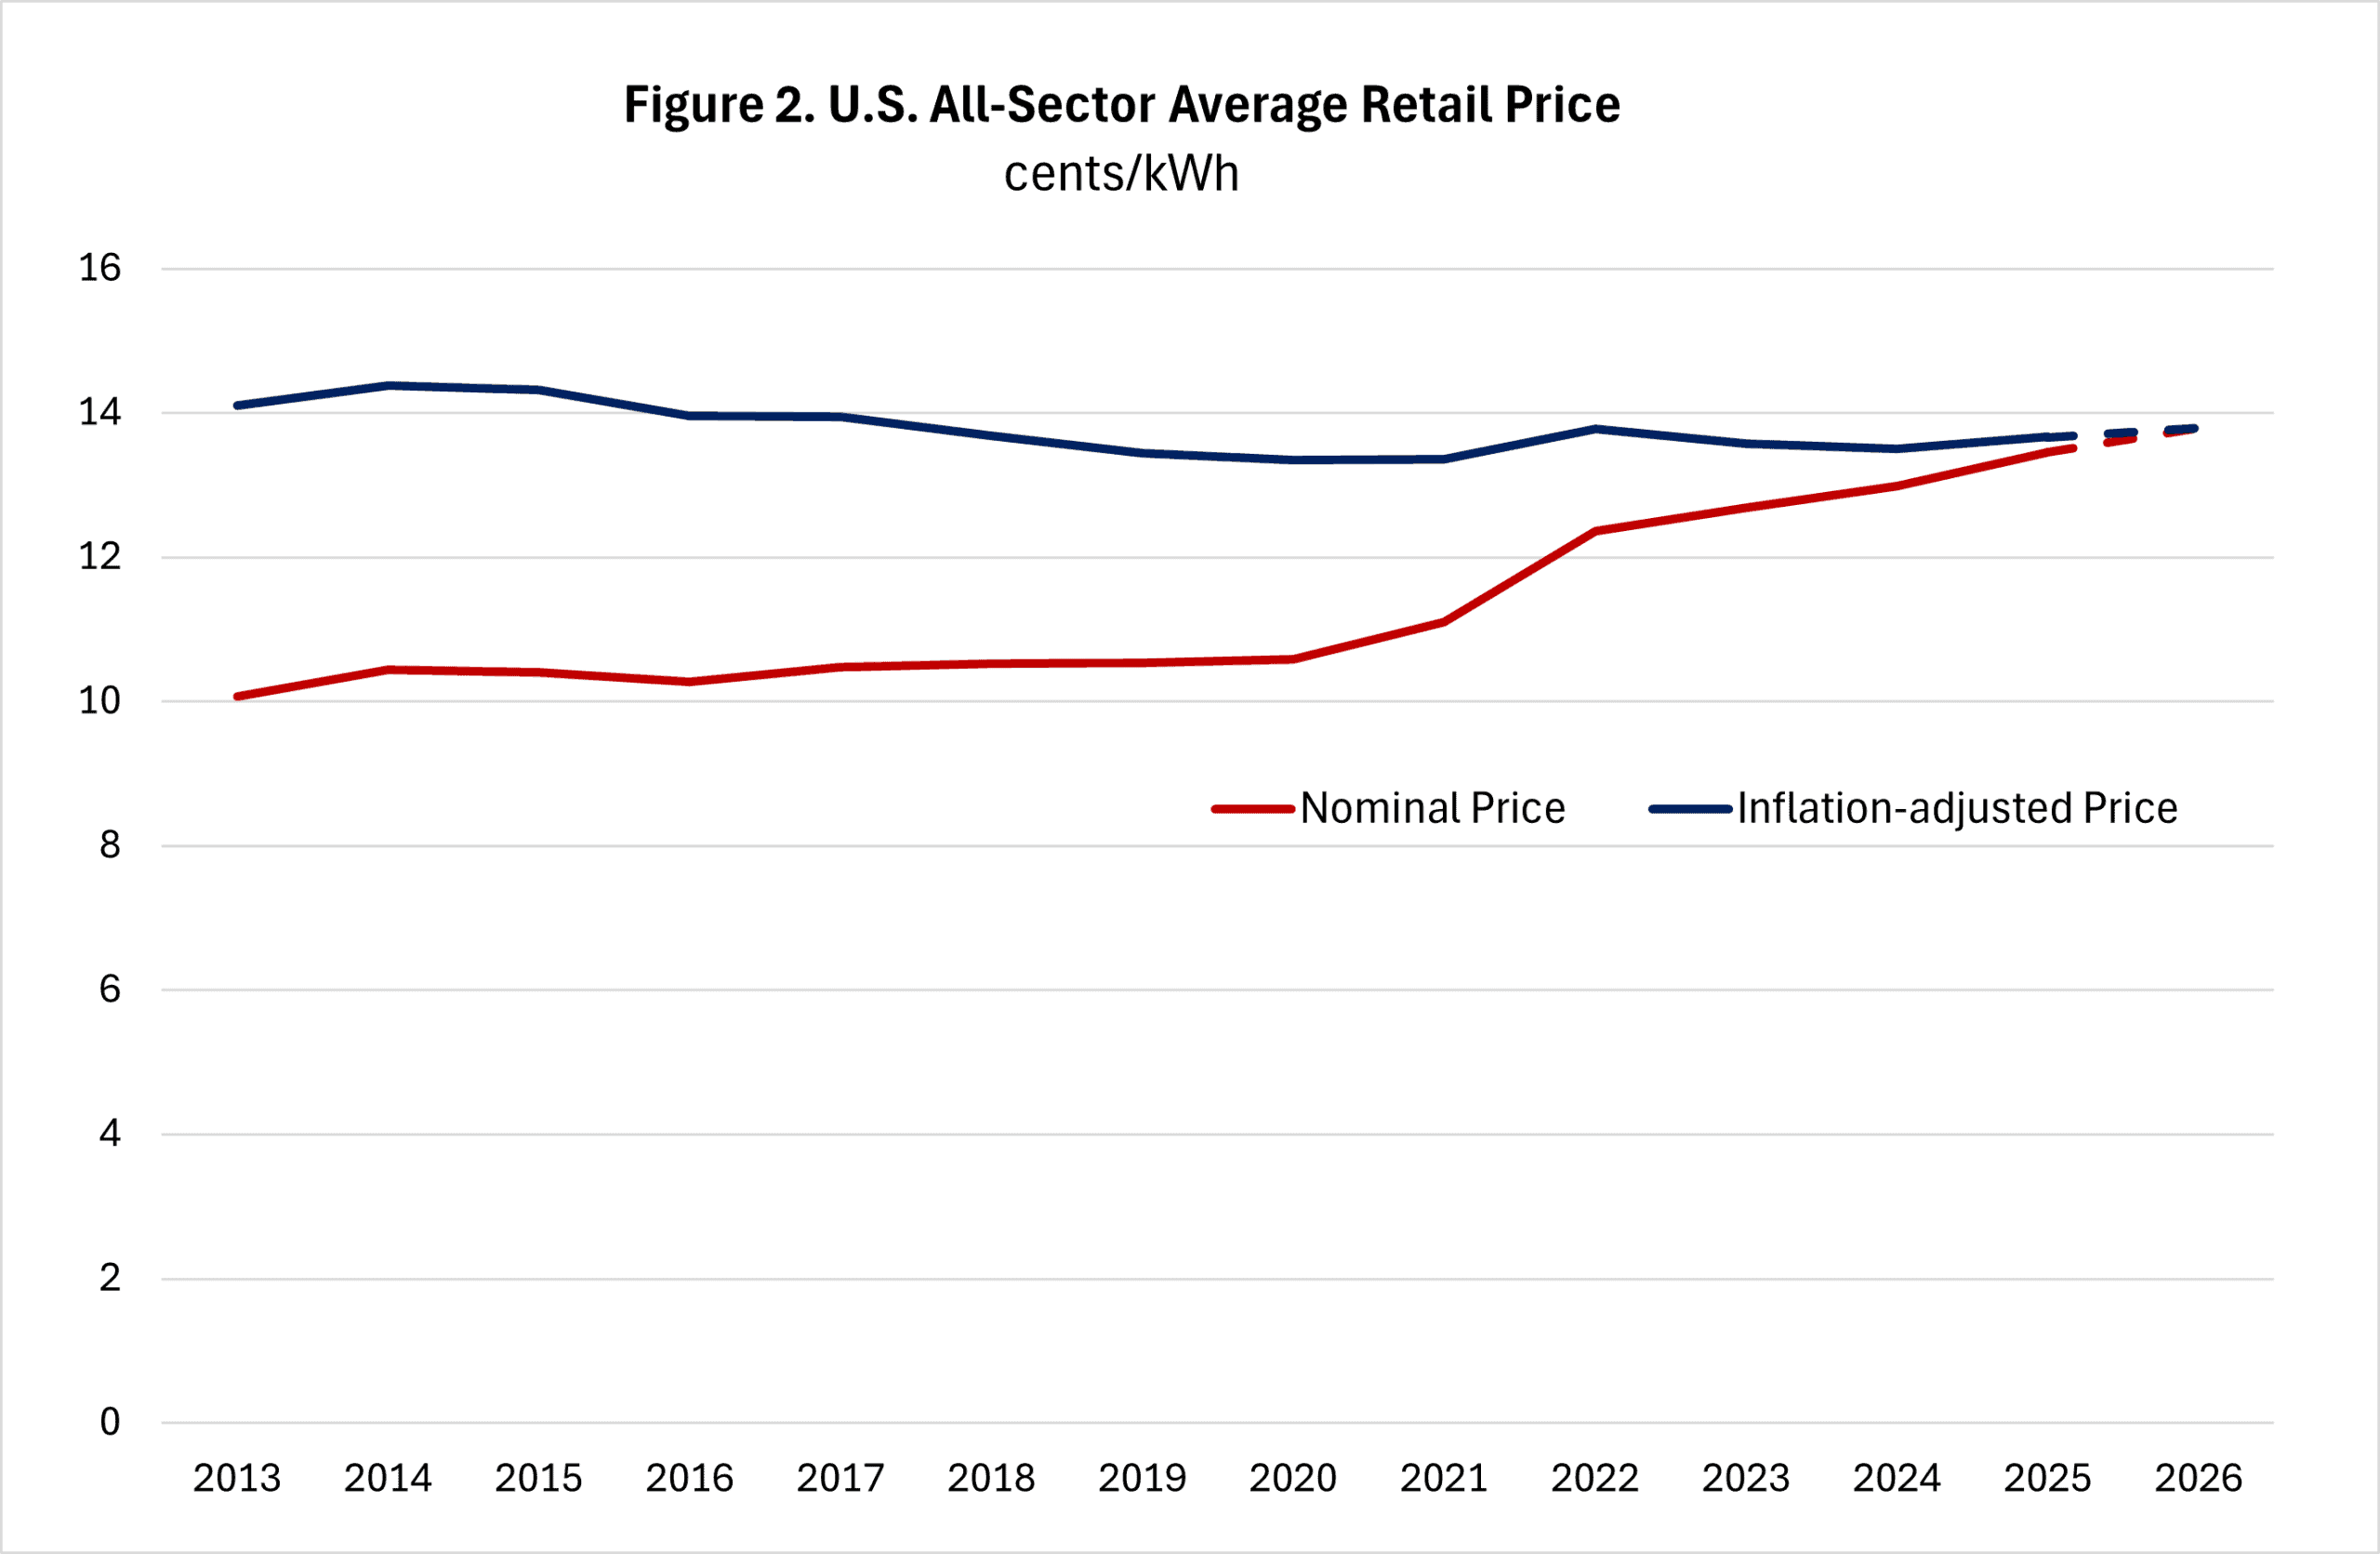
Source: U.S. Energy Information Administration; author’s analysis.
As shown in Figure 3, overall U.S. electricity price trends across residential, commercial, and industrial customer sectors align with the all-sector price trends: Nominal prices of all three sectors started growing in 2020 and are expected to continue growing at a lower rate from 2022 to 2026.
U.S. residential electricity nominal prices tracked inflation closely from 2015 to 2021 but have outpaced inflation since 2022. The residential sector stands out with its higher prices (projected to be close to 18 cents/kWh in 2026) and a more elevated nominal growth rate from 2023 to 2026. The commercial and industrial sectors will continue to see lower electricity prices (projected to be 13.5 cents/kWh and 8.54 cents/kWh, respectively, in 2026) compared to the residential sector.

Source: U.S. Energy Information Administration
State-level price trends
Changes in electricity prices varied significantly across states over the past year. From July 2024 to July 2025, some states saw bigger increases in nominal retail electricity prices compared to the national average of a 5-percent increase. For example, the District of Columbia, Maine, and New Jersey saw the largest percent increases of 24.5 percent, 22.9 percent, and 21.6 percent, respectively. Some states, such as Hawaii and Nevada, saw a decrease of 7.8 percent and 7.3 percent, respectively, in their residential electricity prices.
Over the past five years, from 2020–2025, residential electricity prices also saw varying percentage changes, albeit in smaller magnitude. As shown on the map below, in nominal prices, the residential electricity prices in Maine had the highest average nominal annual growth rate at 11.5 percent, followed by the District of Columbia (10.7 percent), and California (9.7 percent). In contrast, Iowa had the lowest average nominal annual growth rate of 1.7 percent, followed by South Dakota at 1.9 percent.
In real terms, residential electricity prices at the state level grew as fast as 6.6 percent annually on average from 2020–2025 in Maine and as slow as -2.5 percent in Iowa. (A negative real growth rate in Iowa means that the residential electricity prices in the state were growing slower than inflation.) About 40 percent of the states saw their residential electricity prices growing slower than inflation on average.
(Map only viewable in desktop setting)
Source: U.S. Energy Information Administration
Factors That Drive Increases in Electricity Prices
Supply and demand
The supply and demand market principle applies to the electricity market. High demand for electricity during a peak period (e.g., hot weather) or sharply reduced supply (e.g., an unexpected shutdown of a major power plant) would drive up retail prices of electricity.
As shown in Figure 5, U.S. demand for electricity started to rise drastically from 2023, driven by demand in the commercial and industrial sectors. The commercial sector is estimated to have a 3.2-percent increase in consumption of electricity from 2020 to 2026, mostly due to the enormous amount of power demand from AI data centers. EIA estimates that the industrial sector will see a 2.2-percent increase in electricity consumption over the same period as a result of more manufacturing activities.
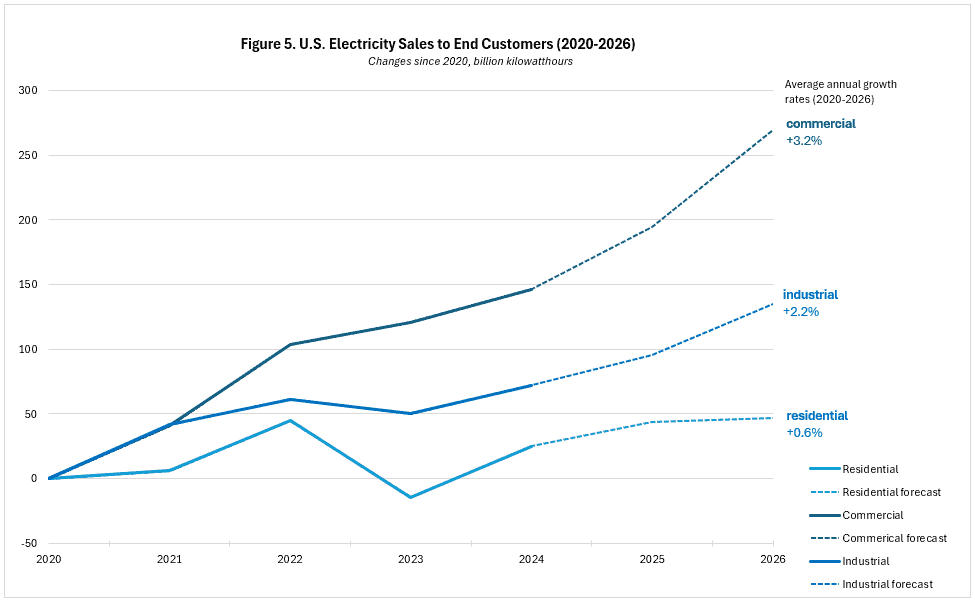
Source: U.S. Energy Information Administration
Total electricity supply is estimated to increase from 4,202.2 billion kWhs in 2023 to 4,544.6 billion kWhs in 2026, a steep increase compared to the past decade (Figure 6). Of the new electric generating capacity that will be added to the grid in 2025, EIA estimated that more than half will come from solar energy. Other major sources for new generation capacity are battery storage and wind power. The One Big Beautiful Bill’s (OBBB) rollback of the tax subsidies for clean energy and the administration’s disfavoring of solar and wind energy will eventually reduce the new capacity to be added to the grid, which would reduce the total supply of electricity. Nevertheless, the recent electricity prices increase is not driven by the overhaul of the energy subsidies in the OBBB, as some have claimed: Many of these energy tax credits will not phase out until after 2027.
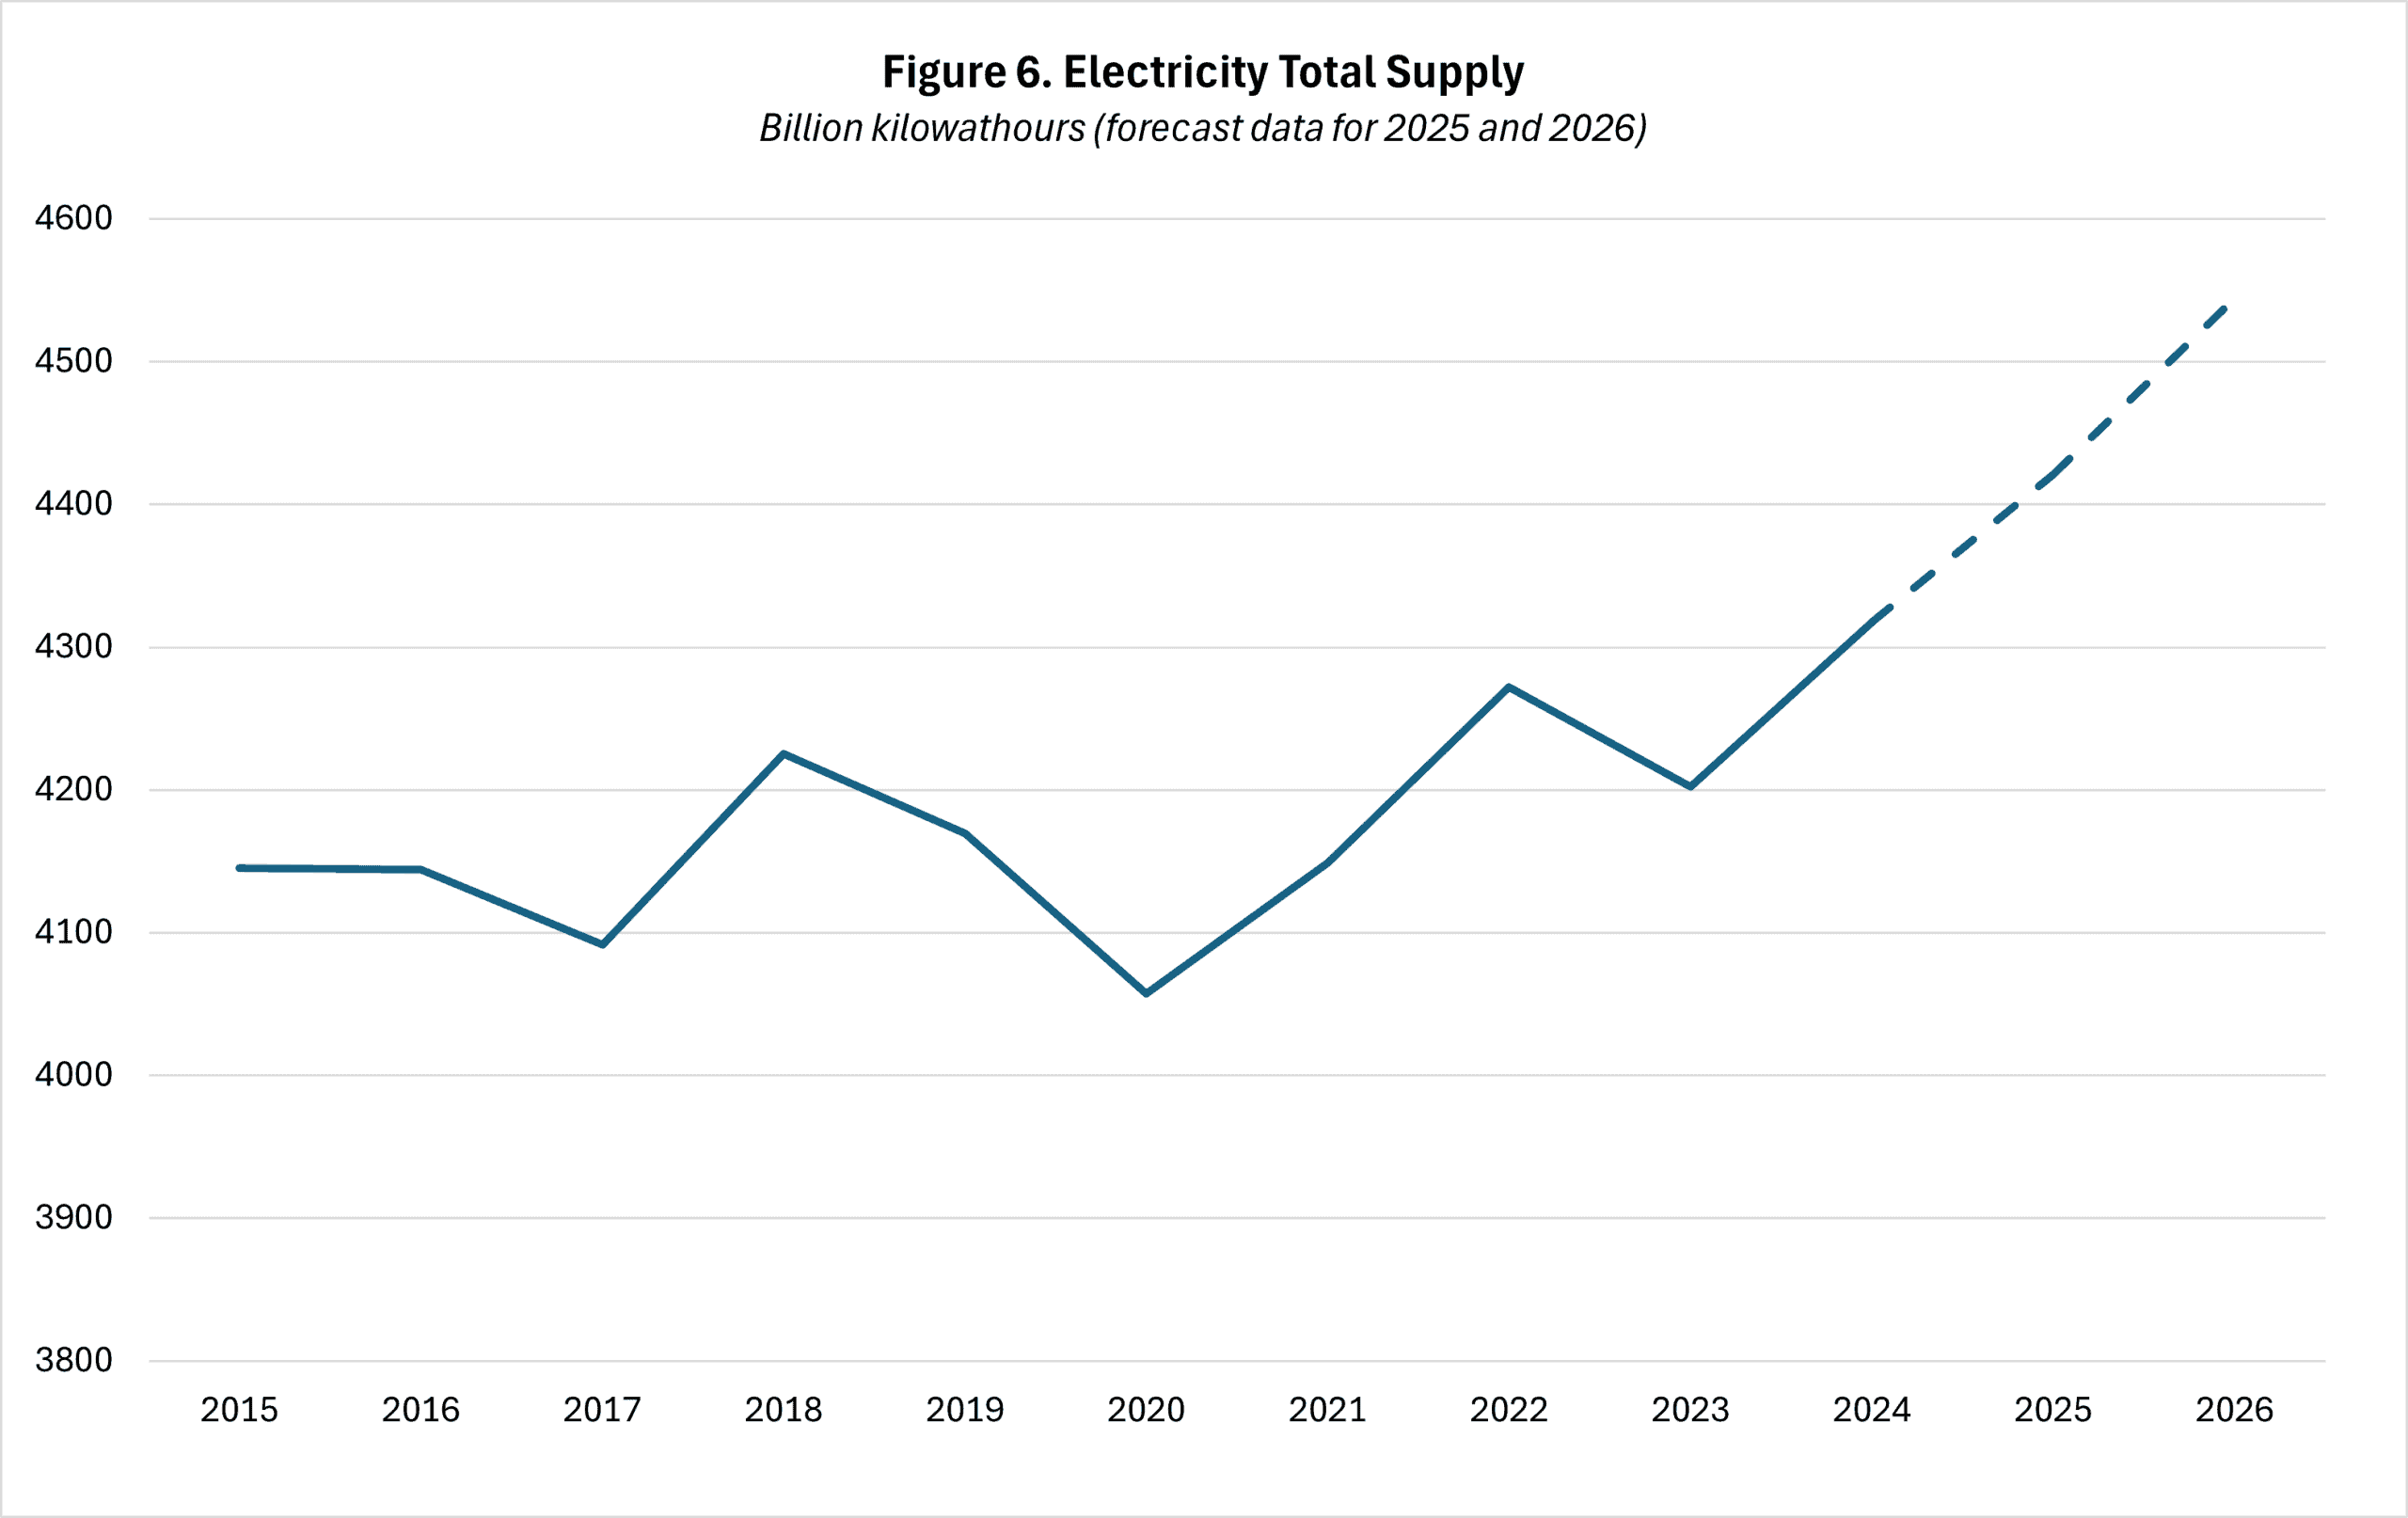
Source: U.S. Energy Information Administration
Generation, transmission, and distribution, weather conditions, and regulations
There are three major cost components of electricity prices: generation, transmission, and distribution. These variables influence the supply side of the electricity market – the costs utilities incur to produce and deliver electricity to customers. Generation refers to electricity production from various energy sources such as natural gas or solar power. Transmission is the process of transferring electricity from generation sites to local substations via long-distance, high-voltage power lines. Distribution is the final step of delivering electricity to residential customers from local substations via a low-voltage power line network. It’s much cheaper and more efficient to transfer electricity through high-voltage transmission lines than through low-voltage power lines in the local distribution system.
Costs associated with generating electricity include fuel prices (such as natural gas and petroleum fuels) and power plants’ financing, construction, and operating costs. Transmission- and distribution-related costs include construction, operation, maintenance, repairs, and upgrade of transmission and distribution power lines.
Additionally, weather conditions affect the costs associated with generation, transmission, and distribution. For example, extremely hot or cold weather would drive up electricity demand for air conditioning or heating. Abundant sun or wind can help bring more power to the grid, which could lower electricity prices.
Regulations also play an important role in determining a region’s electricity prices. The electricity industry, and in particular the electricity rate, is heavily regulated through a complex process. A utility is required to propose electricity rates based on its costs and profits considerations and get approval from the state’s utility regulator. There are also many other regulations that can affect electricity prices – for example, state-level regulations such as the renewable portfolio standard that mandate a state’s utilities to generate a certain amount of electricity from renewable energy sources. The costs the utilities incur to meet these standards are passed on to customers as part of the electricity bill.
Generation costs make up about 60 percent of average electricity prices nationwide, with the remaining 40 percent of costs coming from transmission and distribution. As shown in Figure 8, U.S. average nominal prices of electricity generation, transmission, and distribution have been increasing since 2021. In real terms, both generation and transmission costs started to trend upward from early 2023, while distribution costs of retail electricity sales have stayed relatively flat. Utilities’ rising spending on transmission and distribution is driven by the capital investment requirement to upgrade the aging U.S. transmission and distribution infrastructure.
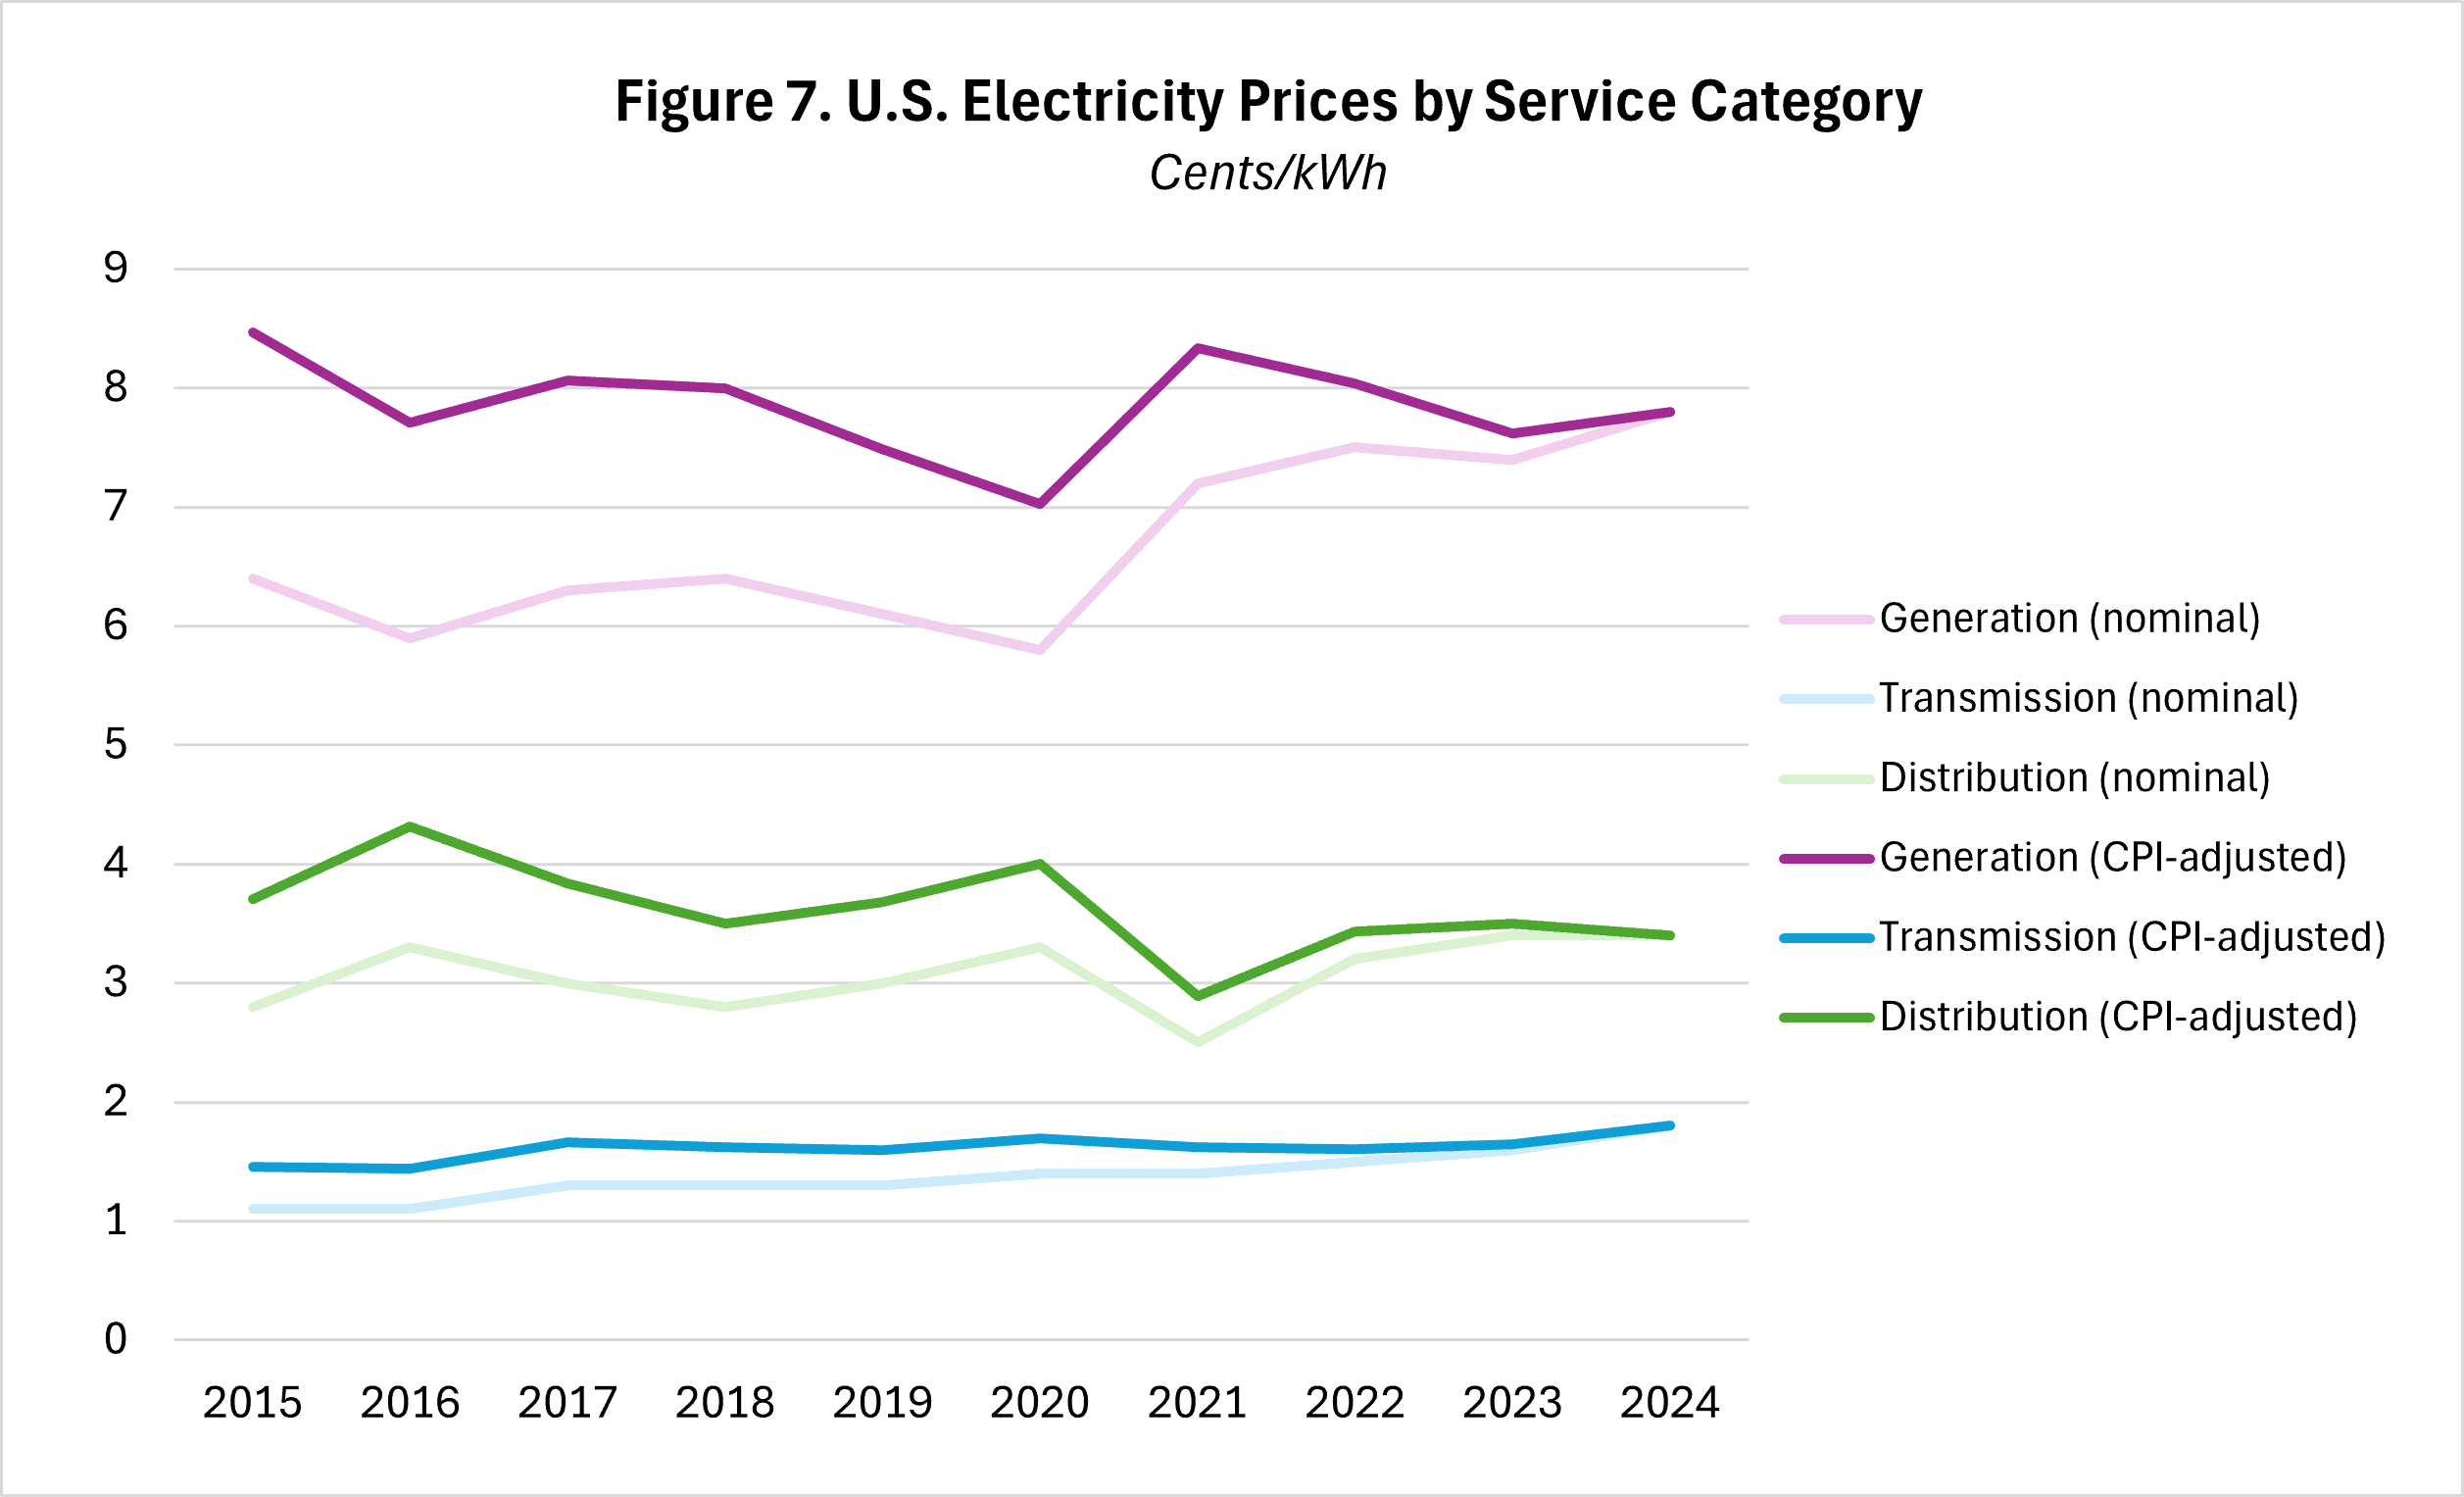
Source: U.S. Energy Information Administration
Differences between residential, commercial, and industrial sectors
Although the commercial and industrial sectors’ electricity demand is expected to outpace the demand from the residential sector (Figure 6), residential electricity prices have been historically much higher than the prices for the commercial and industrial sectors (Figure 3). This is mostly due to how the electricity market works and the different volumes of electricity these sectors consume.
The key to a functional electric system is to match demand for electricity and generation and delivery of electricity in real time. As a result, the volume of power demand, predictability of power usage, and cost of delivering the electricity to customers generally dictate that residential electricity prices are much higher than prices for the commercial and industrial sectors. Compared to the residential sector, the commercial and industrial sectors use significantly more power at a much more predictable schedule and pattern. Additionally, commercial and industrial sectors can connect to high-voltage transmission lines to receive electricity, whereas residential customers rely exclusively on the local distribution system, which is costly to maintain and upgrade.
Residential electricity prices are also increasing faster than the prices for the commercial and industrial sectors (Figure 3). This is mainly driven by the ballooning costs of repairing, maintaining, and upgrading the local distribution systems. Major utilities’ spending on local distribution systems has increased from $4.2 billion in 2013 to $6.4 billion in 2023 (Figure 8). While generation accounts for the majority of utilities’ expenditures, its associated costs are allocated across all sectors. In contrast, the residential sector bears most of the costs of the local distribution system, which explains the higher growth rate in residential electricity prices.
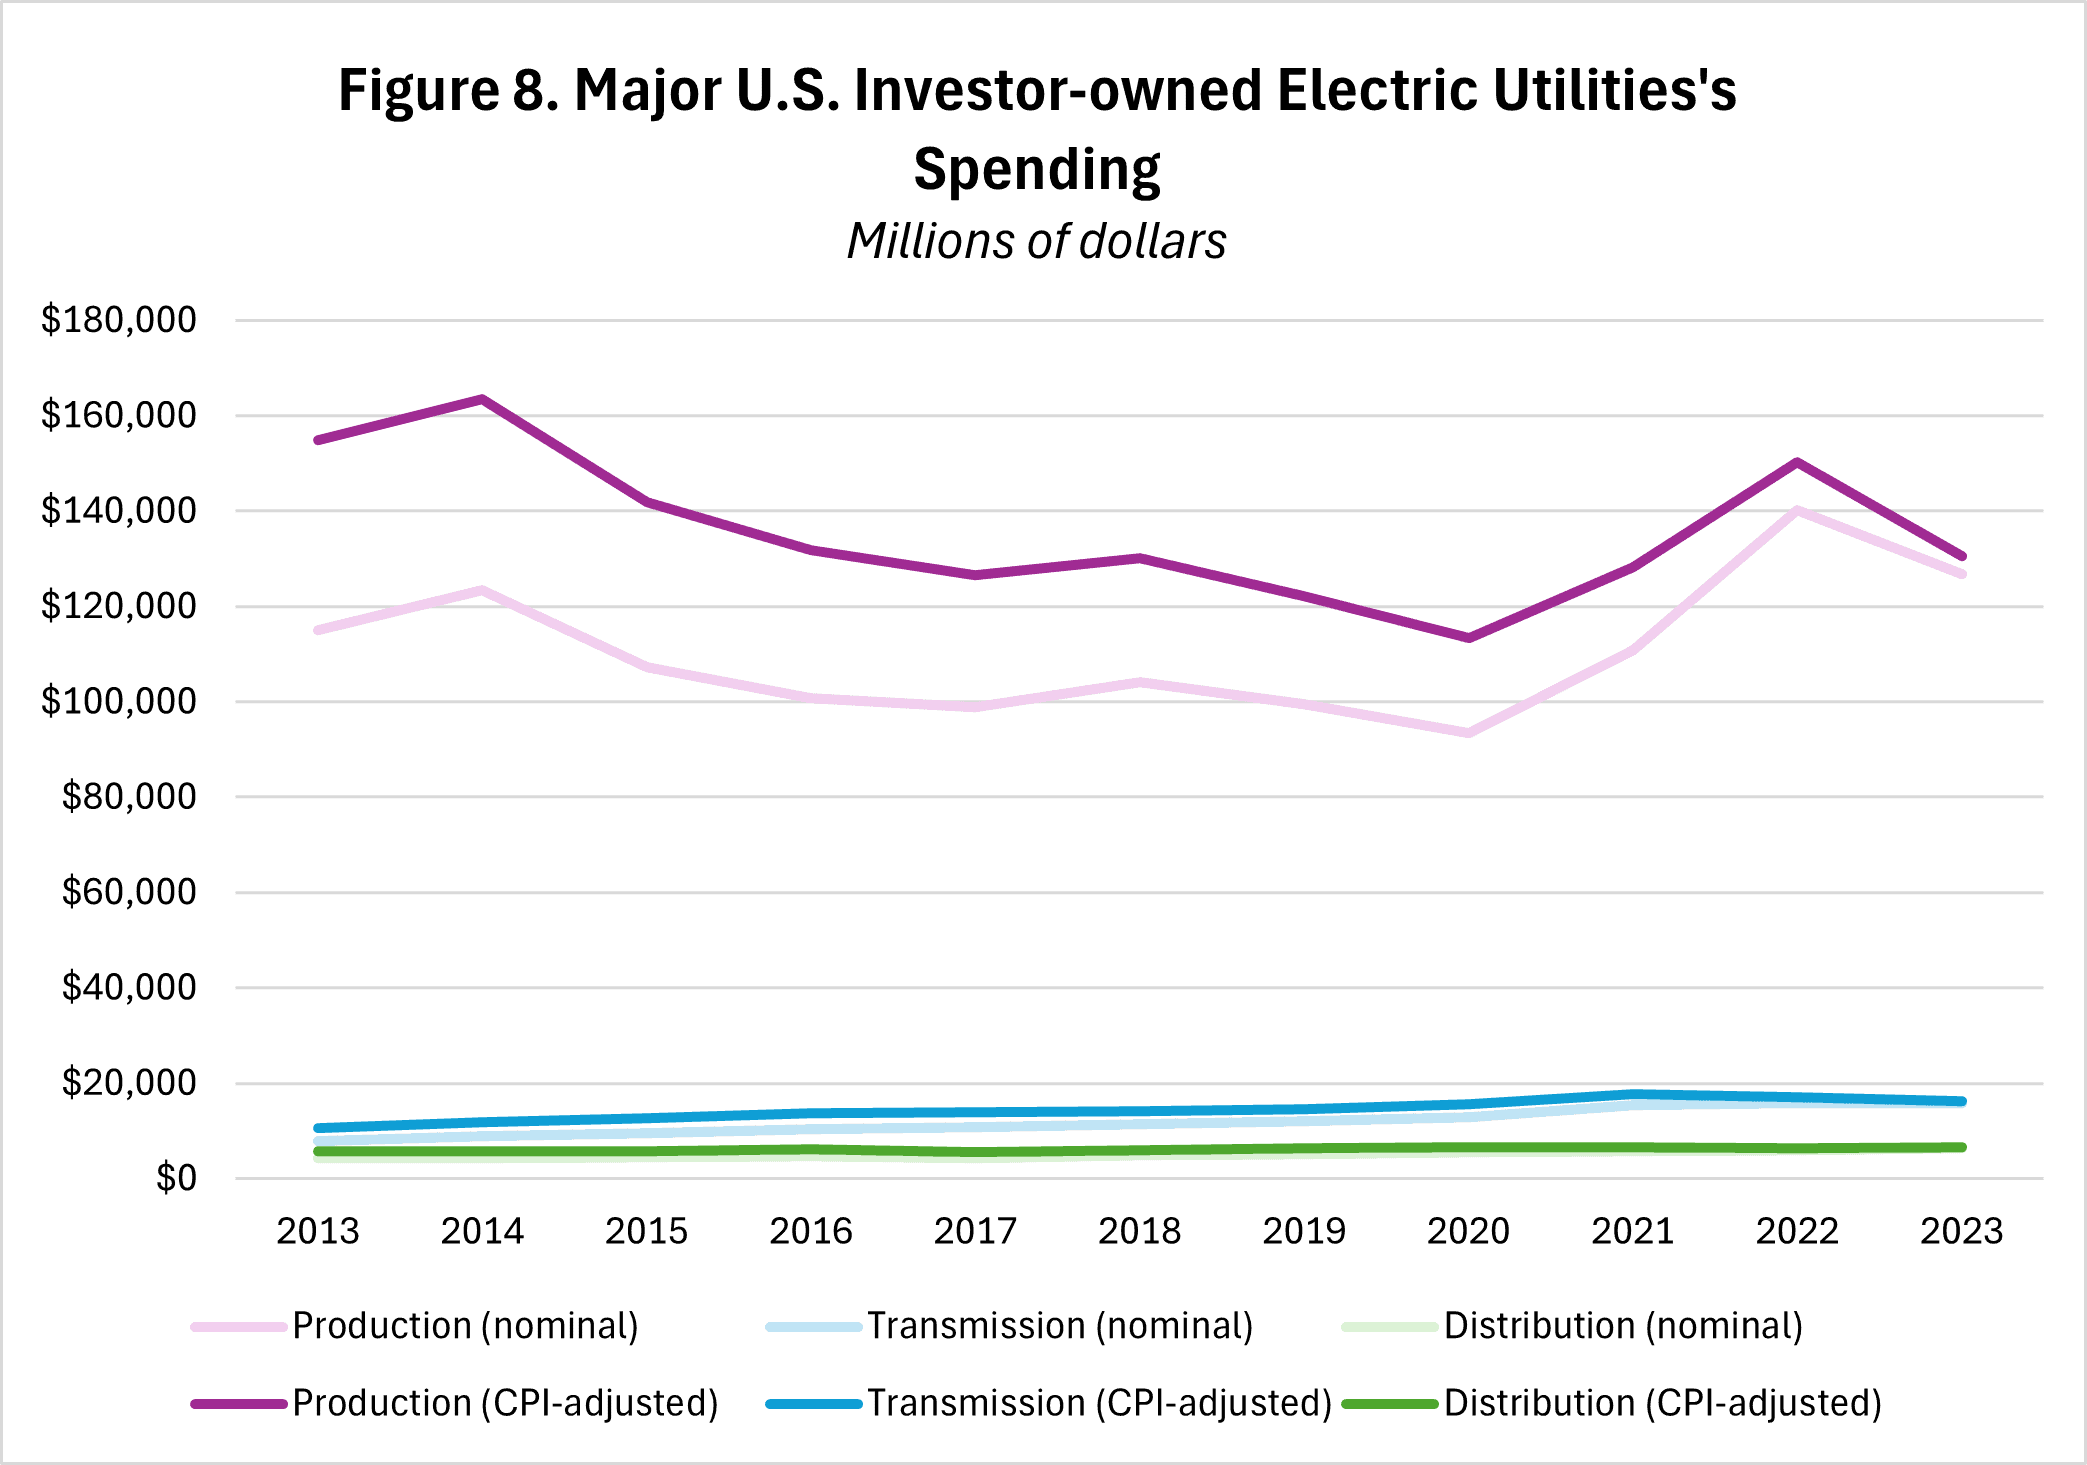
Source: U.S. Energy Information Administration
Looking Forward
Developments in several key areas will affect the future trajectory of U.S. electricity prices. Energy commodities prices (e.g., natural gas or petroleum) in the international markets may rise due to ongoing geopolitical conflicts, which would directly impact electricity generation costs. Additionally, the continuing development of AI technologies and AI data centers will increase U.S. demand for electricity significantly, which will very likely push up electricity prices for all end customers. President Trump’s tariff agenda will increase costs for imported products and equipment used across the electricity industry, which would put upward pressure on utilities’ costs of generation, transmission, and distribution. Finally, if ongoing efforts in permitting reform lead to effective legislative action, this would improve and expand existing transmission and distribution infrastructure, which will help lower electricity prices by bringing more electricity to the grid.
