Insight
October 11, 2022
NAEP, COVID-19, and K-12 Learning Loss
Executive Summary
- The National Center for Education Statistics recently released the results of its special 2022 iteration of the National Assessment on Education Progress (NAEP) Long-Term Trend reading and mathematics assessments for 9-year-old students across the United States.
- While NAEP scores were already trending downward prior to the COVID-19 pandemic, average scores declined precipitously further, with the largest declines among lower-performing students; this suggests lower-performing students stand to gain the most from any policy actions that seek to restore consistency and stability to K-12 education systems.
- If left unaddressed, the education losses at the K-12 level over the past decades will in the long run translate to losses in labor markets and decreased economic growth and prosperity.
Introduction
In September, the National Center for Education Statistics (NCES) released the results of its special 2022 iteration of the National Assessment on Education Progress (NAEP) Long- Term Trend (LTT) reading and mathematics assessments for 9-year-old students across the United States. NAEP LTT assessments differ from main NAEP assessments in that they “measure students’ educational progress over long time periods to look for and monitor trends in performance.”[1] The 2022 NAEP LTT results suggest the education disruption seen during the COVID-19 pandemic reversed two decades’ worth of educational progress at the K-12 level. While average math and reading scores have been declining since 2012, they dropped dramatically from their 2020 levels, below their 2004 averages.
The 2022 NAEP LTT results demonstrated stark differences in outcomes by student characteristics. For both reading and math, students who were relatively higher performers saw their scores decrease less compared to students who were relatively lower performers. The overall decrease in the national averages were largely driven by decreases in averages of the relatively lower-performing students. As lower-performing students were disproportionately affected by the disruptions caused by the COVID-19 pandemic, these students also stand to gain the most from any policy actions that restore consistency and stability to K-12 education systems.
As with NAEP LTT, main NAEP scores were also on a troubling downward trend. The 2019 results, the most recent for main NAEP assessments, demonstrated that not only was there a disappointing number of students at the proficient level or higher, the average scores for various subjects and grade levels stagnated and even decreased through the 2010s. While main NAEP and NAEP LTT scores are not directly comparable, their shared downward trends suggest public K-12 education performance regressed throughout the 2010s and that this trend accelerated during the COVID-19 pandemic. Education, like many other things, is cumulative in both gains and losses. Thus, if left unaddressed, the education losses seen at the K-12 level through the past decades will inevitably translate to long-run losses in labor markets and decreased economic growth and prosperity.
2022 National Assessment on Education Progress Long Term-Trend Assessments Results
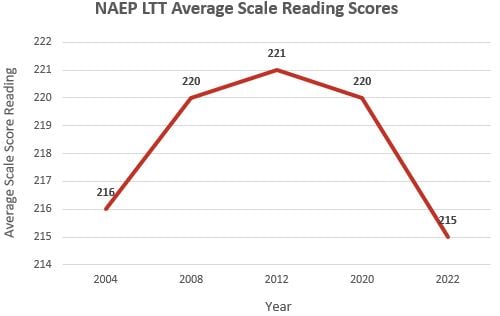
Compared to 2020 scores, the 2022 average reading scores for 9-year-old students declined by five points, from 220–215, or about 2.3 percent. This is the largest decline in NAEP LTT reading scores for these students since 1990. The 2022 average reading score of 215 falls between the average reading scores from 1999–2004. Similarly, the average math scores for 9-year-old students declined by seven points, from 241–234, a 2.9 percent decrease. The 2022 average math score of 234 also now falls between the average math scores from 1999–2004. The data suggest the educational disruptions caused by the COVID-19 pandemic set educational progress back by about two decades. Again, it is important to note that from 2012–2020, the average reading and math scores were already decreasing, albeit at a slower rate. These figures can be found in Chart 1 and Chart 2.
Chart 1: Average Scale NAEP LTT Math Scores for Students Aged Nine
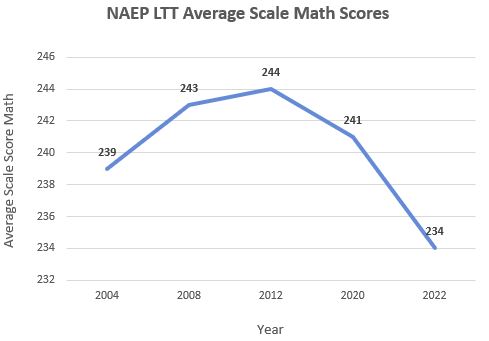
Chart 2: Average Scale NAEP LTT Reading Scores for Students Aged Nine
Stark Differences Across Student Performance
There were stark differences in performance declines across student characteristics in the 2022 NAEP LTT results. Chart 3 displays the percent change of average math test scores, tabulated by student performance, which is displayed by percentiles/quartiles. Students who were in the 10th percentile of performance, and therefore relatively lower performing, saw their average scores decline by about 6.8 percent. Subsequent percentiles saw a progressively shrinking decline in scores. At the 90th percentile, which consists of the highest-performing students, the average test scores declined by just over 1 percent.
Chart 3: Percent Change in 2022 NAEP LTT Average Math Scores by Student Percentiles of Performance

There was a similar dynamic in reading scores, as seen in Chart 4 below. The students in the 10th percentile of performance saw their average scores decline by about 5.5 percent. Each subsequent quartile has a smaller decline. The 90th percentile saw its average scores decline by less than 1 percent.
Chart 4: Percent Change in NAEP LTT Average Reading Scores by Student Percentiles of Performance
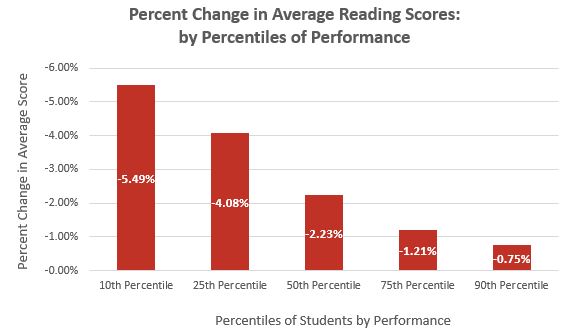
The 2022 NAEP LTT results show decreases in performance were lower for higher-performing students. Therefore, the declines in scores among lower-performing students contributed the most to the average score declines. These results suggest the higher-performing students were better able to weather pandemic-related disruptions in terms of achievement and performance. The results also suggest that lower-performing students stand to gain the most from policy actions that seek to restore consistency and stability in K-12 education systems.
Main NAEP: Scores Were Decreasing Even Before the Pandemic
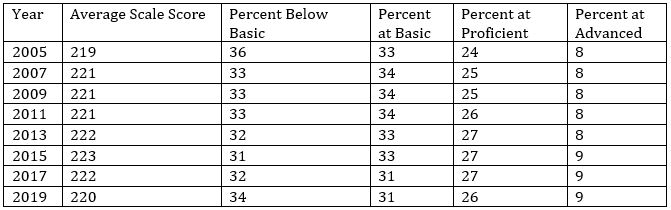
As seen in Charts 1 and 2 above, even before the pandemic NAEP LTT scores had decreased in both subjects through the 2010s. As with NAEP LTT, main NAEP scores were undergoing a similar dynamic of stagnation and regression through the 2010s.[2] Table 1 contains the average scale math scores for the main NAEP assessments of fourth graders. While their scores had increased through the 2000s and early 2010s, they started to dip later in the 2010s. Table 1 also contains the percentages of students in various achievement levels. One can see the percentage of students scoring at the advanced level has increased over time. The decreases in average scale scores are therefore mostly due to movement among the students at the “basic” and “below basic” levels. This is a very similar dynamic as seen in Charts 3 and 4, where the decline in 2022 NAEP LTT average scales scores was mostly due to declines in scores among the lower-performing students.
Table 1: Main NAEP Average Scale Math Scores Grade 4: Achievement Levels Discrete
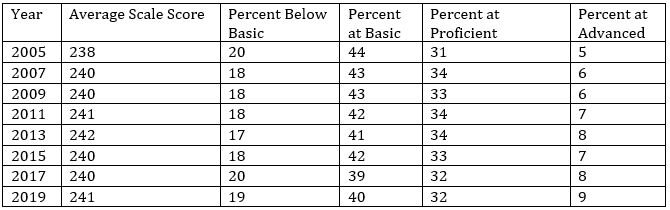
Table 2 contains the same figures as Table 1 but for main NAEP reading scores. Main NAEP reading scores for fourth graders decreased through the 2010s and finally decreased in 2019 below the 2007 level. Again, the changes in average scale scores are most associated with movement among the lower-performing groups of students. Both tables reveal an uncomfortable truth: The majority of fourth-grade students are performing at or below the basic level.
Table 2: Main NAEP Average Scale Reading Scores Grade 4: Achievement Levels Discrete
Main NAEP and NAEP LTT scores are not directly comparable due to differences in framework and assessment content (click here for additional information). Their shared downward trends, however, suggest public K-12 education performance has at least stagnated, or even regressed, throughout the 2010s, and has regressed even more due to the COVID-19 pandemic. The declines in the 2010s and the decline from the COVID-19 pandemic were disproportionately realized by the lower-performing students.
Conclusion
The LTT NAEP scores show a stagnation and even regression in K-12 performance through the 2010s, followed by a clear regression during the pandemic from 2020–2022. Data from both tests show the greatest driver of the drop in average scores are declines in performance among lower-performing students. Policy actions that seek to restore consistency and stability in K-12 systems will likely benefit all students but may be particularly helpful in boosting educational outcomes for lower-performing students. If left unaddressed, the education losses at the K-12 level over the past decades will in the long run translate to losses in labor markets and decreased economic growth and prosperity.
[1] https://nces.ed.gov/nationsreportcard/ltt/
[2] https://www.nationsreportcard.gov/ndecore/